 Open Access Article
Creative Commons Attribution 3.0 Unported Licence
Dynamics of capillary transport in semi-solid channels
Johanna
Andersson
 ab,
Anna
Ström
 *ab,
Tobias
Gebäck
bc and
Anette
Larsson
ab
aDepartment of Chemistry and Chemical Engineering, Chalmers University of Technology, Göteborg, Sweden. E-mail: anna.strom@chalmers.se; Tel: +46 (0)31-7723406
bSuMo Biomaterials, VINN Excellence Centre, Chalmers University of Technology, Göteborg, Sweden
cDepartment of Mathematical Sciences, Chalmers University of Technology, Sweden
First published on 31st January 2017
Abstract
Capillary action has been described by Lucas and Washburn and extensively studied experimentally in hard materials, but few studies have examined capillary action in soft materials such as hydrogels. In tissue engineering, cells or dispersions must be often distributed within a hydrogel via microporous paths. Capillary action is one way to disperse such substances. Here, we examine the dynamics of capillary action in a model system of straight capillaries in two hydrogels. The channels had a circular cross-section in the micrometer size range (180–630 μm). The distance travelled over time was recorded and compared with the predictions of Lucas and Washburn. Besides water, we used a sucrose solution and a hydroxyethyl cellulose solution, both with viscosities slightly higher than that of water. The results showed that the distance travelled is proportional to the square root of time,  , and that larger capillaries and lower viscosities result, as expected, in faster speeds. However, the absolute experimental values display large discrepancies from the predictions. We demonstrate that several possible reasons for these discrepancies can be ruled out and we describe a novel hypothesis for the cause of the retarded meniscus movement.
1 Introduction
Tissue engineering, prosthetic implantation, and controlled drug delivery are expanding fields where the control of artificial biomaterials is crucial for system success. The chemical composition, mechanical properties, degradation rates, and micro- and macroscopic structures of biologically appropriate materials have been examined in many studies.1–3 The field has seen significant advances, such as the regulation of mesenchymal stem cell activity and proliferation by tuning the hydrogel's stress relaxation4 or the injection of hyaluronic acid as a space filler.5,6 However, we lack a reliable method to disperse a concentration of soluble species, metabolites, therapeutics, or anti-fouling agents within a three-dimensional network in the bulk.7 To address this deficiency, promising attempts have been made to transport substances within such three-dimensional networks. Hydrogels are often biocompatible because of their hydrophilicity and inherent similarity to our own tissues and extracellular matrices.6–9 Choi et al. and Cabodi et al. fabricated a microfluidic system made of a hydrogel for dispersing desired substances or for cell seeding and growth, with the flow driven by an externally applied pressure.7,9 Garg et al. used capillary action in a dried alginate gel as a matrix for cell growth, as they found capillary flow to be better in terms of cell seeding efficiency, cell dispersion, and cell viability than the previously described seeding approaches of injection, centrifugal, and orbital cultures.8 As we demonstrate here, the drying step is unnecessary, as capillary action in a templated hydrogel can be used to eliminate the need for the drying step. Capillary action has the advantages of being considerably faster and easier to use than external pressure-driven flow and not requiring extra equipment to distribute the liquid; in addition, less wetting liquid or cell solution is needed in the absence of a pump or the like. Besides its promising use in the above applications, capillary action is a phenomenon occurring in various other applications, such as wound care and hygiene products, printing on paper, oil recovery, and absorbent textiles. In all of these applications, it is important to be able to predict and tailor the mass transport in porous materials, resulting in desired properties.The driving force for capillary action is the pressure difference created by the curved meniscus of a liquid evolving in a capillary, i.e. the Laplace pressure or capillary pressure:10,11
 | (1) |
![[thin space (1/6-em)]](https://www.rsc.org/images/entities/char_2009.gif) θ > 0, so the liquid will penetrate the capillary. Or if the free surface energies are compared, penetration of the capillary occurs when the surface energy of the dry wall, γSG, is greater than that of the wet wall, γSL (γSG > γSL).12 The opposing force is the viscous force known as the Poiseuille flow:
θ > 0, so the liquid will penetrate the capillary. Or if the free surface energies are compared, penetration of the capillary occurs when the surface energy of the dry wall, γSG, is greater than that of the wet wall, γSL (γSG > γSL).12 The opposing force is the viscous force known as the Poiseuille flow: | (2) |
![[V with combining dot above]](https://www.rsc.org/images/entities/i_char_0056_0307.gif) the volume flow, which can be replaced with πr2Δx/Δt for a circular-cross-section channel of radius r and time t. By setting Δpc = Δpv while neglecting inertia and gravity, the Lucas–Washburn (LW) equation10,11 is obtained:
the volume flow, which can be replaced with πr2Δx/Δt for a circular-cross-section channel of radius r and time t. By setting Δpc = Δpv while neglecting inertia and gravity, the Lucas–Washburn (LW) equation10,11 is obtained: | (3) |
 , i.e. the length below which capillary forces are predominant over gravitational forces, is 2.7 mm for water, which explains the rough magnitude of the previous statement. The general relationship of
  is observed in many studies, after a lag while the liquid overcomes inertial forces and using capillary diameters in the range of micrometers13–17 down to a few nanometres.18–20 While the
  relationship holds in many cases, the results frequently deviate from eqn (3) when absolute values are inserted.21–23 The deviation of the experimental results from those predicted using the LW equation is often attributed to the exclusion of inertial forces, which, in particular, leads to such deviations in three-dimensional porous structures comprising channels of a range of diameters, such as foams, causing the flowing liquid to accelerate and decelerate throughout the system.24 Bosanquet, included inertial forces in eqn (3).25 By balancing the acting forces and including the momentum of the liquid column, πr2ρxẋ, the equation of motion becomes:
 | (4) |
 | (5) |
 | (6) |
While capillary action has been studied extensively in many hard materials such as glass and silicon wafers,13,17,18,21 to the authors' knowledge, no study describes the dynamics of capillary action in hydrophilic soft materials. However, it is observed that a drop spreads significantly more slowly on a soft substrate than on harder substrates31 and forced wetting results in pinning effects on the contact line.32 These effects are caused by the local deformation of the substrate, which in turn leads to contact line deformation, termed the wetting ridge, which originates from the vertical component of surface tension in the wetting liquid.32 Swelling is another factor to be considered if the wetting liquid is soluble in the substrate,33 which is enhanced at the three-phase contact line due to increased local flux in turn caused by increased evaporation in these areas.34
One polymer used to form gels in the area of bio-applications or biomedicine is alginate.7–9 It is a negatively charged polysaccharide derived from seaweed and consisting of repeating units of linearly (1→4)-linked β-D-mannuronic acid (M units) and α-L-guluronic acid (G units).35 In the presence of multivalent cations, such as Ca2+, alginate forms a gel linking only the G units and forming a network in the form of an “egg box”-model.36,37 The composition of M and G units depends, among other factors, on the plant species, season, and growth conditions.35 Another hydrogel commonly used in biomedical applications is agarose. It is the neutral fraction of the two major fractions in agar, which originates from red algae.38 Agarose powder is soluble in water at elevated temperatures and forms a gel upon cooling at 35–48 °C, with the methoxyl content influencing the gelling temperature.37 When the water–agarose mixture cools, agarose chains form a double helix.37 The properties of the gel depend on the cooling rate, since the system spatially optimizes its structure with increasing time.37
The aim of this study was to determine the dynamics of capillary action in hydrogels in which a straight capillary was created. Capillaries with cross-sections of 180–630 μm were investigated and the distance travelled over time by a wetting liquid was recorded. Furthermore, we wanted to study the penetration behaviour of a sucrose solution having a high concentration of solutes and higher viscosity than water, generating osmotic pressure. The sucrose solution was also compared with a hydroxyethyl cellulose (HEC) solution having a low concentration and therefore a low osmotic pressure at a viscosity similar to that of the sucrose solution. Experiments were conducted using alginate and agarose gels. Note that in the following text, the terms wicking, imbibition, capillary action, and infiltration are used synonymously to refer to the surface-tension-driven flow.
2 Experimental
2.1 Materials
Hydrogels were prepared using Protanal RF 6650 alginate containing 70% guluronate (kindly provided by FMC Biopolymer, Girvan, UK), Mikhart 2 calcium carbonate CaCO3 (Provencale SA, Brignoles, France) with an average particle size of 10 μm,39D-(+)-gluconic acid δ-lactone (GDL; Sigma-Aldrich, Darmstadt, Germany), and agarose (BioReagent, for molecular biology; Sigma-Aldrich, USA). The wetting liquids were Milli-Q water alone, with added hydroxyethyl cellulose (HEC; Hercules, Wilmington, USA), or with added sucrose (Nordic Sugar, Arlöv, Sweden). All wetting liquids were stained with methylene blue (Fluka Chemie, Buchs, Switzerland) to increase the optical contrast to the material and ruthenium red (Sigma-Aldrich, Darmstadt, Germany) was used to stain alginate gel for analyzing microscopic cross-sections.2.2 Gel preparation
An aqueous alginate solution containing 2% w/w alginate was prepared by adding alginate at room temperature (RT) under vigorous stirring. The dispersion was then heated to 80 °C for 30 min, after which it was left to cool to RT and the pH was adjusted to 7. Immediately before gel preparation, the alginate solution was deaerated under vacuum for approximately 10 min. Controlled gel formation was achieved by mixing CaCO3 and GDL in water just before adding the alginate solution to yield a final alginate concentration of 1.7% w/w. The stoichiometric relationship of calcium ions to G units of alginate was 0.8. To form straight capillaries with circular cross-sections, immediately after mixing, the mixture was suctioned into 1 mL disposable syringes, each with a nylon string (of various diameters; nylon, monofilament) inside to create a channel with a circular cross-section. After standing for 24 h at RT, the gel was used for wicking experiments and subsequently discarded. The strings were gently removed before the use of the gel to leave a straight empty capillary. The actual diameter was measured by slicing the gel, staining it with ruthenium red and measuring the cross-section of the channel under a microscope (Axio Scope.A1; Zeiss, Oberkochen, Germany). The following diameters were determined: 180 (±10), 250 (±7), 410 (±2), and 630 (±29) μm. Agarose gels were prepared by boiling 2% (w/w) agarose on a hot plate for 5 min and subsequently replacing the evaporated water. The procedure continued in the same way as described above, resulting in gels upon cooling to RT. Channels of 250 μm were produced in agarose gels.2.3 Wicking measurements and analysis
Wicking measurements were carried out by connecting the channel in a horizontal position to a drop of ultra-pure water stained with methylene blue (0.03% w/w) and recording the spontaneous infiltration using a camera (EX-ZR300; Casio, Tokyo, Japan) acquiring up to 120 frames per second. The video was separated into single frames using FFmpeg software (2013-07-09 git-00b1401) and the liquid was tracked using ImageJ (1.50b).2.4 Surface tension
The surface tension of the water after adding methylene blue, sucrose, and HEC solutions was measured using an optical tensiometer (Attension Theta Lite; Biolin Scientific, Stockholm, Sweden) using the pendant drop technique. Due to the short durations of the wicking measurements, the surface tension was determined only within the first 3 s after a droplet was created.2.5 Contact angle measurements
The material surfaces were characterized using a Fibro DAT1100 dynamic contact angle analyser (Fibro System AB, Hägersten, Sweden) after depositing a drop of pure water on the flat surface of the gel. Images were automatically acquired at 20 ms intervals directly after deposition of the drop. The mean contact angle of water on the gel surface was determined for at least five droplets. Staining the water with methylene blue was found not to influence the results. In addition, the dynamic contact angle of the moving meniscus was measured directly in a capillary. A high-speed camera (DCU223m; Thorlabs, Newton, NJ, USA) was connected to an objective (10× Plan Achromat Objective, 0.25 NA; Olympus, Tokyo, Japan), serving as a microscope, which was pointed towards the channel at a specified distance from its entrance. The camera, operating at approximately 140 fps, captured four to eight images per experiment, depending on the speed of the meniscus. The speed at the point of measurement could be determined from the image series using the same method as described above for the wicking measurements. The contact angles were determined using ImageJ.2.6 Rheology
Oscillatory rheology measurements were carried out on the gels using an MCR300 rheometer (Anton Paar Physica, Ostfildern-Scharnhausen, Germany) with a cone–plate geometry. The cone had a diameter of 50 mm and an angle of 1°, and the gap between the cone and the plate was 52 μm. The temperature was controlled using a Peltier system and set to 20 °C. The strain was measured at a constant frequency of 1 Hz at shear stresses of 0.1–12 Pa.The viscosity of the wetting liquids was measured using the same cone and plate and by applying rotational motion between shear rates of 1–600 s−1 and 600–1 s−1.
3 Results and discussion
When a sufficiently small capillary is connected to a wetting liquid, the liquid will automatically penetrate the channel at a decreasing speed over time. Below, we will explain how our results are congruent with the LW predictions for θ < 90°, consider what is not congruent, and rule out a number of reasons for the deviations. Finally, we will demonstrate how our results can be interpreted in a novel way.3.1 Infiltration speed in hydrogels follows the x2 ∝ t relationship
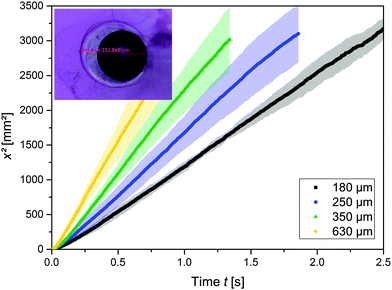
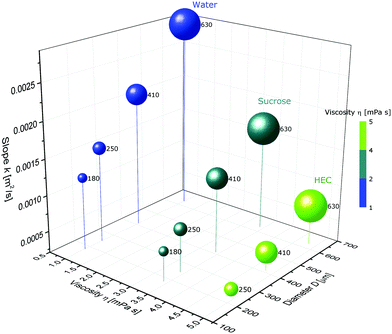
A droplet of pure water connected to a hydrogel penetrates a 6 cm-long micro-channel in the hydrogel in less than 3 s. Fig. 1 represents these dynamics for water in an alginate gel. The squared distance, x2, that the water travelled is plotted over time, t, through capillaries of 180, 250, 410, and 630 μm inner diameters. The data points represent the means of at least five experiments, while the shaded areas represent the standard deviation. The smaller the capillary diameter, the slower the wicking speed. This trend corresponds to the LW predictions given by eqn (3). In Fig. 1, one can see that the squared travelled distance is proportional to the time, x2 ∝ t, as also predicted by eqn (3). We observed this relationship in all the experiments, including those using agarose gels, and previous studies support this relationship, irrespective of whether porous materials or single channels are involved, if we disregard very early times when inertial forces are predominant.13–20,25 The gels were investigated for damages and the real diameter of the capillaries was determined by slicing the gels into cross-sections, as shown in the inset in Fig. 1. Using a 10× magnification lens revealed no roughness left by the strings and in line with that very little force was necessary to remove the strings from the gel. Wicking experiments were also conducted using liquids with differing concentrations and thus osmotic pressures, but similar viscosities, namely, a sucrose solution (21.4% w/w) and a HEC solution (0.1% w/w); the properties of these liquids are presented in Table 1. Fig. 2 shows the slopes of the squared distance over time, k = Δx2/Δt, plotted over the viscosity, η, of the wetting liquids and the capillary diameter, D, in alginate gels. The ball sizes represent the capillary diameters, which are also indicated in μm next to the balls; the ball colours show the viscosity, as indicated. It can be seen that low viscosities and large capillary diameters result in the steepest slopes, i.e. the capillary action is the fastest, while at high viscosities and small diameters the capillary action is the slowest, as the example of HEC illustrates. Because of the low concentration of HEC, the osmotic effect is assumed to be low, although the viscosity is similar to that of sucrose. The tendencies for higher viscosities to result in slower capillary action and larger diameters to result in faster capillary action are accordingly predicted by eqn (3). Our results also indicate that capillary action in empty capillaries interspersed within a hydrogel follows trends similar to those of the more commonly studied systems, such as capillaries in glass. Unlike the other systems, however, the mechanisms of capillary action considered here are based mainly on water–water interactions, because hydrogels consist predominantly of water (about 98%). The reason why capillary action occurs at all is that the water in the hydrogel has a tendency to minimize its surface energy, γSL < γSG, where γSL is the surface tension at the solid–liquid interface and γSG is the surface tension at the solid–air interface. By filling the capillary with water, the surface area exposed to air is minimized and so is the surface energy.| Medium | η [mPa s] | γ [mN m−1] | θ | D [μm] | Density [kg m−3] |
|---|---|---|---|---|---|
| Alginate gel | — | — | 15° | 180, 250, 410, 630 | — |
| Agarose gel | — | — | 15° | 250 | — |
| Water | 1.0 | 72.8 | — | — | 1000 |
| Sucrose (21.4%) | 3.4 ± 0.2 | 73.3 | — | — | 1084 |
| HEC (0.1%) | 4.8 ± 0.5 | 65.6 | — | — | 1000 |
3.2 Absolute values do not indicate LW behaviour
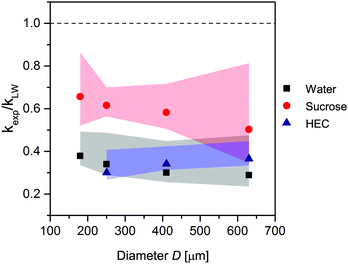
The previous section describes the similarities between our experimental results and the LW predictions. If we insert the absolute values from our experiments into eqn (3), we obtain values deviating from the LW predictions. To quantify this deviation, we calculated the ratio of the experimental to the predicted slopes, kexp/kLW. The result is the relative difference between the experimental and predicted results, or how much slower our results are compared with LW predictions, which are plotted over the capillary diameters in Fig. 3. The closer the points in the graph to the LW results (the dashed line at kexp/kLW = 1), the more similar the experimental results to the predictions. The parameters used in eqn (3) are listed in Table 1.The experiments with water and HEC conducted in alginate resulted in large discrepancies between the predicted and experimental results. The speed of liquid, v, and with it also the slope, k, were only 0.3–0.4 times as high as predicted, though they were 0.6 times as high for the sucrose solution, specifically. Considering the high concentration of the sucrose solution (21.4%), we would expect an osmotic effect in which water from the gel flowed into the highly concentrated sucrose solution. The sucrose solution would become diluted, which in turn would reduce the viscosity with increasing x of the solution in the channel. Inserting a lower viscosity into eqn (3) would result in a higher kLW, and as kexp is determined directly from the experiment, it does not change. The outcome would be a larger discrepancy between predicted and experimental values even for sucrose. The results for sucrose will be discussed further in Section 3.5.
Table 2 presents the slopes for all tested capillary diameters and hydrogels with water as the wetting liquid. The results are derived by calculating the mean of the individual slopes for each tested capillary diameter. The standard deviation and number of replicates, n, are given in parentheses. We fitted the lines from 50% of t to ensure a linear relationship and exclude inertial effects. In a capillary of diameter 180 μm, the slope, k, in alginate was 1.2 × 10⁻³ compared with the LW prediction of 3.5 × 10⁻³ m2 s−1. In the tested capillary of the largest diameter, i.e. 630 μm, the difference was even greater, with an experimentally measured slope of 3.4 × 10⁻³ in alginate versus a predicted slope of 11.1 × 10⁻³. To rule out the possibility that this effect was related to something specific to the calcium alginate gel, we also investigated capillary action in agarose gels. Agarose gels containing a capillary of diameter 250 μm were prepared as described in Section 2, “Experimental”. As in alginate, in agarose with water as the wetting liquid, the experimental value of k was considerably lower than that predicted by the LW equation. If, on the other hand, the experimental value of k is used in eqn (3) and the contact angle is calculated, the result is a contact angle of 74° for water in 630 μm capillaries, decreasing as the capillary diameter decreases; for example, in 180 μm capillaries, the contact angle is 66°. HEC results in the highest value, 86° for all tested diameters. These values are rather high, and the experimentally measured dynamic contact angles will be discussed below.
| Diameter [μm] | 180 | 250 | 410 | 630 |
|---|---|---|---|---|
| a The mean values in m2 s−1 × 10⁻³ with the standard deviation and number of samples indicated in parentheses. | ||||
| Alginate exp. | 1.2 (±0.1;5) | 1.5 (±0.2;9) | 2.2 (±0.3;9) | 3.4 (±0.6;11) |
| Agarose exp. | — | 2.3 (±0.9;11) | — | — |
| Hydrogel LW | 3.5 | 4.4 | 7.2 | 11.1 |
3.3 Possible reasons for the deviation between experimental and LW-predicted values
Agreement between capillary inflow and is commonly reported. Agreement between experimentally obtained values for the slope, k, and the predicted values obtained using the LW equation is, however, rarer. As mentioned above, the absence of inertial forces in the LW equation, i.e.eqn (3), and the use of a static contact angle in the LW equation, while the contact angle in practice changes with speed,22,26–30 are often cited as reasons for the discrepancy between the predicted and experimentally obtained values of k. However, neither the presence of inertial forces nor the use of a static contact angle in the LW equation can explain the deviation between the predicted and experimental values obtained here (Fig. 3).
Inertial flow was described by Bosanquet25 and further developed by Ridgway et al.24 as follows:
 | (7) |
 | (8) |
The dynamic contact angle of water over alginate and agarose gels was measured experimentally on a flat surface of each gel using a Fibro DAT1100 dynamic contact angle analyser (Fibro System AB). After initially decreasing, the contact angle stabilized at approximately 15°. This value should be considered an overestimation due to the inherent difficulty of measuring smaller contact angles (<10°) using the Fibro device, leading to the overestimation of the mean contact angle. We therefore regard the contact angle between water and alginate or agarose gels to be <15°. Since the aspect ratio of liquid volume to gel surface is different in small capillaries, we also measured the dynamic contact angles directly in the capillary during an experiment (see Fig. 4a). Fig. 4a shows a series of three images acquired just over approximately 2 cm from the capillary entrance with water coming from the left-hand side. The speed is plotted against the contact angle in Fig. 4b. The contact angle is largest, approximately 33°, at higher speeds and declines to approximately 10° at rest. An increasing contact angle with speed is in agreement with reported values for wicking in glass tubes.22,26 It should be noted that the contact angle at rest obtained using this method agrees reasonably well with the value of <15° obtained using the Fibro DAT1100 dynamic contact angle analyser (Fibro System AB), given the inherent overestimation of the contact angle.
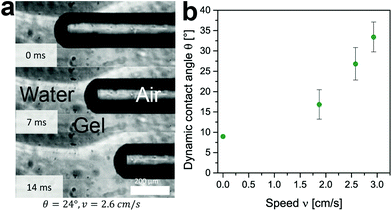 | ||
| Fig. 4 Dynamic contact angles measured directly in the capillary: (a) a series of images of an alginate capillary of 250 μm in diameter; (b) the dynamic contact angle over the speed. | ||
As shown in Fig. 4, the measured contact angles are much lower than the calculated values (see Section 3.2); it therefore follows that the dynamic contact angle does not solely explain the deviation between our experimental results and the LW predictions. The two commonly cited reasons for such discrepancies, i.e. the presence of inertial flow and the use of a static instead of dynamic contact angle, fail to explain the difference observed between predicted and experimentally obtained values in the systems studied here.
To rule out the effect of the difference between the water's chemical potential in the channel and in the hydrogel pore wall on our experimental results, we used water enriched with Ca2+ ions as the wetting liquid at the same concentration as present in the alginate gel. Contrary to what was discussed above for the high-concentration sucrose solution, in the case of pure water as the wetting liquid, we assumed an osmotic flow of water from the flow channel into the gel wall. However, the results indicated no difference in the slope, k, when using calcium-enriched versus pure water. Further, swelling of the gel is not expected on the time-scale used in this study.40
Interstitial flow occurs when a liquid flows over a porous solid medium41 or over hydrogels such as agarose42 and calcium alginate.43 In all cases, the boundary layer of the fluid flow extends into the porous medium, inducing increased movement of the fluid within the gel. It follows that interstitial flow has the effect of causing a non-zero velocity at the boundary of the channel,42 increasing the flow speed and decreasing the friction. Still, as energy is needed to accelerate the interstitial fluid, a lack of energy could slow down the meniscus. To estimate the importance of this effect, we assume that the interstitial fluid is accelerated uniformly with acceleration a for time T over a distance d = aT2/2 until it reaches the speed vI = aT. By assuming a uniform pressure distribution across the channel and gel, and using Darcy's law, it follows that da = vI2/2, where the interstitial velocity can be estimated to be vI ≈ 8κẋ/(ϕr2), where κ is the permeability of the gel and ϕ its porosity. The accelerating force is thus given by
 | (9) |
3.4 Proposal for the existence of a wetting ridge
A deformable substrate undergoes local deformation upon deposition of a water droplet, causing pinning effects,32 and it has been demonstrated that the local deformation of the substrate slows the spreading speed, significantly increasing the spreading time of a droplet.31 To increase the spreading time by more than one order of magnitude, a nanometre-scale vertical displacement of the solid is enough.31 The effect has been modelled by Shanahan and Carré.45 We expect the dynamics on flat surfaces to be similar to those of a moving meniscus in a circular capillary. However, to our knowledge, experimental wicking studies investigating deformation or wetting ridges in soft materials have yet to be conducted.Shanahan and Carré45 gave the following expression for the total braking force due to local deformation:
 | (10) |
 | (11) |
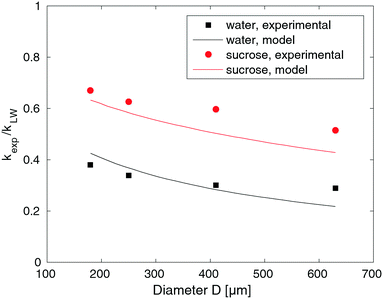 | ||
| Fig. 5 Comparison of the output of model (11) with the experimental slope ratio, kexp/kLW, for water and sucrose solutions. The model was fitted to the water data and used to predict the sucrose data. | ||
Shanahan and Carré also gave an equation for the dynamic contact angle as a function of the wetting front velocity during a spreading drop experiment, when the local deformations were assumed to be the cause of the change in contact angle.45 This equation does not fit our data in Fig. 4b, most likely because the velocities are orders of magnitude larger compared to the data for the spreading drop. This is reasonable considering that an increase in dynamic contact angle with increasing speed is also observed for hard materials like glass and thus that other effects may be responsible for the increase.22,26
We have ruled out numerous reasons for the deviation between k determined in our experiments and k predicted using the LW equation. We therefore hypothesize that the advance of the meniscus will be slower through a capillary in a soft substrate than through a capillary with a hard wall, for example, of glass, due to local deformation, i.e. a wetting ridge, along the moving contact line. The next section describes and discusses an indication for this hypothesis.
3.5 Deformation of the gel upon stress exertion
Small deformation rheology was used to determine the deformation (strain) that each gel exhibits upon exposure to the shear stresses relevant to this study (see Fig. 6). Both gels displayed a linear increase in strain with increasing shear stress, also see the work by Schuster et al.46 for a more detailed mechanical and microscopic characterization of the alginate gels. The alginate gel was more sensitive to shear stress in that it deformed more at a given stress than the agarose gel. At the highest tested shear stress of 12 Pa, for example, the alginate gel displayed a deformation with strain of almost 0.9%, while the agarose gel deformed considerably less at 0.3%. The height of a wetting ridge is related to the elastic modulus of the substrate,47 scaling as h ≈ γ![[thin space (1/6-em)]](https://www.rsc.org/images/entities/char_2009.gif) sin
sin![[thin space (1/6-em)]](https://www.rsc.org/images/entities/char_2009.gif) θ/Y, where Y is the Young's modulus.45 For the alginate gel, this gives an estimated height of the wetting ridge in the order of 1 μm, which is fairly large but still not visible in the images in Fig. 4a. Since the alginate gel was more prone to deformation than the agarose gel at a given shear stress, we assume a more pronounced wetting ridge in the alginate gel during capillary infiltration. This assumption is the object of further investigation.
θ/Y, where Y is the Young's modulus.45 For the alginate gel, this gives an estimated height of the wetting ridge in the order of 1 μm, which is fairly large but still not visible in the images in Fig. 4a. Since the alginate gel was more prone to deformation than the agarose gel at a given shear stress, we assume a more pronounced wetting ridge in the alginate gel during capillary infiltration. This assumption is the object of further investigation.
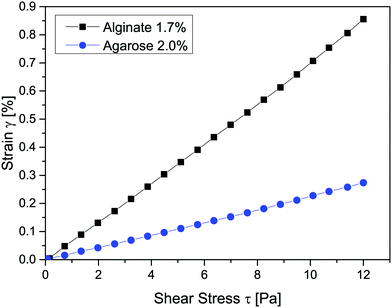 | ||
| Fig. 6 Deformation of agarose and alginate gels at shear stress values experienced by the gels during capillary action, (n = 1). | ||
Based on the greater deformation at a given shear stress in alginate than in agarose gels, we compared the speed of infiltration in the two gels (see Fig. 7). The squared travelled distance, x2, through a capillary of 250 μm diameter is plotted over time. The shaded areas represent the standard deviation. The plot shows, first, that the results are similar for the two hydrogels, independent of whether they consist of agarose or calcium alginate. Generally, as described above, the speed of the meniscus advance in both hydrogels deviates substantially from the absolute values calculated using the LW equation. It can be seen in Fig. 7 that before 0.25 s the infiltration speed is very similar in both gels; after that, it starts deviating with the speed being faster in agarose than in alginate, despite the capillaries being of the same diameter. Eqn (10) demonstrates mathematically that the higher the shear modulus, the lower the viscoelastic braking due to the deformation of the substrate.45 Although further investigation is needed, this strengthens our hypothesis that the observed deviation of k between the experimental and LW-predicted values is due to local deformation of the substrate.
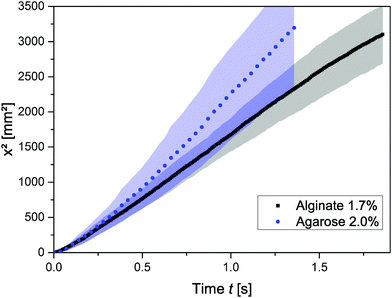 | ||
| Fig. 7 Squared travelled distance, x2, of water in 250 μm-diameter capillaries in agarose and alginate gels; the shaded areas represent the standard deviation (n ≥ 5) for each gel type. | ||
4 Conclusions
We have demonstrated that it is possible to make use of capillary action in hydrogels despite their consisting predominantly of water. In capillaries of 180–630 μm in diameter, we also investigated more viscous wetting liquids, all of which follow the dynamics of the LW relationship x2 ∝ t. Also congruent with LW predictions, smaller capillary diameters and higher wetting liquid viscosities result in slower penetration speeds. The absolute experimentally determined meniscus speed was substantially lower than the absolute predicted speed. We hypothesize that this delay is caused by deformation near the three-phase contact line, i.e. the wetting ridge, of the moving meniscus. The viscoelastic energy dissipation of the substrate slows the penetration speed, leading to the deviation from the LW-predicted behaviour. This study also suggests that capillary action can be used to disperse a concentration of soluble species, metabolites, therapeutics, or anti-fouling agents through a spatial network of micro-channels in a hydrogel consisting predominantly of water.Acknowledgements
This project was performed under the auspices of the VINN Excellence Centre, SuMo Biomaterials, at Chalmers University of Technology. We thank VINNOVA for funding this research via Vinn Excellence Centre grants, and state that the funding agency had no involvement in the study design, in the collection, analysis, and interpretation of data, in the writing of the report, or in the decision to submit the article for publication. The authors thank Dr Gavin Jeffries for providing the setup to measure the dynamic contact angle in capillaries and Karin Glembring for help in collecting experimental data.References
- E. A. Nunamaker, E. K. Purcell and D. R. Kipke, J. Biomed. Mater. Res., Part A, 2007, 83, 1128–1137 CrossRef PubMed.
- W. E. Thomas, D. E. Discher and V. P. Shastri, MRS Bull., 2010, 35, 578–583 CrossRef.
- J. J. Schmidt, J. Jeong and H. Kong, Tissue Eng., Part A, 2011, 17, 2687–2694 CrossRef CAS PubMed.
- O. Chaudhuri, L. Gu, D. Klumpers, M. Darnell, S. A. Bencherif, J. C. Weaver, N. Huebsch, H.-P. Lee, E. Lippens, G. N. Duda and D. J. Mooney, Nat. Mater., 2015, 15, 326–334 CrossRef PubMed.
- F. Duranti, G. Salti, B. Bovani, M. Calandra and M. L. Rosati, Dermatol. Surg., 1998, 24, 1317–1325 CAS.
- B. V. Slaughter, S. S. Khurshid, O. Z. Fisher, A. Khademhosseini and N. A. Peppas, Adv. Mater., 2009, 21, 3307–3329 CrossRef CAS PubMed.
- M. Cabodi, N. W. Choi, J. P. Gleghorn, C. S. D. Lee, L. J. Bonassar and A. D. Stroock, J. Am. Chem. Soc., 2005, 127, 13788–13789 CrossRef CAS PubMed.
- R. K. Garg, R. C. Rennert, D. Duscher, M. Sorkin, R. Kosaraju, L. J. Auerbach, J. Lennon, M. T. Chung, K. Paik, J. Nimpf, J. Rajadas, M. T. Longaker and G. C. Gurtner, Stem Cells Transl. Med., 2014, 3, 1079–1089 CrossRef CAS PubMed.
- N. W. Choi, M. Cabodi, B. Held, J. P. Gleghorn, L. J. Bonassar and A. D. Stroock, Nat. Mater., 2007, 6, 908–915 CrossRef CAS PubMed.
- R. Lucas, Kolloid-Z., 1918, 23, 15–22 CrossRef CAS.
- E. W. Washburn, Phys. Rev., 1921, 17, 273–283 CrossRef.
- P.-G. de Gennes, F. Brochard-Wyart and D. Quéré, Capillarity and wetting phenomena: drops, bubbles, pearls, waves, Springer, New York, 2004 Search PubMed.
- L. R. Fisher and P. D. Lark, J. Colloid Interface Sci., 1979, 69, 486–492 CrossRef CAS.
- G. Callegari, I. Tyomkin, K. G. Kornev, A. V. Neimark and Y.-L. Hsieh, J. Colloid Interface Sci., 2011, 353, 290–293 CrossRef CAS PubMed.
- S. Girardo, S. Palpacelli, A. De Maio, R. Cingolani, S. Succi and D. Pisignano, Langmuir, 2012, 28, 2596–2603 CrossRef CAS PubMed.
- R. R. Rye, F. G. Yost and E. J. O'Toole, Langmuir, 1998, 14, 3937–3943 CrossRef CAS.
- D. Yang, M. Krasowska, C. Priest, M. N. Popescu and J. Ralston, J. Phys. Chem. C, 2011, 115, 18761–18769 CAS.
- A. Han, G. Mondin, N. G. Hegelbach, N. F. de Rooij and U. Staufer, J. Colloid Interface Sci., 2006, 293, 151–157 CrossRef CAS PubMed.
- N. R. Tas, J. Haneveld, H. V. Jansen, M. Elwenspoek and A. van den Berg, Appl. Phys. Lett., 2004, 85, 3274–3276 CrossRef CAS.
- T. Q. Vo, M. Barisik and B. Kim, Phys. Rev. E: Stat., Nonlinear, Soft Matter Phys., 2015, 92, 053009 CrossRef PubMed.
- A. Hamraoui, K. Thuresson, T. Nylander and V. Yaminsky, J. Colloid Interface Sci., 2000, 226, 199–204 CrossRef CAS.
- M. Heshmati and M. Piri, Langmuir, 2014, 30, 14151–14162 CrossRef CAS PubMed.
- M. O'Loughlin, K. Wilk, C. Priest, J. Ralston and M. Popescu, J. Colloid Interface Sci., 2013, 411, 257–264 CrossRef PubMed.
- C. J. Ridgway, P. A. Gane and J. Schoelkopf, J. Colloid Interface Sci., 2002, 252, 373–382 CrossRef CAS PubMed.
- C. Bosanquet, Philosophical Magazine Series 6, 1923, 45, 525–531.
- R. L. Hoffman, J. Colloid Interface Sci., 1975, 50, 228–241 CrossRef CAS.
- A. Siebold, M. Nardin, J. Schultz, A. Walliser and M. Oppliger, Colloids Surf., A, 2000, 161, 81–87 CrossRef CAS.
- M. N. Popescu, J. Ralston and R. Sedev, Langmuir, 2008, 24, 12710–12716 CrossRef CAS PubMed.
- R. G. Cox, J. Fluid Mech., 1986, 168, 169–194 CrossRef CAS.
- T. D. Blake, J. Colloid Interface Sci., 2006, 299, 1–13 CrossRef CAS PubMed.
- A. Carré, J.-C. Gastel and M. E. R. Shanahan, Nature, 1996, 379, 432–434 CrossRef.
- S. Karpitschka, S. Das, M. van Gorcum, H. Perrin, B. Andreotti and J. H. Snoeijer, Nat. Commun., 2015, 6, 7891 CrossRef CAS PubMed.
- J. E. Silva, R. Geryak, D. A. Loney, P. A. Kottke, R. R. Naik, V. V. Tsukruk and A. G. Fedorov, Soft Matter, 2015, 11, 5933–5939 RSC.
- T. Kajiya, P. Brunet, A. Daerr, L. Royon, T. Narita, F. Lequeux and L. Limat, Interfacial Phenom. Heat Transf., 2013, 1, 215–230 CrossRef.
- K. I. Draget, in Handbook of Hydrocolloids, ed. G. O. Phillips and P. A. Williams, Woodhead Publishing, 2nd edn, 2009, pp. 807–828 Search PubMed.
- G. T. Grant, E. R. Morris, D. A. Rees, P. J. C. Smith and D. Thom, FEBS Lett., 1973, 32, 195–198 CrossRef CAS.
- N. F. Stanley, in Food polysaccharides and their applications, CRC/Taylor & Francis, Boca Raton, FL, 2nd edn, 2006, pp. 217–238 Search PubMed.
- M. Rinaudo, Polym. Int., 2008, 57, 397–430 CrossRef CAS.
- A. Ström and M. A. K. Williams, J. Phys. Chem. B, 2003, 107, 10995–10999 CrossRef.
- M. Davidovich-Pinhas and H. Bianco-Peled, Carbohydr. Polym., 2010, 79, 1020–1027 CrossRef CAS.
- J. S. Hou, M. H. Holmes, W. M. Lai and V. C. Mow, J. Biomech. Eng., 1989, 111, 78–87 CrossRef CAS PubMed.
- T. Chen, M. Buckley, I. Cohen, L. Bonassar and H. A. Awad, Biomech. Model. Mechanobiol., 2012, 11, 689–702 CrossRef PubMed.
- E. Schuster, K. Sott, A. Ström, A. Altskär, N. Smisdom, T. Gebäck, N. Lorén and A.-M. Hermansson, Soft Matter, 2016, 12, 3897–3907 RSC.
- D. G. T. Strange, T. L. Fletcher, K. Tonsomboon, H. Brawn, X. Zhao and M. L. Oyen, Appl. Phys. Lett., 2013, 102, 031913 CrossRef.
- M. E. Shanahan and A. Carré, in Nano-surface chemistry, ed. M. Rosoff, Dekker, New York, 2002, pp. 289–313 Search PubMed.
- E. Schuster, J. Eckardt, A.-M. Hermansson, A. Larsson, N. Lorén, A. Altskär and A. Ström, Soft Matter, 2014, 10, 357–366 RSC.
- S. J. Park, B. M. Weon, J. S. Lee, J. Lee, J. Kim and J. H. Je, Nat. Commun., 2014, 5, 4369 CAS.
| This journal is © The Royal Society of Chemistry 2017 |

