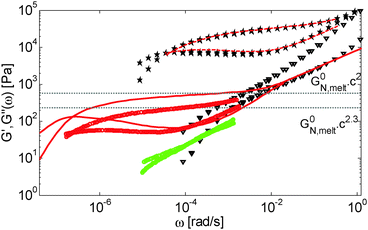
Dynamic dilution exponent in monodisperse entangled polymer solutions
T.
Shahid
ab,
Q.
Huang
c,
F.
Oosterlinck
d,
C.
Clasen
a and
E.
van Ruymbeke
*b
aDepartment of Chemical Engineering, KU Leuven, 3001 Heverlee, Belgium
bBio and Soft Matter, Institute of Condensed Matter and Nano-science (IMCN), Universite Catholique de Louvain, 1348 Louvain-La-Neuve, Belgium. E-mail: evelyne.vanruymbeke@uclouvain.be
cDepartment of Chemical and Biochemical Engineering, The Danish Polymer Centre, 2800 Kgs. Lyngby, Denmark
dMaterial Science Center, DSM Research Geleen, The Netherlands
First published on 15th August 2016
Abstract
We study and model the linear viscoelastic properties of several entangled semi-dilute and concentrated solutions of linear chains of different molar masses and at different concentrations dissolved in their oligomers. We discuss the dilution effect of the oligomers on the entangled long chains. In particular, we investigate the influence of both concentration and molar mass on the value of the effective dynamic dilution exponent determined from the level of the storage plateau at low and intermediate frequencies. We show that the experimental results can be quantitatively explained by considering the tension re-equilibration process along the chains, in agreement with van Ruymbeke et al. (Macromol., 2014), i.e. by considering that the real dilution exponent α is always equal to 1, while larger values of the dilution exponent (1 < α < 1.3) found experimentally are attributed to the enhanced relaxation of the long chain extremities. Then we discuss the influence of the polymer concentration on the terminal relaxation time of the solutions and how this can be modelled by the enhanced contour length fluctuation process (CR-CLF). We point out that this larger dilution effect is not only a function of concentration but also depends on the molar mass of the chains. While the proposed approach successfully explains the viscoelastic properties of a large number of semi-dilute solutions of polymers in their own oligomers, important discrepancies are found for semi-dilute entangled polymers in small-molecule theta or good solvents. Possible explanations for the differences between these sample sets are proposed, based on the comparison of their viscoelastic behavior.
I. Introduction
Today, the linear viscoelastic properties of linear entangled polymer melts are quite well understood and can be predicted on a quantitative level, based on coarse-grained models such as tube-models1–4 or slip-link models.5–8 Besides the melt state, these models can also be used to describe the properties of entangled polymer solutions or of long polymer chains diluted in a matrix of very short chains or oligomers.9–11 However, this requires accounting for constraint release mechanisms in order to describe the influence of the fast motion of shorter and oligomeric chains on the relaxation of the long chains. To this end, most of the present tube models are using the concept of dynamic tube dilution (DTD) proposed by Marrucci et al.,12 according to which the effective diameter of the tube, a, which represents the constraining effect of the surrounding chains on the motion of a specific molecule, increases if the polymer concentration is reduced, as well as if part of the sample is moving fast enough so that they do not constrain the motions of the long chains anymore.1,2 Consequently, the entanglements involving these chains can be ignored and the effective average molar mass between two entanglements, Me, becomes larger:11,12 | (1) |
 | (2) |
 | (3) |
| Gd(t) = (G0N·ϕ(t)α)·ϕ(t) = G0N,meltcα+1ϕ(t)α+1, | (4) |
Constraint release (CR) mechanisms also affect the terminal relaxation time, τrel(M), of the polymer solutions and in particular their reptation time, τrept(M).12 The latter can be compared to the initial reptation time in the melt, τrept,0,melt(M), by accounting for the fact that the corresponding Rouse time of an entanglement segment, τe, is becoming longer (since Me is longer), while the number of entanglement segments along the chain, Z, is decreasing (since Z = M/Me):
 | (5) |
It must be noted that, in addition to the reptation process, a contour length fluctuation process (CLF) must be taken into account in order to determine the terminal relaxation time of the chain. This further speeds up the relaxation of the chains (see Section III).
The objective of this work is to discuss the value of the dynamic dilution exponent α in the case of long linear chains diluted in oligomers or in real solvents. While this parameter should be a priori equal to 1 if we consider that entanglements are binary contacts, several works have shown that, in the specific case of entangled solutions, its effectively observed value is rather equal to 4/3.14–21 This effective value was determined based on experimental data, by looking at the scaling of the level of the plateau modulus in the terminal regime with the concentration c, based on eqn (3), where the plateau modulus can be conveniently approximated as being 3.56 times the value of the loss modulus at its maximum Gmax′′![[thin space (1/6-em)]](https://www.rsc.org/images/entities/char_2009.gif) 18 (or 3.24 in ref. 14) in the case of monodisperse samples. In the following we will refer to an effective α whenever this is obtained from the scaling of Gmax′′ (or Gδ, see below) with concentration.
18 (or 3.24 in ref. 14) in the case of monodisperse samples. In the following we will refer to an effective α whenever this is obtained from the scaling of Gmax′′ (or Gδ, see below) with concentration.
An explanation of the observed effective value of α close to 1.3 (or 4/3) was suggested by Colby and Rubinstein,17 based on the level of the second (low frequency) plateau modulus of the longer chains and its scaling with concentration. They proposed that an entanglement is created only if a fixed number of binary contacts between the chains is reached. Based on this assumption, they estimated the size of the ‘blob’ needed in order to ensure the creation of an effective entanglement at equilibrium, and they could show that such a blob size is proportional to c−2/3. As for the entangled solution, an effective value of α of 4/3 was also found for polymer blends composed of two monodisperse linear polymers15 with very different molar masses. However, in other cases such as for binary blends of linear chains with similar molar masses, or for branched molecules, the effective dynamic dilution exponent was found to be equal to 1.9,22–25 Then again, from the results obtained with slip-link simulations it appears that the (second) plateau modulus scales with concentration as if the dynamic dilution exponent was equal to an effective value of 4/3, despite the fact that its actual value was fixed to 1 in the model itself.7,8 Thus, today, there is no real consensus on what the effective value of α should be and how it is related to the actual value.
Recently, it was proposed by van Ruymbeke and co-workers11 that the actual dilution exponent α should be equal to 1, whatever the composition of the sample is. In order to explain a possible lowering of the plateau modulus value with concentration (that would lead, following eqn (3), to an increase of the effective α to values above 1), for solutions of longer polymer chains in a short polymer matrix the existence of an extra relaxation process was pointed out, originating from a tension re-equilibration along the chain,26 which takes place at the time scale of the release/re-formation of the entanglements between a long and a short chain (i.e. a ‘short–long’ entanglement), and which leads to the loss of some initial ‘long–long’ entanglements at the chain extremities, independently from the reptation/fluctuations of the long chains. This process is usually slow and does not significantly affect the relaxation of the long component, leading to a clearly observable plateau modulus of this component and consequently to an experimentally determined effective α exponent equal to 1. However, in specific cases, for example when the relaxation time of the short component is much shorter than that of the long component, this process can speed up the relaxation of the long chain and consequently the observable second plateau modulus is apparently lowered, leading to a scaling of G0N with concentration as if the effective dilution exponent α was equal to 4/3.
In order to include this mechanism in tube models, a dual approach was proposed, which considers two different pictures related to two different length scales (tube diameters) and time scales:11 according to the first picture the long chains are relaxing in a thin tube of diameter a0,melt. This thin tube is able to move and wriggle (by constraint release mechanisms) in a larger tube of diameter a defined as7,12,27,28
 | (6) |
 | (7) |
In ref. 11, it was shown that for binary blends of linear chains, where the second picture (i.e. long chains moving in a dilated tube with an internal clock defined by eqn (7)) is applicable, the long chains are relaxing faster than expected from the classical tube picture, and the observable part of the second plateau modulus is effectively lowered, resulting in an effective dynamic dilution exponent α larger than 1 when this is obtained from the scaling of the second plateau modulus with concentration following eqn (3). Furthermore, it was shown that in the extreme case of binary blends composed of very short unentangled chains (or oligomers), the ‘second picture’ must be considered, but with the specificity that there is no extra delay in the Rouse time of a long–long entanglement segment. Indeed, in such a case, the limiting relaxation process of a long–long entanglement is its intrinsic Rouse relaxation. Therefore, eqn (7) reduces to
 | (8) |
Thus, by considering that the long chains in binary blends can relax according to two different length (and time) scales, which correspond to two different tube diameters, the experimental data of many binary blends could be correctly described, based on an actual α value of 1.
However, several questions remain that we would like to address in the present work. In particular, we would like to test this approach on a larger set of semi-dilute or concentrated solutions of entangled polymers, diluted either in oligomers or in real solvents, in order to validate our picture. In particular, while it is expected that for such samples the second picture, which considers the long chains moving in a dilated tube, should always be active, it is in our opinion not obvious that the effective α for entangled solutions should always be equal to 4/3 (as proposed in the literature for entangled solutions14–18). The effective α obtained from the scaling of Gmax′′ with concentration should rather depend on the equilibration state of the long chains11 in the terminal regime where the effective plateau modulus (which is approximated by 3.56Gmax′′) is determined. Also, we would like to investigate if an effective α larger than 1 is also obtained when using the value of the storage modulus detected at the higher frequency ωδ, where the tan![[thin space (1/6-em)]](https://www.rsc.org/images/entities/char_2009.gif) δ curve exhibits a minimum, a criterion that is often used to define the plateau modulus. As a last point, we would like to investigate the role of the solvent in the terminal relaxation time of the samples.
δ curve exhibits a minimum, a criterion that is often used to define the plateau modulus. As a last point, we would like to investigate the role of the solvent in the terminal relaxation time of the samples.
In order to address these points, a new set of model polymer solutions based on very long polystyrene linear chains diluted in oligomers at several concentrations has been prepared and measured, and the corresponding linear viscoelastic data are discussed, also in comparison to other sets of samples presented in the literature.10,14,19,30–32 To this end, we use our tube-based model11 to investigate, based on both experimental and theoretical data, how the value of the effective α is affected by the concentration and molar mass of the chains and the nature of the solvent.
The paper is organized as follows. First, in Section II the materials used in this study, as well as the experimental techniques, are presented. Then, in Section III we present the model used for binary blends of linear chains, and reduced to the specific case of entangled polymer solutions. The results are presented and discussed in Section IV, where the experimental and theoretical data for several sets of samples are compared. The comparisons are first made for entangled polymers diluted in oligomers, and subsequently for the case of entangled polymers diluted in small-molecule solvents. Finally, the conclusions are drawn in Section V.
II. Materials and experimental details
II.1. Materials and sample preparation
The samples investigated in this work are monodisperse linear polystyrene chains either diluted in styrene oligomers or in the melt state. Some of these samples have been studied in previous works30–32 and their viscoelastic data have already been presented in the literature. These samples are listed in Table 1, together with their corresponding references. Among them, there are several monodisperse PS samples in the melt state, which will be mainly used to define and validate the material parameters used in our tube model. There is also a set of PS samples diluted in oligomers, which has been presented in ref. 30 by Huang et al., and which has been designed in order to ensure that each of these samples contains a similar number of entanglements.| M w | M n | PDI | Concentration | Ref. | |
|---|---|---|---|---|---|
| OS4 | 3630 | 3424 | 1.06 | — | 30 |
| OS8.8 | 8800 | 8000 | 1.1 | — | — |
| PS50 | 51![[thin space (1/6-em)]](https://www.rsc.org/images/entities/char_2009.gif) 700 700 |
50![[thin space (1/6-em)]](https://www.rsc.org/images/entities/char_2009.gif) 380 380 |
1.026 | 100% | 33 |
| PS100 | 102![[thin space (1/6-em)]](https://www.rsc.org/images/entities/char_2009.gif) 800 800 |
100![[thin space (1/6-em)]](https://www.rsc.org/images/entities/char_2009.gif) 600 600 |
1.022 | 100% | 33 |
| PS200 | 200![[thin space (1/6-em)]](https://www.rsc.org/images/entities/char_2009.gif) 000 000 |
192![[thin space (1/6-em)]](https://www.rsc.org/images/entities/char_2009.gif) 000 000 |
1.04 | 100% | 33 |
| PS285 | 285![[thin space (1/6-em)]](https://www.rsc.org/images/entities/char_2009.gif) 000 000 |
261![[thin space (1/6-em)]](https://www.rsc.org/images/entities/char_2009.gif) 500 500 |
1.09 | 100% | 31 |
| PS390 | 390![[thin space (1/6-em)]](https://www.rsc.org/images/entities/char_2009.gif) 000 000 |
367![[thin space (1/6-em)]](https://www.rsc.org/images/entities/char_2009.gif) 000 000 |
1.06 | 100% | 33 |
| PS545 | 545![[thin space (1/6-em)]](https://www.rsc.org/images/entities/char_2009.gif) 000 000 |
486![[thin space (1/6-em)]](https://www.rsc.org/images/entities/char_2009.gif) 600 600 |
1.12 | 100% | 31 |
| PS545 | 545![[thin space (1/6-em)]](https://www.rsc.org/images/entities/char_2009.gif) 000 000 |
486![[thin space (1/6-em)]](https://www.rsc.org/images/entities/char_2009.gif) 600 600 |
1.12 | 52% in OS4 | 30 |
| PS900 | 910![[thin space (1/6-em)]](https://www.rsc.org/images/entities/char_2009.gif) 000 000 |
784![[thin space (1/6-em)]](https://www.rsc.org/images/entities/char_2009.gif) 500 500 |
1.16 | 33% in OS4 | 30 |
| PS1760 | 1![[thin space (1/6-em)]](https://www.rsc.org/images/entities/char_2009.gif) 880 880![[thin space (1/6-em)]](https://www.rsc.org/images/entities/char_2009.gif) 000 000 |
1![[thin space (1/6-em)]](https://www.rsc.org/images/entities/char_2009.gif) 663 663![[thin space (1/6-em)]](https://www.rsc.org/images/entities/char_2009.gif) 700 700 |
1.13 | 18% in OS4 | 30 |
| PS3200 | 3![[thin space (1/6-em)]](https://www.rsc.org/images/entities/char_2009.gif) 140 140![[thin space (1/6-em)]](https://www.rsc.org/images/entities/char_2009.gif) 000 000 |
2![[thin space (1/6-em)]](https://www.rsc.org/images/entities/char_2009.gif) 275 275![[thin space (1/6-em)]](https://www.rsc.org/images/entities/char_2009.gif) 000 000 |
1.38 | 13% in OS4 | 30 |
| PS3900 | 3![[thin space (1/6-em)]](https://www.rsc.org/images/entities/char_2009.gif) 900 900![[thin space (1/6-em)]](https://www.rsc.org/images/entities/char_2009.gif) 000 000 |
3![[thin space (1/6-em)]](https://www.rsc.org/images/entities/char_2009.gif) 714 714![[thin space (1/6-em)]](https://www.rsc.org/images/entities/char_2009.gif) 300 300 |
1.05 | 10% in diethyl phthalate (DEP) | 34 |
| PS820 | 820![[thin space (1/6-em)]](https://www.rsc.org/images/entities/char_2009.gif) 000 000 |
805![[thin space (1/6-em)]](https://www.rsc.org/images/entities/char_2009.gif) 000 000 |
1.02 | 100%, 80%, 50%, 40%, 24%, 10%, 5%, 3% in OS8.8 | — |
| PS8420 | 8![[thin space (1/6-em)]](https://www.rsc.org/images/entities/char_2009.gif) 420 420![[thin space (1/6-em)]](https://www.rsc.org/images/entities/char_2009.gif) 000 000 |
7![[thin space (1/6-em)]](https://www.rsc.org/images/entities/char_2009.gif) 200 200![[thin space (1/6-em)]](https://www.rsc.org/images/entities/char_2009.gif) 000 000 |
1.17 | 5%, 4%, 3%, 2.5% in chlorinated biphenyl | 19 |
| PBD410 | 411![[thin space (1/6-em)]](https://www.rsc.org/images/entities/char_2009.gif) 500 500 |
410![[thin space (1/6-em)]](https://www.rsc.org/images/entities/char_2009.gif) 800 800 |
1.01 | 100%, 5% in PBD 3 kg mol−1 | 10 |
| PBD925 | 925![[thin space (1/6-em)]](https://www.rsc.org/images/entities/char_2009.gif) 000 000 |
— | <1.1 | 52.3%, 30.6%, 15.7%, 8.06%, 3.08%, 2.14% in dioctyl phthalate (DOP) | 14 |
Besides these first two sets of samples, a new set of entangled solutions has been designed and prepared for the purpose of this study. These new samples consist of a very high molar mass PS polymer (Mw = 820 kg mol−1) diluted in an oligomer (Mw = 8.8 kg mol−1) at different concentrations, ranging from 3 wt% to 100 wt% of the polymer (see Table 1).
Both the polystyrene and oligomer were purchased from Polymer Source (Montreal, Canada). The molar mass of the oligomers has been fixed in order to be short enough to be considered as a solvent, while long enough in order to avoid a too large decrease of their glass transition temperature compared to the high molecular weight sample (see Section II.2). The high molar mass sample was selected to ensure a polydispersity as low as possible. Its molar mass and polydispersity were checked by field flow fractionation (FFF) coupled with multi-angle light scattering (MALS) (performed at BASF, Germany). The results were found to be consistent with the ones received from Polymer Source, and are presented in Table 1.
The solutions were prepared by diluting the high molecular weight polystyrene, PS820, in the oligomeric styrene, OS8.8, at seven different weight fractions, ranging from very concentrated to semi-dilute and dilute regimes.
A 4-step procedure inspired by ref. 30 was used to prepare the solutions. For this we dissolved first the polystyrene and the oligomer according to the desired weight fractions together in THF. The mixture was stirred at room temperature overnight to ensure that the two components were well dissolved and mixed. In a next step, the THF solution was added to the non-solvent methanol drop by drop, using a burette. The precipitated polymer/oligomer blend was then separated and collected using paper filtration. Finally, the blends were dried at 70 °C under vacuum for 4 days to remove the remaining traces of the solvents.
In addition to polymer/oligomer blends, semi-dilute or concentrated solutions of polymers diluted in small-molecule solvents, which are investigated in Section IV.4, are also listed in Table 1 with their corresponding references.
II.2. Linear viscoelastic properties
The linear viscoelastic properties of the polystyrene melt and the solutions were measured by small amplitude oscillatory shear (SAOS) tests. These tests were performed on an AR2000 rheometer using an 8 mm parallel plate geometry and under constant nitrogen supply. Each SAOS test contained three different sub-tests. First, an amplitude sweep test was done to estimate the linear region of each sample. This was done at 1 rad s−1 and up to 10% of the initial amplitude of the sample. Then a time sweep test was done to make sure the sample was well equilibrated with the experimental temperature and all the residual stresses were relaxed. Finally, a frequency sweep test was done to determine the linear viscoelastic data of each sample.For the PS melt, the frequency sweep test was done at four different temperatures ranging from 140 °C to 190 °C, while the solutions were measured at three different temperatures ranging from 130 °C to 170 °C. Subsequently the data for each temperature were shifted per sample onto a single master curve using the time–temperature superposition (TTS) procedure.35
| Solutions | Number of entanglementsa | T g (°C) |
|---|---|---|
| a The number of entanglements are determined based on Me = 15 kg mol−1. | ||
| OS8.8 melt state | — | 94.6 |
| OS8.8 + PS820 (3%) | 2 | 98.1 |
| OS8.8 + PS820 (5%) | 3 | 98.4 |
| OS8.8 + PS820 (10%) | 5 | 98.6 |
| OS8.8 + PS820 (25%) | 14 | 100.4 |
| OS8.8 + PS820 (40%) | 22 | 101.3 |
| OS8.8 + PS820 (50%) | 27 | 102.3 |
| OS8.8 + PS820 (80%) | 44 | 104.6 |
| PS820 melt state | 55 | 106.6 |
In this paper the experimental data of PS820 in the melt state at 130 °C were chosen as the reference point, leading to a difference between the reference and glass transition temperature, Tref. − Tg, of 23.4 °C. The storage and loss moduli of the other solutions measured at 130 °C were then horizontally shifted in order to ensure a good overlap of the viscoelastic response in the high frequency region, in which the chain relaxation is controlled by local Rouse dynamics and will thus depend only on (Tref. − Tg). As discussed below, the validity of the shift factors to this specific reference temperature can then be confirmed by comparing their value to the shift factors vs. temperature curve used to build the different TTS master-curves for the differently concentrated solutions.
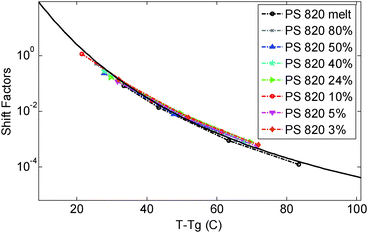 | ||
| Fig. 1 Time temperature superposition shift factors as a function of T − Tg, determined for the different polymer solutions and the melt. The continuous curve represents the WLF equation used in ref. 30. | ||
As it can be seen, when plotted in such a way, the values used for PS solutions and the melt nicely coincide. Also, their T-dependence is very close to the dependence found in ref. 30 for the other PS samples described in Table 1, which is represented in Fig. 1 by the Williams–Landel–Ferry (WLF) equation:35
 | (9) |
The fact that all these curves superimpose also validates the factors used for shifting the data under iso-Tg conditions. Indeed, these shift factors are shown in Fig. 1 at T = 130 °C, i.e. at (T − Tg) ranging from 23.4 °C (for PS820) to 35.4 °C (for OS8.8), and they are in good agreement with the WLF equation.
III. Tube-based model for entangled linear solutions
In this section, the viscoelastic response of the entangled linear solutions is modeled based on the time marching algorithm (TMA) that we have developed, based on the tube theory, for predicting the relaxation modulus of linear and branched entangled polymers.37–39 The main equations are summarized here below for the specific case of long linear chains of mass M2 blended with short chains or oligomers of mass M1. Since this approach should also correctly describe the viscoelastic properties of monodisperse chains (of mass M2) in the melt state, and in order to keep the model as general as possible, the equations are described as a function of the reference material parameters Me,0,melt, G0N,melt, and τe,0,melt of the melt state, and short–long entanglements are considered at very short times even for PS/oligo-S blends.As mentioned in the Introduction, this approach considers the existence of two length and time scales, the first one being related to the motions of the long chains in their thin (initial) tube, while the second one is related to the motions of the long chains in their dilated tube. Since this second relaxation takes place at the rhythm of the motions of the short chains, i.e. τshort–long (see eqn (7)), the necessary time to relax one long–long entanglement segment by tension is usually delayed compared to its intrinsic Rouse time,  . Within this framework, using oligomers as short components represents an extreme case: the relaxation of the long chains in a thin tube (i.e. the first length scale) has a negligible effect since it is always slower than their relaxation in the dilated tube (i.e. the second length scale), this last process being not delayed by the motion of the short chains. Thus, in this specific case, the necessary time to relax one long–long entanglement segment is simply described by its minimum intrinsic value,
  (see eqn (8)),11 and the short–long entanglements do not play any role in the relaxation of the long chains, despite the fact that it is considered that they exist at time t = 0.
Following ref. 11, since the short chains only relax by the Rouse process, the general expression of the relaxation modulus can be described as
| G(t) = (ν1GR,1(t) + ν2GR,2(t)) + Gd(t). | (10) |
 | (11) |
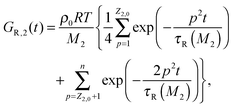 | (12) |
In addition to this Rouse relaxation, the chains must disentangle in order to reach their full relaxation state. This is described by the term Gd(t):
| Gd(t) = G0N,meltφ′(t){ϕ(t)}α, | (13) |
 | (14) |
For such extreme blends, the contour length fluctuation of their initial, undiluted tube (i.e. including the short–long entanglements) can be neglected. Therefore, the survival proportion φ2′(t) of the initial tube segments of the long chains at time t can be described by considering only their relaxation by reptation and their relaxation by the tension equilibration process or constraint release activated fluctuations (CR-CLF):11,37
 | (15) |
 | (16) |
| τrept(M2) = 3τe,0Z2,03να2 | (17) |
IV. Results and discussion
IV.1. Comparison between experimental and theoretical viscoelastic data
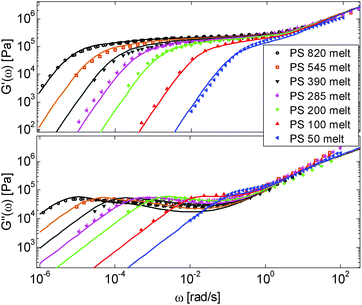
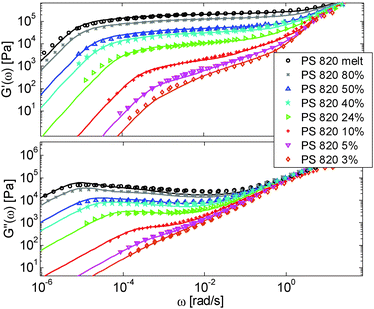
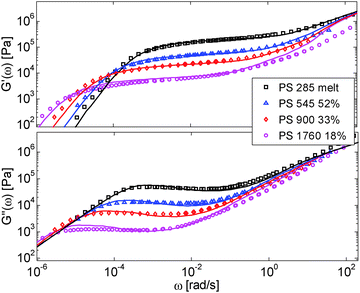
First, the viscoelastic properties of monodisperse entangled PS samples in the melt state (see Table 1) are modelled, based on the approach presented in Section III. This requires defining the values of the three material parameters corresponding to the melt state, G0N,melt, Me,0,melt and τe,0,melt. The values of G0N,melt and Me,0,melt have been set in agreement with previous works37,38,43 as 230 kPa and 15 kg mol−1 respectively, while τe,0,melt has been fixed to 0.55 s at the reference temperature of 130 °C. Comparison between experimental and predicted results is shown in Fig. 2. A good agreement is found, which validates the values taken for these parameters, as well as the experimental data, which come from three different works and two different research groups.The model is then used, without any degree of freedom using only the set melt parameters, to calculate and predict the linear viscoelastic data of the two PS solution series presented in Table 1. The comparisons between predicted and experimental data are shown in Fig. 3 and 4. While the blends presented in Fig. 3 are all based on PS820 and OS8.8, Fig. 4 presents viscoelastic data of solutions based on different molecular weight PS diluted in OS4 at different concentrations, but with a similar number of (long–long) entanglement segments, Z2. It was shown in ref. 30 that the G′, G′′ curves of these different solutions superimpose very well if horizontally and vertically shifted.
One can observe that the approach proposed here allows obtaining very good predictions for different masses and concentrations, spanning the whole range from concentrated and semi-dilute solutions down to only few entanglements per chain. In particular, it should be noted that this good agreement of the different plateau moduli between experiment and calculation is found when the actual dilution exponent α has been fixed to α = 1 in the model.
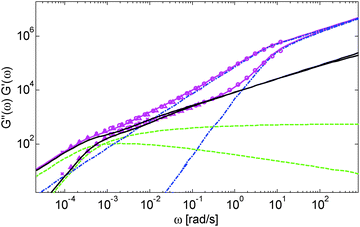
Based on these results, several observations can be made. First, one can observe in Fig. 3 that the shape of the viscoelastic data at intermediate and high frequencies is rather complex. In particular, when the long chains are strongly diluted, we observe the appearance of different slopes in this frequency region. This can be attributed to the fact that these curves include both the relaxation of the short component (with Mw = 8.8 kg mol−1) and the Rouse relaxation of the long chains up to molecular segments of mass Me,0,melt/ν2 (see eqn (14)). This is illustrated in Fig. 5, which presents the predicted storage and loss moduli of sample PS820 diluted at 5 wt% in OS8.8, and shows the specific contributions of the different relaxation processes to the sample relaxation.
As it can be seen, the curves observed in the frequency window between 1 and 20 rad s−1 correspond to a transition state between two Rouse domains with typical slopes of ½: the first (high frequency) process includes the relaxation of both the short and the long chains and corresponds to the fast modes of Rouse, i.e. the Rouse relaxation of polymer strands shorter than M1, while the second Rouse relaxation only involves the longest modes of the long chains and is associated with the relaxation of polymer strands of masses between M1 and Me= Me,0,melt/ν2. The existence of this second frequency domain governed by Rouse relaxation shows the importance of accounting for the constraint release Rouse modes of the long chains, taking place up to the long–long entanglement segments of mass Me, in order to properly capture the relaxation behavior of such blends with a large difference in Mw. Though this might be obvious for the case of polymer solutions, this point becomes more delicate for binary blends of short and long molecules. Indeed, as described in Section III, this Rouse-like relaxation, which allows the long chains to move from a thin tube to a dilated tube, is usually described by the constraint release Rouse process (CRR) through eqn (14).11 However, this requires accurately defining the relaxation state of the chains at the time the CRR becomes active. While it is easy to determine this state in the case of long chains diluted in oligomers (by imposing ϕ(t = τe) = 1), for longer short chains the starting time of CRR and the corresponding relaxation state are not known a priori.
In Fig. 5, one can also observe that the rubbery plateau is quite low and not well defined. This can be understood based on the fact that when diluted to 5 wt%, sample PS820 only contains an average of 2.7 entanglement segments per chain, which is at the limit of the entangled state. In the terminal zone, the chains are therefore moving by CR-CLF in a very dilated tube. In order to observe an actual (rubbery) plateau, the concentration of sample PS820 must be at least 10 wt% (see Fig. 3).
As seen in Fig. 2 for the monodisperse samples, the high frequency data are not accurately captured by the model. This is due to the contribution of the terminal tail of glassy relaxation,44 which is not included in the model. On the other hand, the discrepancy observed in Fig. 4 at high frequency has two different origins: in addition to the contribution of glassy relaxation,44 a large part of the disagreement comes from the fact that our model predicts slower Rouse relaxation of the oligomers when compared to the experimental results. This cannot be corrected by considering another value for the material parameter τe,0,melt (used to define the intrinsic Rouse time of the oligomers) since this would strongly affect the other data. However, since this discrepancy is observed only at very high frequency, it does not influence the curves around the rubbery plateau, i.e. in the frequency area where we would like to discuss the results and the value of the effective dilution exponent.
The good agreement found between experimental and theoretical curves allows us to take advantage of the model for further investigating how the effective (i.e. experimentally determined from the scaling of Gmax′′ or Gδ with c) value of α varies with the sample composition. This is the objective of the next section.
IV.2. Influence of concentration on G0N, Gδ, Gmax′′ and on the effective α
As already mentioned, the plateau modulus of the different blends in Fig. 2–4 is well described by the model in which the actual dilution exponent is fixed to the a priori expected value of α = 1. This good agreement between theoretical and experimental values means that the real plateau modulus of these samples, G0N, must scale with ν22, or equivalently with c2 (see eqn (3)). However, due to the CR-CLF (tension equilibration) process, the observable level of the plateau, measured at lower frequency, is expected to change so that the effective value of α, measured at longer times, is expected to be larger than 1. It is therefore interesting to determine its value for the sets of samples analyzed here, based on approaches usually used in the literature in the case of monodisperse samples. Such approaches are the determination of the effective α by looking at the c-dependence of the maximum loss modulus, Gmax′′, localized in the terminal regime.14,17,18 On the other hand, in order to estimate the influence of the tension equilibration process in the intermediate frequency regime, another approach is to look at the c-dependence of Gδ, defined as the value of the storage modulus at the frequency ωδ where the tan![[thin space (1/6-em)]](https://www.rsc.org/images/entities/char_2009.gif) δ curve (= G′′/G′) shows a minimum.45,46Gδ is usually used to approximate the value of the plateau modulus G0N.
δ curve (= G′′/G′) shows a minimum.45,46Gδ is usually used to approximate the value of the plateau modulus G0N.
Results obtained for the two sets of solutions are shown in Fig. 6. The theoretical Gδ values have also been determined and are represented by the cross symbols in Fig. 6a.
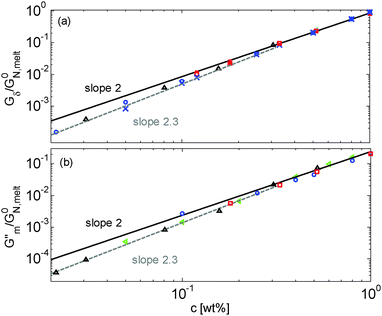 | ||
| Fig. 6 Values of (a) Gδ and (b) Gmax′′ determined from the experimental (□, ○, △, ▷) or the predicted (×) data of the blends. The data correspond to PS/OS blends with similar number of entanglements (red □), the PS820/OS8.8 blends (blue ○), the PBD410/PBD3 blends (green ▷) and the PBD925 diluted in a small-molecule solvent (black △) (see Table 1). Solid and dashed lines represent the slope of 2 and 2.3. The line in (b) is plotted as a factor of 3.56 times lower than in (a). | ||
As a first comment, it must be noted that Gmax′′ cannot be determined for low concentrations of PS in oligomers since there is no clear maximum in the corresponding loss modulus curves, due to the overlap between the constraint release Rouse process and terminal relaxation of the chains (see Fig. 5). Only the plateau of the PBD samples could be measured, since the long chains are much more entangled than the PS long chains. On the other hand, Gδ could be measured only for the samples with experimental data in the intermediate and high frequency regions.
Fig. 6 reveals important features:
– From the comparison between Gmax′′ and Gδ, we can see that the Gmax′′ values are indeed around a factor of 3.56 lower than the values of Gδ.18 Also, we observe that the c-dependence of Gmax′′ and Gδ is very similar and that they both differ from the real plateau modulus G0N (represented by the solid line in Fig. 6a); this discrepancy increases with decreasing polymer concentration. From this result, we conclude that the CR-CLF process can already affect the viscoelastic properties at the intermediate frequency ωδ. Thus, the Gδ, obtained from the tan![[thin space (1/6-em)]](https://www.rsc.org/images/entities/char_2009.gif) δ method, cannot be used to determine G0N for polymer/oligomer blends since it is already influenced by the fast tension equilibration process.
δ method, cannot be used to determine G0N for polymer/oligomer blends since it is already influenced by the fast tension equilibration process.
We also see that the Gmax′′ data are a little more scattered than the Gδ data. This is most probably due to the fact that Gmax′′ is much more sensitive to polydispersity than Gδ.
– At high concentrations (>40 wt%), Gmax′′ and Gδ show c2-dependence, which corresponds to an effective value of α equal to 1. Then, at lower concentration, most of the blends show a transition from c2- to c2.3-dependence of their plateau values. This demonstrates that the value of the effective α determined from either Gmax′′ or Gδ is not a constant and depends on the concentration.
– Looking at the Gδ extracted from both the experimental and the theoretical curves (see Fig. 6a), it is interesting to note that the set of PS/OS4 blends prepared from different molecular weight PS samples in order to keep Z2 constant (set 2, see the red symbols) show c2-dependence also at lower concentrations, while this is not the case for the other blends, made from long chains with a specific, constant molar mass and varying concentrations. In particular, the value of Gδ of PS3200 diluted to 13 wt% is well above the Gδ found for a solution of 13 wt% of PS820. From this observation, one can conclude that the effective α determined from Gδ (at intermediate frequency) is not only a function of concentration, but also seems to depend on the molar mass of the chain.
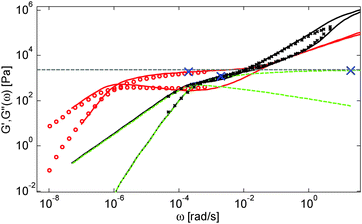
This is further illustrated in Fig. 7, which compares the viscoelastic response of two solutions of PS chains, both at the same concentration of 10 wt%, but with chain molar masses of either 820 kg mol−1 or 3900 kg mol−1:34 despite the fact that they are diluted to the same concentration and thus have the same entanglement density, it is obvious that the value of Gδ is much lower for sample PS820 (which contains 6 long–long entanglements) in comparison to the Gδ value of the PS3900 sample (which contains around 28 long–long entanglements).
From these observations, a global picture can be drawn: while the effective value of α in binary blends of long and short linear chains must be determined from moduli in the frequency range close to the terminal relaxation of the long chains,11 for polymer/oligomer blends a larger effective α can also be determined from moduli at higher frequencies, with no significant difference between the c-dependence of the values of Gmax′′ and Gδ. This is due to the fact that, in the case of polymer/oligomer blends, the tension equilibration process, which is modelled here by the CR-CLF process, is very fast since it does not include any delay due to the motions of the short component (see eqn (7) and (8)), and the long chains can explore their dilated tube as fast as their intrinsic Rouse process allows. Since these fast Rouse motions are already taking place at times shorter than the inverse of the frequency ωδ where Gδ is determined, the effective α at intermediate frequency is found to be larger than 1.
If we consider that a large value of the effective α is related to the tension equilibration process, as suggested in this work, one can easily explain that its value can vary between 1 (no influence of the CR-CLF) and 4/3 (fully equilibrated long chains17), depending on both concentration and molar mass of the long chains. Indeed, from eqn (16) it is expected that the importance of the CR-CLF process increases with decreasing chain length or the concentration, i.e. the effective α increases with a decreasing number of long–long entanglements per chain, Z2.47 This Z2 dependence of the effective α is consistent with the c2-dependence found for Gδ with the second set of PS–OS blends, for which Z2 was kept constant for all concentrations:30,31 in such a case the importance of the CR-CLF process is exactly the same for all the samples since they all have a constant number of entanglements. Thus, they are all characterized by a similar effective α and the slope of the Gδ values continues to scale with c2. In contrast, the dependence of Gδ for the PS820/OS8.8 blends shows a power law which is relatively well defined by a slope of 7/3 at low concentrations: on diluting PS820 in oligomers, the number of (long–long) entanglement segments decreases; this enhances the CR-CLF process, which is already observed at intermediate frequency since it is not delayed by the short chains. As a consequence, the difference between Gδ and G0N increases when PS820 is diluted in oligomers.
Thus, the tension equilibration process allows us to explain the non-constant value of the effective α found experimentally from Gmax′′ and Gδ, as well as its dependence on concentration and molar mass. According to the CR-CLF process, its value should depend on Z2, which is further validated in Section IV.3.
Another consequence of this fast CR-CLF process is that for such blends, Gδ cannot be considered as a good approximation of the plateau modulus G0N, which scales with c2 for all concentrations (as defined in our model). This is illustrated in Fig. 7, which shows the storage modulus corresponding to Gδ for the two blends, and compares this value with the real plateau modulus G0N determined by removing the contribution of the high frequency Rouse relaxation as well as the CR-Rouse modes (see eqn (14)) from the theoretical curves.46,48 It is seen that, due to the overlap between Rouse relaxation and the CR-CLF process, the minimum of the tan![[thin space (1/6-em)]](https://www.rsc.org/images/entities/char_2009.gif) δ curve is found at a rather low frequency ωδ (see the X symbols), at which the sample has already partially relaxed by tension equilibration.
δ curve is found at a rather low frequency ωδ (see the X symbols), at which the sample has already partially relaxed by tension equilibration.
IV.3. Influence of Z2 on the terminal relaxation time, CR-CLF process and effective α
As described in Section IV.2, it seems that the value of the effective α depends on the importance of the CR-CLF process: the more the chains are able to relax by CR-CLF before their terminal relaxation, the larger is the effective α, which is usually determined based on the scaling of Gmax′′ with concentration, but which can also be determined from Gδ in the specific case of polymer/oligomer blends. Thus the transition between an effective α of 1 (negligible effect of CR-CLF) and 4/3 (fully equilibrated chains17) could, in principle, take place at any possible concentration, depending on the entanglement state of the long chains, Z2. In this section, we first try to point out the existence and importance of the CR-CLF process as a function of Z2, based on the experimental terminal relaxation time of the solutions, and then relate this process to the effective α determined from Gδ.As mentioned in the Introduction, the terminal relaxation time of the solutions is expected to be a function of both reptation and CR-CLF processes. Since the real dynamic dilution exponent α is equal to 1, the reptation time of the monodisperse long chains diluted in oligomers (or theta solvent) should therefore scale with concentration (see eqn (17)): τrept,0(M2) = τrept,0,melt(M2)·c. Therefore, by comparing this theoretical reptation time with the experimental terminal relaxation times of these samples, one should be able to extract the importance and scaling of the CR-CLF process. In order to do so, the experimental terminal relaxation time τrel must be determined. This is achieved by superimposing terminal slopes of 1 and 2 on the experimental loss and storage moduli curves in the terminal regime and by defining τrel as the inverse of the frequency at which these two lines cross each other.3
Terminal and reptation times are compared in Fig. 8a as a function of the concentration, and in Fig. 8b as a function of the number of long–long entanglement segments, Z2, which leads to several observations:
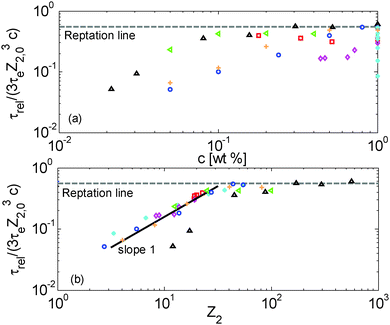 | ||
| Fig. 8 (a) Terminal relaxation time of the long chains normalized by their reptation time in the blend at time 0 (see eqn (5)) versus the polymer concentration, (b) terminal relaxation time of the long chains normalized by their reptation time in the blend at time 0 (see eqn (5)) versus the number of long–long entanglement segments Z2 = Z2,0·c, for the set of samples with a similar number of entanglements (red □), the PS820/OS8.8 blends (blue ○), the PBD410/PBD3 blends (green <), PI308kg/mol/PI2kg/mol blends from ref. 15 (orange +), the PS285kg/mol/OS4kg/mol from ref. 49 (magenta ⋄), the monodisperse PS samples (cyan *) and the PBD925 diluted in a small-molecule solvent (black △) (see Table 1). | ||
First, one can clearly see that reptation alone is not enough to explain the relaxation of the samples: as expected, the contour length fluctuation (CLF) process (for the monodisperse PS samples) and CR-CLF (for the solutions) are needed in order to explain the shorter terminal relaxation times. Also, the ratio between terminal and reptation relaxation time cannot be seen as a simple function of concentration; it is rather a function of the number of long–long entanglement segments along the long chains, Z2 (=Z2,0·c). Indeed, as shown in Fig. 8b, all the data superimpose when plotted in this way and create a master curve, except for the PBD925/DOP solutions, which are discussed in Section IV.4.
In Fig. 8b, a transition is observed around Z2 = 20, from a terminal time dominated by reptation at high Z2, towards much shorter terminal times at low Z2, for which another scaling is observed: the terminal relaxation time of the diluted chains containing less than 20 long–long entanglement segments is found to scale with (Z32,0c)·Z2, i.e. with (c2Z42,0). This scaling is identical to the scaling of the CR-CLF process (see eqn (16)) and therefore validates this relaxation mechanism and demonstrates its importance for moderately entangled linear chains diluted in oligomers. In fact, for such chains the reptation process (taking place in a tube only formed by the long–long entanglements) becomes very slow compared to the CR-CLF process, and its influence becomes negligible.
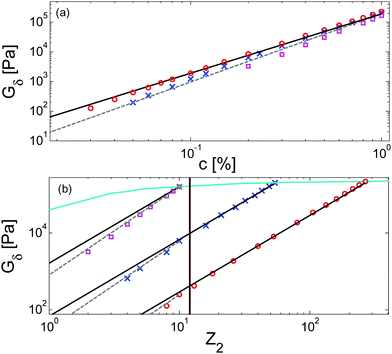
Similarly to the terminal relaxation time, the c-dependence of Gδ data can be rationalized when they are plotted as a function of Z2. This is illustrated in Fig. 9, based on theoretical moduli: the values of Gδ determined from theoretical storage and loss moduli are shown in Fig. 9a for three different molar masses and for a large range of concentrations, while Fig. 9b shows the same data but plotted as a function of Z2.
As it can be seen in Fig. 9a, the c-dependence of Gδ varies with the molar mass of the chains, as it has been observed from the experimental data. Furthermore, it also depends on the range of concentrations considered. However, when plotted as a function of Z2 (see Fig. 9b), one can see that, despite the different levels of Gδ (which comes from the different concentrations (see eqn (3))), all the curves show a transition from an effective α equal to 1 to a larger value at the same number of entanglements, corresponding to around 12 entanglements. While the fact that the effective α tends to 4/3 at low concentration cannot be determined from the equations, this scaling is clearly observed in Fig. 9.
While the CR-CLF process starts to affect the terminal relaxation time around Z2 = 20, it starts to have a large influence on Gδ only at Z2 = 12. This difference in the transition can be understood from the fact that Gδ is less sensitive to Z2 than the CR-CLF process (see eqn (16)). These results suggest that, in order to experimentally determine an effective α equal to 1 from Gmax′′ or Gδ, the diluted chains should at least conserve 12 (long–long) entanglements. This is in good agreement with the experimental results shown in Fig. 6 (apart from the PBD925/DOP solution – see Section IV.4) as well as with other results found in the literature. For example, in ref. 15 and 16, Watanabe et al. found an effective α of 1.3 for polyisoprene chains of mass of 308 kg mol−1 diluted in oligomers. Indeed, when diluted at 10 wt%, these long chains only contain around 8 long–long entanglements and therefore are already largely influenced by the CR-CLF process. This is also consistent with the results found by Wang et al.,10 who showed that the c-dependence of Gmax′′ for long polybutadiene chains of 410 kg mol−1 diluted in oligomers at concentrations larger than 5%, i.e. with Z2 > 12, leads to an effective α of 1 (see Fig. 7 in ref. 10), as well as with the results of Tao et al. in ref. 50, who showed that solutions of linear hydrogenated polybutadiene chains with a molar mass of 200, 350 and 440 kg mol−1 and concentrated above 20 wt% of polymer chains (i.e. with at least 24 entanglements) are well described with an effective α of 1. Another interesting example has been recently proposed by Park et al., who studied the dilution effect of ultra-high Mw polyethylene (Mw > 106 g mol−1) diluted in paraffinic oil.51 The molar mass of such sample is so high that even at the lowest investigated concentration of 2.5 wt%, the sample shows a clear rubbery plateau. In this work also, it was found that the viscoelastic data of this sample in solutions correspond to an effective α of 1.
In this part, it has been shown that the chains containing less than 20 long–long entanglements mainly relax by the CR-CLF process, and their terminal relaxation time, which is well predicted based on α = 1, scales with (c2Z2,04). The chain equilibration through the CR-CLF process leads to a partial relaxation of the long chains and thus to a decrease of the corresponding level of the storage modulus. This effect is a function of Z2, and is already detected at intermediate frequency in the case of polymer/oligomer blends. This larger dilution effect of the oligomers leads to larger values of the effective α, especially for blends with Z2 < 12.
IV.4. Solutions in a small-molecule solvent versus polymer/oligomer blends
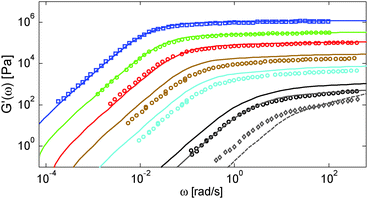
From the examples above, we can conclude that the proposed model leads to a unified picture, which is in good agreement with the experimental data. However, while this picture holds for the different polymer/oligomer blends which have been tested, it does not seem to describe the linear viscoelastic properties of entangled polymers strongly diluted in a small-molecule solvent. This is discussed in this section.We first focus on the set of solutions proposed by Colby et al.,14 from which an α value of 4/3 has been obtained. These are solutions of polybutadiene chains of mass Mw = 925 kg mol−1 dissolved in dioctyl phthalate (considered as a theta solvent). Fig. 10 shows the comparison between their experimental and predicted storage modulus. Parameters used in the tube model are the material parameters usually used with the TMA model for polybutadiene samples (i.e. a plateau modulus of 1.2 MPa, Me = 1650 g mol−1 and τe = 2.3 10−7 s).38 As it can be seen, while the model accurately captures the viscoelastic properties of the higher concentrated solutions (polymer concentration of 100 wt%, 52.3 wt% and 30.6 wt%), it starts to deviate at intermediate concentrations (15.7 wt% and 8.06 wt%), and the deviation becomes very large at very low concentrations (3.08 wt% and 2.14 wt%): it is clear that the level of the predicted plateau modulus is too high compared to the experimental data, despite the fact that the CR-CLF process is taken into account. In fact, as discussed in Section IV.3, this last process becomes really effective only if Z2 < 12, while here, Z2 = 17 and 12 for the solutions at 3.08 wt% and 2.14 wt% respectively (based on α = 1).
Also, as observed in Fig. 10, the sample PBD925 diluted at 2.14 wt% shows a viscoelastic behavior close to full relaxation by Rouse (see the dashed curve), as if the long chains were nearly not entangled, which definitely does not correspond to the behavior of a chain containing 12 entanglements. Thus, when highly diluted, these PBD chains seem less entangled than the predicted number of entanglements based on α = 1 and accounting for CR-CLF. In such a case, using a larger value of the real dilution exponent α could, indeed, lead to better agreement.
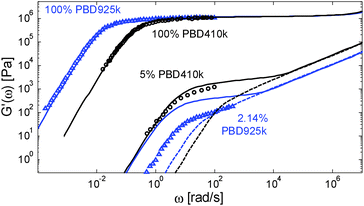
However, considering a larger exponent α would have large consequences for the predictions of the viscoelastic properties of the polymer/oligomer blends, which are well described with α = 1. We thus face a situation in which our tube model cannot correctly predict the linear viscoelastic properties of both the polymer/oligomer blends and these solutions in a small-molecule solvent. This is illustrated in Fig. 11, which compares a PBD solution of ref. 14, composed of 2.14 wt% of sample PBD925 in DOP, to the polymer/oligomer blend composed of 5 wt% of PBD410 in PBD3:10 although of different composition, these two samples have a similar number of entanglements (Z2 = 12 and 12.4 respectively) if we consider α = 1 (by considering α = 1.3, Z2 = 3.8 and 5 respectively).
From this figure it is clear that the two solutions have a very different viscoelastic behavior: in contrast to the viscoelastic response of the PBD925k sample diluted in DOP, the response of the PBD410k sample diluted in oligomers strongly differs from a Rouse-like response and is well described by our model with a real α exponent of 1. Furthermore, the level of its plateau could not be captured by considering an α value of 1.3. Indeed, in such a case, the storage plateau would have been 2.5 times lower than the present plateau, which does not correspond to the experimental data.
One can also observe that the two solutions have similar terminal relaxation times, which is somehow surprising since the reptation time of the diluted PBD925k should be higher by a factor of 4.9 (based on α = 1) or at least by a factor of 3.8 (based on α = 1.3) than the reptation time of the PBD410k/PBD3k blend. This is also seen in Fig. 8b: at low Z2, the terminal relaxation times of the solutions in small-molecule solvents are much shorter than the relaxation times of all polymer/oligomer blends, as if the long chains were less entangled.
Other examples of PS solutions in small-molecule solvents can be found in the literature. In particular, in ref. 34, Bhattacharjee et al. studied the rheology of PS chains of mass Mw = 3900 kg mol−1 dissolved in diethyl phthalate (DEP), dibutyl phthalate (DBP) or dioctyl phthalate (DOP). However, due to the use of different solvents with different qualities (from good for DEP and DBP, to theta for DOP), it is difficult to determine the origin of the observed discrepancy for this last set of solutions. Another systematic set of data has been presented by Osaki et al.,19 who studied very long PS chains (with Mw = 2890, 4480 and 8420 kg mol−1) dissolved in a good solvent (chlorinated biphenyl). Similarly to the results found with the PBD solutions, these curves cannot be modelled based on the approach used for the polymer/oligomer blends. This is illustrated in Fig. 12, which compares experimental and predicted curves for the PS solution containing 5 wt% of PS8420: since Z2 is equal to 28 (with α = 1), the predicted dilution effect is very small and at intermediate frequency, the storage modulus is close to its rubbery plateau, which has been determined based on α = 1. In contrast, we observe that the experimental plateau corresponds rather to an α value close to 1.3, which is the scaling found by Osaki et al., after having removed the high frequency Rouse contribution from the experimental data in order to determine G0N.
On the other hand, the shape of the moduli is similar to the ones found for the blend composed of 40% of PS820 in OS8.8 (see the dashed curves compared to the star symbols), i.e. corresponds to long chains with 22 entanglements. For PS8420 diluted at 5 wt%, a value of Z2 equal to 22 corresponds to an α value close to 1.08 (since 8420k/(Me,0,melt/0.051.08) = 22). Thus, for this sample, it seems that the scaling in terms of plateau modulus and relaxation time is different.
The reason why the diluted PBD925k behaves differently compared to the polymer/oligomer blends is not clear and should be further investigated. While it could come from the fact that the solvent used is a small-molecule solvent, which possibly affects the ability of the chains to create entanglements, it could also be due to a difference in the cooperativity between the long chains and the oligomers or the small-molecule solvent: the high-M chains in the small-molecule solvent determine their entanglement mesh size according to the solubility of the solvent, without any time needed to reach their equilibrium state. Thus, the high-M chains in those solutions obey the Colby–Rubinstein argument and their plateau modulus is proportional to c2.3 in semi-dilute solutions. In contrast, in the high-M/oligomer blends, there is a very strong cooperativity between the oligomers and high-M chains, at least up to the length scale of the oligomer chains, since the motion of the Rouse segments of the high-M chain occurs together with the motion of the oligomers. Consequently, this strong cooperativity leads to a slower equilibration, which is well described by the CR-CLF process.
In order to validate this proposition, one should compare these data to the viscoelastic behavior of very long chains (similar to PS8420k) blended, in a few percent, with short chains or oligomers and check if their effective α continues to be equal to 1 until Z2 = 12 (as the theoretical values shown for PS4000 in Fig. 9a).
V. Conclusions
We have studied and modelled the viscoelastic properties of several polymer/oligomer blends, with various molar masses and concentrations of long chains, in order to discuss the dilution effect from the oligomers on the entanglement state of the long chains. In particular, we have shown that, at low concentration, the effective dynamic dilution exponent determined from the scaling of the level of the storage modulus corresponding to Gδ or Gmax′′ with concentration is larger than the real or actual dilution exponent α, which is fixed to 1. This is due to the fast contribution of the CR-CLF process, which can take place without any delay coming from the oligomers. Consequently, in case that the number of (long–long) entanglements of the long chain falls below 12 (by lowering either the molecular weight or the solution concentration), Gδ is found to scale with c2.3 and cannot be used as a measure of the plateau modulus.These results are in good agreement with ref. 11, where a larger value of the effective α in binary blends of linear chains was attributed to the partial re-orientation of the long–long entanglement segments, taking place through the tension re-equilibrium process along the chains. A similar picture is used here to analyze the viscoelastic properties of the polymer/oligomer blends, by considering that the relaxation time of a long–long entanglement segment is well described by its intrinsic Rouse time, with no extra delay due to the motion of the short chains.
While this approach could successfully explain the viscoelastic properties of a large number of polymer/oligomer blends, an important discrepancy was found for semi-dilute solutions of entangled polymers in theta or good solvents: their plateau moduli scaled with c2.3 rather than with c2. It has been shown that this behavior was not comparable to the viscoelastic behavior of the polymer/oligomer blends and that we could not describe the moduli of both types of samples with a single tube model. The possible origin of this difference has been proposed, based on the difference in cooperativity between the long chains and the oligomers or the small-molecule solvent.
In perspective, one should study the viscoelastic properties of very long chains (i.e. still entangled when diluted at a few percent) blended with short chains or oligomers, in order to validate our proposition. This question needs, indeed, to be solved if we want to compare the extensional behavior of these different blends and solutions.
Acknowledgements
The authors thank Prof. Hiroshi Watanabe for very helpful discussions and suggestions, Dr Meik Ranft (BASF Ludwigshafen, Germany) for the determination of molecular weight distribution of the PS820 sample, and the People Programme (Marie Curie Actions) of the European Union's Seventh Framework Programme (REA grant agreement no. 607937). This work was funded by DSM Ahead (for T. S.), the Aage and Johanne Louis-Hansen foundation (for Q. H.) and the F. N. R. S. (for E. V. R. as chercheur qualifié).References
- J. M. Dealy and R. G. Larson, Structure and rheology of molten polymers, Hanser Publishers, Munich, 2006 Search PubMed.
- H. Watanabe, Prog. Polym. Sci., 1999, 24, 1253 CrossRef CAS; T. C. B. McLeish, Adv. Phys., 2002, 51, 1379 CrossRef.
- E. van Ruymbeke, C. Y. Liu and C. Bailly, Quantitative tube model predictions for the linear viscoelasticity of linear polymers, Rheol. Rev., 2007, 53–134 CAS.
- A. E. Likhtman and T. C. B. McLeish, Macromolecules, 2002, 35, 6332 CrossRef CAS.
- R. N. Khaliullin and J. D. Schieber, Macromolecules, 2010, 43, 6202 CrossRef CAS.
- Y. Masubuchi, H. Watanabe, G. Ianniruberto, F. Greco and G. Marrucci, Macromolecules, 2008, 41, 8275 CrossRef CAS; Y. Masubuchi, J. I. Takimoto, K. Koyama, G. Ianniruberto, G. Marrucci and F. J. Greco, Chem. Phys., 2001, 115, 4387 Search PubMed; Y. Masubuchi, G. Ianniruberto, F. Greco and G. Marrucci, J. Chem. Phys., 2003, 119, 6925 CrossRef.
- S. Shanbhag and R. G. Larson, Macromolecules, 2004, 37, 8160 CrossRef CAS.
- M. E. Shivokhin, E. van Ruymbeke, C. Bailly, D. Kouloumasis, N. Hadjichristidis and A. E. Likhtman, Macromolecules, 2014, 47, 2451 CrossRef CAS; A. E. Likhtman, S. K. Sukumaran and J. Ramirez, Macromolecules, 2007, 40, 6748 CrossRef.
- S. J. Park and R. G. Larson, Macromolecules, 2004, 37, 597 CrossRef CAS; S. J. Park and R. G. Larson, J. Rheol., 2006, 50, 21 CrossRef.
- S. Wang, S. Q. Wang, A. Halasa and W. L. Hsu, Macromolecules, 2003, 36, 5355 CrossRef CAS.
- E. van Ruymbeke, V. Shchetnikava, Y. Matsumiya and H. Watanabe, Macromolecules, 2014, 47, 7653 CrossRef CAS; E. van Ruymbeke, Y. Masubuchi and H. Watanabe, Macromolecules, 2012, 45, 2085 CrossRef.
- G. Marrucci, J. Polym. Sci., Polym. Phys. Ed., 1985, 23, 159 CrossRef CAS; R. C. Ball and T. C. B. McLeish, Macromolecules, 1989, 22, 1911 CrossRef.
- M. Doi and S. F. Edwards, The Theory of Polymer Dynamics, Oxford, 1986 Search PubMed.
- R. Colby, L. Fetters, W. G. Funk and W. W. Graessley, Macromolecules, 1991, 24, 3873 CrossRef CAS.
- H. Watanabe, S. Ishida, Y. Matsumiya and T. Inoue, Macromolecules, 2004, 37, 6619 CrossRef CAS; H. Watanabe, S. Ishida, Y. Matsumiya and T. Inoue, Macromolecules, 2004, 37, 1937 CrossRef.
- T. Sawada, X. Qiao and H. Watanabe, J. Soc. Rheol., Jpn., 2007, 35, 11 CrossRef CAS; Y. Matsumiya, K. Kumazawa, M. Nagao, O. Urakawa and H. Watanabe, Macromolecules, 2013, 46, 6067 CrossRef.
- R. H. Colby and M. Rubinstein, Macromolecules, 1990, 23, 2753 CrossRef CAS; M. Rubinstein and R. H. Colby, Polymer Physics, Oxford University Press, New York, 2003 Search PubMed.
- V. R. Raju, E. V. Menezes, G. Marin and W. W. Graessley, Macromolecules, 1981, 14, 1668 CrossRef CAS.
- K. Osaki, Y. Nishimura and M. Kurata, Macromolecules, 1985, 18, 1153 CrossRef CAS.
- Y. Isono, T. Fujimoto, N. Takeno, H. Kajiura and M. Nagasawa, Macromolecules, 1978, 11, 888 CrossRef CAS.
- J. H. Lee and L. A. Archer, Macromolecules, 2002, 35, 6687 CrossRef CAS; D. Auhl, P. Chambon, T. C. B. McLeish and D. Read, Phys. Rev. Lett., 2009, 103, 136001 CrossRef PubMed.
- C. Das, N. J. Inkson, D. J. Read, M. A. Kelmanson and T. C. B. McLeish, J. Rheol., 2006, 50, 207 CrossRef CAS; D. J. Read, D. Auhl, C. Das, J. den Doelder, M. Kapnistos, I. Vittorias and T. C. B. McLeish, Science, 2011, 333, 1871 CrossRef PubMed.
- Z. W. Wang, X. Chen and R. G. Larson, J. Rheol., 2010, 54, 223 CrossRef CAS.
- M. Kapnistos, D. Vlassopoulos, J. Roovers and L. G. Leal, Macromolecules, 2005, 38, 7852 CrossRef CAS.
- M. Ahmadi, C. Bailly, R. Keunings, N. Nekoomanesh, H. Arabi and E. van Ruymbeke, Macromolecules, 2011, 44, 647 CrossRef CAS.
- H. Watanabe, O. Urakawa and T. Kotaka, Macromolecules, 1994, 27, 3525 CrossRef CAS.
- D. J. Read, K. Jagannathan, S. K. Sukumaran and D. Auhl, J. Rheol., 2012, 56, 823 CrossRef CAS.
- J. L. Viovy, M. Rubinstein and R. H. Colby, Macromolecules, 1991, 24, 3587 CrossRef CAS.
- M. Doi, W. W. Graessley, E. Helfand and D. S. Pearson, Macromolecules, 1987, 20, 1900 CrossRef CAS.
- Q. Huang, L. Hengeller, N. J. Alvarez and O. Hassager, Macromolecules, 2015, 48, 4158 CrossRef CAS.
- Q. Huang, O. Mednova, H. K. Rasmussen, N. J. Alvarez, A. L. Skov, K. Almdal and O. Hassager, Macromolecules, 2013, 46, 5026 CrossRef CAS.
- Q. Huang, N. J. Alvarez, Y. Matsumiya, H. K. Rasmussen, H. Watanabe and O. Hassager, ACS Macro Lett., 2013, 2, 741 CrossRef CAS.
- J. K. Nielsen, H. K. Rasmussen, M. Denberg, K. Almdal and O. Hassager, Macromolecules, 2006, 39, 8844 CrossRef CAS; A. Bach, K. Almdal, H. K. Rasmussen and O. Hassager, Macromolecules, 2003, 36, 5174 CrossRef.
- P. K. Bhattacharjee, J. P. Oberhauser, G. H. McKinley, L. G. Leal and T. Sridhar, Macromolecules, 2002, 35, 10131 CrossRef CAS.
- M. L. Williams, R. F. Landel and J. D. Ferry, J. Am. Chem. Soc., 1955, 77, 3701 CrossRef CAS.
- C. Y. Liu, J. He, R. Keunings and C. Bailly, Macromolecules, 2006, 39, 8867 CrossRef CAS.
- E. van Ruymbeke, J. Nielsen and O. Hassager, J. Rheol., 2010, 54, 1155 CrossRef CAS.
- E. van Ruymbeke, C. Bailly, R. Keunings and D. Vlassopoulos, Macromolecules, 2006, 39, 6248 CrossRef CAS.
- V. Shchetnikava, J. J. M. Slot and E. van Ruymbeke, Macromolecules, 2014, 47, 3350 CrossRef CAS.
- M. J. Struglinski and W. W. Graessley, Macromolecules, 1985, 18, 2630 CrossRef CAS.
- P. E. Rouse, J. Chem. Phys., 1953, 21, 1272 CrossRef CAS.
- S. T. Milner, T. C. B. McLeish, R. N. Young, A. Hakiki and J. M. Johnson, Macromolecules, 1998, 31, 9345 CrossRef CAS.
- E. van Ruymbeke, M. Kapnistos, D. M. Knauss and D. Vlassopoulos, Macromolecules, 2007, 40, 1713 CrossRef.
- T. Inoue, H. Okamoto and K. Osaki, Macromolecules, 1991, 24, 5670 CrossRef CAS; E. van Ruymbeke, E. B. Muliawan, D. Vlassopoulos, H. Gao and K. Matyjaszewski, Eur. Polym. J., 2011, 47, 746 CrossRef.
- C. Liu, J. He, E. van Ruymbeke, R. Keunings and C. Bailly, Polymer, 2006, 47, 4461 CrossRef CAS.
- Y. Matsumiya, N. Rakkapao and H. Watanabe, Macromolecules, 2015, 48, 7889 CrossRef CAS.
- E. van Ruymbeke, R. Keunings and C. Bailly, J. Non-Newtonian Fluid Mech., 2005, 128, 7 CrossRef CAS.
- E. van Ruymbeke, M. Kapnistos, D. Vlassopoulos, C. Y. Liu and C. Bailly, Macromolecules, 2010, 43, 525 CrossRef CAS.
- S. Costanzo, Q. Huang, G. Ianniruberto, G. Marrucci, O. Hassager and D. Vlassopoulos, Macromolecules, 2016, 49, 3925 CrossRef CAS.
- H. Tao, C. Huang and T. P. Lodge, Macromolecules, 1999, 32, 1212 CrossRef CAS.
- J. W. Park, J. Yoon, J. Cha and H. S. Lee, J. Rheol., 2015, 59, 1173 CrossRef CAS.
| This journal is © The Royal Society of Chemistry 2017 |

