
 Open Access Article
 This Open Access Article is licensed under a
 Creative Commons Attribution 3.0 Unported Licence
Using earth abundant materials for the catalytic evolution of hydrogen from electron-coupled proton buffers†
Lewis
MacDonald
 ,
Jessica C.
McGlynn
,
Nicola
Irvine
,
Ihfaf
Alshibane
,
Leanne G.
Bloor
,
Benjamin
Rausch
,
Justin S. J.
Hargreaves
and
Leroy
Cronin
*
,
Jessica C.
McGlynn
,
Nicola
Irvine
,
Ihfaf
Alshibane
,
Leanne G.
Bloor
,
Benjamin
Rausch
,
Justin S. J.
Hargreaves
and
Leroy
Cronin
*
WestCHEM, School of Chemistry, The University of Glasgow, Glasgow G12 8QQ, UK. E-mail: Lee.Cronin@glasgow.ac.uk
First published on 16th August 2017
Abstract
Hydrogen has a large array of uses throughout the chemical and energy industries, yet is largely produced through the reformation of fossil fuels. Renewable production of hydrogen, via electrolytic water splitting, could be key to moving beyond fossil fuel reliance, but research has mainly focused on maximising efficiency to increase the performance of the electrolysis process. Access to cheap, renewable earth abundant materials to produce hydrogen could be argued to be of equal importance. Electron-coupled proton buffers (ECPBs) have been shown to separate the oxygen and hydrogen evolution reactions of water electrolysis (OER and HER) in space and time, but have previously relied on precious metal catalysts to produce H2. Herein, we report the use of four earth abundant catalysts capable of spontaneously evolving hydrogen from reduced ECPBs. The hydrogen production rate was found to be influenced by both the onset potential of the HER for a particular catalyst, and the redox potential of the ECPB used. The catalysts were shown to evolve hydrogen at rates up to 9.4 mmol H2 per h per mg catalyst and up to 60% of the theoretical maximum hydrogen capacity of the ECPBs.
Introduction
Hydrogen is a vital commodity for the chemical industry, as an essential feedstock for the formation of ammonia, and has the potential to be a clean energy carrier replacing fossil fuels for transport.1–5 Currently, hydrogen is produced through the reformation of fossil fuels, thus it relies on a finite resource and cannot be considered a “clean” energy vector.6 An alternative method to produce hydrogen, which has been known for more than two centuries, is water electrolysis.7 Water electrolysis involves the splitting of H2O to constituent gases O2 and H2, thus removing the carbon-containing element of the process. To sustainably produce hydrogen, renewable energy sources (such as solar, wind and tidal) would need to be utilised.8 Recent advances in this field have pushed solar and wind renewables to a point where they can supply a large portion of the country with their energy needs under certain circumstances.9 However, varying circumstances such as weather and geographical location can drastically affect electrical output of these sources.9–11 Therefore, any system that would rely on these sources to produce hydrogen needs to be capable of adapting to a variable energy input. Currently no commercially produced system exists that can take full advantage of renewable energies to produce hydrogen.12An example of current technology used to produce hydrogen is the proton-exchange membrane electrolyser (PEME). The PEME utilises acidic conditions and precious metal catalysts to split water into oxygen and hydrogen simultaneously.13 These processes are separated by a proton exchange membrane to allow the transfer of protons between the water oxidation side of the electrolyser to the hydrogen evolving side.14 Trying to link renewable energies to PEMEs are presently troublesome.12 Gas crossover is a significant drawback of renewable energy powered PEME systems, due to the intermittent and varying power inherent to changing environmental conditions.15,16 This situation leads to a lowering of the obtainable hydrogen yield while potentially creating an explosive gas mixture (explosive limits of 4 to 94 mol% for hydrogen in oxygen).17 The presence of hydrogen, oxygen and catalyst particles in proximity with each other has also been shown to cause degradation of the membrane due to reactive oxygen species forming.16 To overcome these barriers to a renewably powered hydrogen production system, the two gas evolution reactions would need to be separated.
Previously, we reported a way of splitting the hydrogen and oxygen evolving reactions of water electrolysis in both space and time.18 The original electron-coupled proton buffer (ECPB) system utilised a polyoxometalate, phosphomolybdic acid (PMA), which when reduced took up the protons and electrons created by the water oxidation reaction while preventing the hydrogen evolving reaction (HER) from occurring. This reduced PMA species could then be re-oxidised to evolve hydrogen using an additional electrical input. By separating the oxygen and hydrogen evolving reactions in space and time, the issues of gas crossover and degradation of the membrane can be mitigated.16 A further benefit of the ECPB system is that decoupling the HER and oxygen evolving reaction (OER) effectively delimits the rate of hydrogen evolution. PEME hydrogen evolution rates are restricted by the rate of oxygen evolution. By decoupling the two processes, the HER is no longer dependent on the rate of the OER.18
Further work showed that hydrogen could be spontaneously evolved from a similarly reduced compound (silicotungstic acid (STA)) and a catalyst.19 STA was reduced at a potential negative of the normal hydrogen electrode (NHE) by using a carbon electrode. The reduced STA could subsequently evolve hydrogen through contact with a platinum catalyst without any further energy input.19 The previous work reported that a catalyst could spontaneously evolve hydrogen from a reduced polyoxometalate if the redox potential of the polyoxometalate was more negative than the HER onset potential of the catalyst.19 The drawback of this system, and for PEME systems in general, is their use of precious metal catalysts.13 If the ECPB based system were to be adapted for commercial use, the quantity of platinum required would prove to be too expensive and scarce a resource to be economically viable (currently $28.81 g−1).20 For a commercially viable system, an alternative catalyst that is cheaper and more abundant would be needed.
In this work, we investigated alternative hydrogen evolution catalysts that use elements more abundant in the earth's crust than platinum. In particular we investigated two molybdenum compounds (Mo2C and MoS2) and two forms of nickel phosphide (Ni2P and Ni5P4), all of which have been shown to operate as HER electrocatalysts in previous work.21–24 We investigated the performance of these catalysts in four separate ECPB systems, each using a different POM to determine what effects the varying redox characteristics have on the catalytic evolution of hydrogen (Fig. 1).
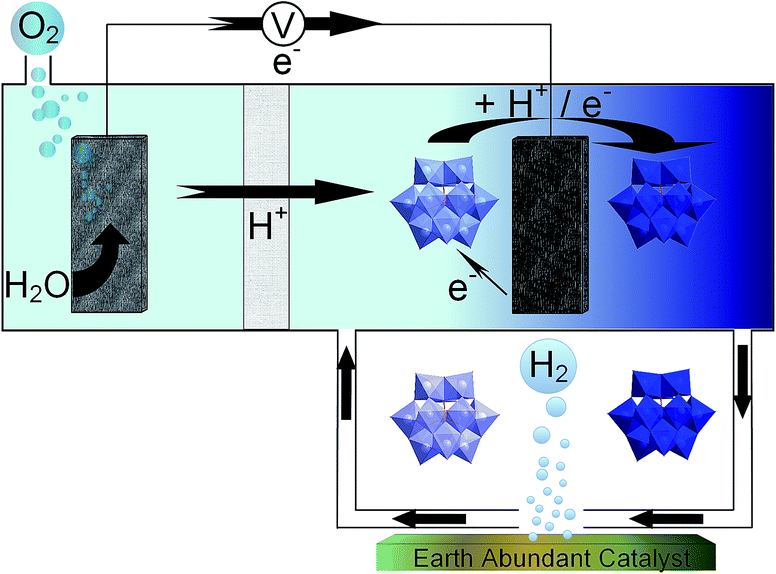 | ||
| Fig. 1 A schematic of a redox mediated H2 evolution system using earth abundant catalysts. Water oxidation occurs, releasing oxygen gas while electrons travel through the circuit and protons travel through the porous membrane. The POM species becomes reduced and protonated, then is transferred over the earth abundant catalyst to release hydrogen gas catalytically. | ||
Results and discussion
The HER onset potential of each catalyst was determined by linear sweep voltammetry, and the redox behaviour of the POMs examined using cyclic voltammetry. The catalysts' HER onset potentials are presented in Table S1 of the ESI.†Fig. 2 shows these onset potentials alongside the cyclic voltammogram of STA overlaid, obtained using a glassy carbon working electrode. Starred is the reduction potential the mediator was reduced to, in this case the second electron reduction peak. Fig. 2 shows that glassy carbon evolves no hydrogen until potentials more negative than the −0.225 V vs. the reversible hydrogen electrode (RHE) of the second STA reduction peak. Therefore, STA can be reduced by two electrons on a carbon electrode without any competing hydrogen evolution reaction occurring. | ||
| Fig. 2 Linear sweep voltammetry of catalysts tested and CV of STA overlaid to show where the redox values are with respect to each catalysts HER onset (* = extent POM was reduced to). | ||
Previously, the onset potential of the HER on the respective catalyst was shown to dictate if hydrogen would spontaneously evolve from the reduced POM.19 Therefore it would imply that selecting POMs with more positive redox potentials should change the volume of hydrogen produced and the possible rate of the hydrogen evolution. Three other POMs were chosen to investigate this; phosphotungstic acid (PTA), phosphomolybdic acid (PMA) and silicomolybdic acid (SMA). Fig. 3 shows PTA with a positive shifted redox peak (E1/2 = −0.036 V and 0.237 V) when compared to STA (E1/2 = −0.195 V and 0.042 V) (Fig. 2). It was expected that PTA would not spontaneously release as large a volume of hydrogen as STA, nor as fast. Fig. S22 and S23† show the redox waves for SMA and PMA respectively, where the star represents where each compound was reduced to (in both cases these correspond to a two electron reduction). Further reduction of the compounds beyond the two electron reduction resulted in a precipitate forming on the electrode. The E1/2 values (0.509 V (SMA) and 0.570 V (PMA)) are more positive than the HER onset potentials of any of the catalysts, and thus should not spontaneously evolve hydrogen.
 | ||
| Fig. 3 Linear sweep voltammetry of catalysts tested plus CV of PTA, overlaid to show where the redox values are with respect to each catalysts HER onset (* = extent POM was reduced to). | ||
A compilation of the oxidation and reduction peaks, along with their equivalent E1/2 values can be found in Table 1.
| POM | Reduction peak 1 (vs. RHE) (V) | Oxidation peak 1 (vs. RHE) (V) | Reduction peak 2 (vs. RHE) (V) | Oxidation peak 2 (vs. RHE) (V) | E 1/2 (peak 1) (V) | E 1/2 (peak 2) (V) |
|---|---|---|---|---|---|---|
| STA | −0.225 | −0.165 | 0.008 | 0.076 | −0.195 | 0.042 |
| PTA | −0.075 | 0.004 | 0.198 | 0.276 | −0.036 | 0.237 |
| SMA | 0.469 | 0.548 | — | — | 0.509* | — |
| PMA | 0.538 | 0.601 | 0.647 | 0.702 | 0.570 | 0.675 |
To evaluate how shifting redox potentials would affect the catalytic hydrogen evolution reaction, the work carried out previously by Rausch et al.19 was repeated but with varying concentrations of STA. This was to determine if concentration affected catalytic hydrogen evolution as the previous work only used 0.5 M. Solutions of STA (0.05 M to 0.5 M) were reduced by two electrons and introduced to 50 mg of Pt/C (1%). The results are displayed in Fig. 4A, along with the rates of hydrogen evolution per mass of catalyst metal used (Pt). A linear trend was observed in the rate of hydrogen evolved with increasing STA concentration, which is to be expected, as there are more protons and electrons available to combine to form hydrogen. The values obtained determined the reaction was first order.
 | ||
| Fig. 4 Rate of hydrogen evolution (A) by catalyst mass, (B) by moles of STA used vs. concentration of STA. | ||
These results show a lower concentration of POM would be viable to use in forthcoming experiments. Fig. 4B shows the same results as Fig. 4A but the rates are calculated based on the concentration of STA as well as the mass of catalyst. The conversion was made to determine the efficiency of hydrogen production and if lower concentrations of STA produce comparable faster rates than higher concentrations of compound. While the experimental results do not yield a linear trend, they do show that lower molar volumes of STA evolve hydrogen at a more efficient rate than higher concentrations. This could be due to mass transport limitations, as converting the data from Fig. 4A to take into account the concentration of STA should result in a horizontal line. However, the lower concentrations show significantly faster rates. Therefore, as the concentration of STA increases, the active sites of the Pt catalyst may be approaching saturation thus decreasing the rate. Taking this into account 0.1 M STA was used for the purposes of this study.
To measure the gas evolution from the reduced POM species, 0.1 M solutions of STA and PTA were reduced by two electrons and exposed to the Pt/C (1%) catalyst, with the volume of gas evolved measured over time (Fig. 5). It was demonstrated that reduced PTA could spontaneously evolve hydrogen gas when introduced to a platinum catalyst, at a rate just below half of STA (1.947 mL s−1 for STA compared to 0.872 mL s−1 for PTA). The slower rate and lower volume observed with PTA (≈30 mL for STA compared with ≈18 mL with PTA after five minutes) was attributed to the position of the E1/2 potentials associated with the POM. PTA has an E1/2 value more positive than STA and hence closer to the HER potential of platinum (see Tables 1 and S1†).
 | ||
| Fig. 5 Hydrogen evolution over 5 minutes from 0.1 M STA and PTA using Pt/C (1% wt). | ||
When the reduced POM (STA or PTA) is introduced to the catalyst, the ΔG value of the system is negative (which can be determined from eqn (1)) as the E1/2 of the POM is more negative than the HER onset potential of the catalyst. Hence ΔE is positive and the reaction is spontaneous.
| ΔG = −nFΔE | (1) |
As the POM becomes oxidised, the potential difference between the (2 − x) reduced POM (x denoting the degree of oxidised POM in the system, between 0 and 2) and the HER of the catalyst becomes smaller.
In other words, the concentration of 2 electron reduced POM is decreasing as hydrogen gas is formed from the POM by the catalyst. As ΔG decreases, the reaction starts to slow down as there is less 2 electron reduced POM to continue the reaction. This explains the emergence of a plateau for H2 produced in Fig. 5. Once ΔG reaches 0, the reaction stops (i.e. the “After 18 hours” time point). A further explanation of the theory is available in the ESI.†
0.1 M solutions of all four POMs were reduced by two electrons and exposed to the earth abundant catalysts. Fig. 6A and B detail the volume of hydrogen produced spontaneously from reduced STA and PTA respectively. All four bulk earth abundant catalysts showed noticeable hydrogen evolution, with detailed values recorded in Table 2. The evolved gas was confirmed as hydrogen by gas chromatography analysis. A similar trend was observed as with the platinum catalyst, where STA showed faster rates and larger volumes of hydrogen compared to PTA. Table 2 details the total volume of hydrogen produced using each catalyst when the system was left for 18 hours and H2 evolution had ceased. The rates of hydrogen produced per mass of catalyst used are also shown. The “% of theoretical H2 obtained” term is the percentage of the hydrogen evolved from the POM in comparison to the theoretical volume that could be evolved (eqn (S1) in the ESI†).
 | ||
| Fig. 6 Hydrogen produced over time from earth abundant catalysts with 0.1 M reduced (A) silicotungstic acid and (B) phosphotungstic acid. | ||
| Catalyst | Silicotungstic acid | Phosphotungstic acid | ||
|---|---|---|---|---|
| % of theoretical H2 obtained (after 18 h) | H2 production rate (mmol h−1 mg−1) | % of theoretical H2 obtained (after 18 h) | H2 production rate (mmol h−1 mg−1) | |
| Ni5P4 (bulk) | 60.2 | 1.198 | 44.6 | 0.205 |
| Mo2C (bulk) | 49.7 | 1.006 | 26.6 | 0.226 |
| MoS2 (bulk) | 42.9 | 0.438 | 18.4 | 0.038 |
| Ni2P (bulk) | 51 | 0.250 | 42.9 | 0.039 |
Ni5P4 and Mo2C evolve hydrogen at a significantly faster rate (1.198 and 1.006 mmol H2 per h per mg respectively for STA, 0.205 and 0.226 mmol H2 per h per mg for PTA) than either MoS2 or Ni2P (0.438 and 0.250 mmol H2 per h per mg respectively for STA, 0.038 and 0.039 mmol H2 per h per mg respectively for PTA). In terms of volume of hydrogen produced, an unusual trend was observed. The nickel containing compounds were seen to oxidise the POMs further (60.2% Ni5P4, 51.0% Ni2P with STA and 44.6% Ni5P4, 42.9% Ni2P with PTA) than the molybdenum containing compounds (42.9% Mo2C, 42.9% MoS2 for STA and 26.6% Mo2C, 18.4% MoS2 for PTA). The other two POMs tested (PMA and SMA) were unable to spontaneously evolve hydrogen, even in the presence of the platinum catalyst. This was expected because of the E1/2 values (0.57 V and 0.509 V respectively) of the two POMs were more positive than the catalysts' HER onset potentials, and so represents an energetically uphill process. Hence, ΔG is positive and the HER is non-spontaneous.
Comparing the four earth abundant catalysts to the Pt/C, a major difference was the physical form in which they took. The Pt catalyst was dispersed on activated carbon, whereas the earth abundant catalysts were all in an unsupported form, hence a lower surface area. Dispersing these catalysts on a support material should help improve the rates by increasing the surface area exposed to the POMs and decreasing the mass of catalyst used. Attempts were made to support Ni5P4 and Mo2C on silica but unfortunately were unsuccessful. Ni2P on silica was synthesised and its stoichiometry was confirmed by ICP, SEM and XRD (Fig. S14 to S21 of the ESI†).
As before, reduced STA and PTA was introduced to the supported catalyst (both 10% wt and 1% wt on silica). The volume and rate of hydrogen produced over time is shown in Fig. 7, with the values obtained for rate and volume summarised in Table 3. When the rates obtained are compared to mass of catalyst used, the supported catalysts have a rate 8× (10% wt) and 37× (1% wt) that of the bulk material with reduced STA. For reduced PTA, the rates are roughly 26× (10% wt) and 23× (1% wt) faster than the bulk material, however the percentage of H2 obtained was significantly lower with the 1% wt catalyst. When compared with the STA data, it appears that the HER using PTA is more susceptible to active site availability. For STA, the supported Ni2P's % H2 obtained is equal to the bulk form's value, yet PTA shows a markedly low value when the % of catalyst present is lowered. This may also explain the low values observed with the Mo2C and MoS2 catalysts with PTA.
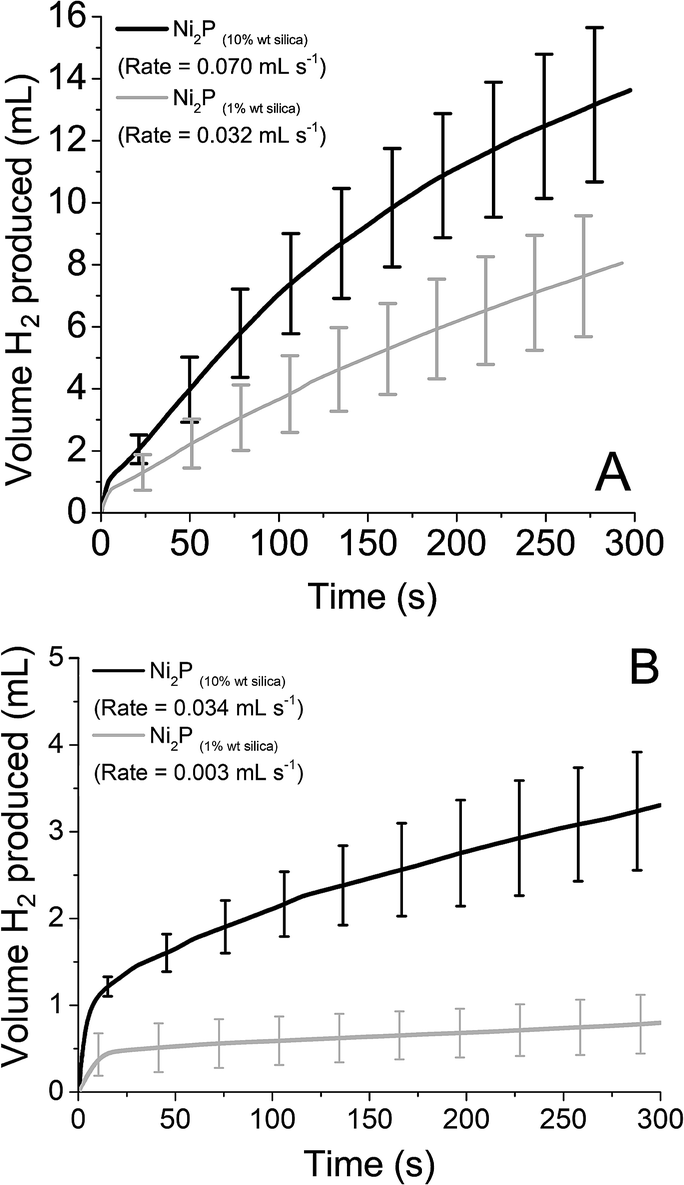 | ||
| Fig. 7 Hydrogen produced over time from Ni2P supported on silica with 0.1 M reduced (A) silicotungstic acid and (B) phosphotungstic acid. | ||
| Catalyst | Silicotungstic acid | Phosphotungstic acid | ||
|---|---|---|---|---|
| % of theoretical H2 obtained (after 18 h) | H2 production rate (mmol h−1 mg−1) | % of theoretical H2 obtained (after 18 h) | H2 production rate (mmol h−1 mg−1) | |
| Ni2P (10% wt) | 51.3 | 2.060 | 34.8 | 1.001 |
| Ni2P (1% wt) | 53.1 | 9.418 | 8.2 | 0.883 |
Conclusions
We have shown that earth abundant catalysts (Ni5P4, Ni2P, Mo2C and MoS2) are capable of spontaneously evolving hydrogen from reduced polyoxometalates. By utilising POMs with various redox potentials, a general trend can be observed. The volume and rate of hydrogen evolved is linked to the redox potential of the POM being used along with the HER onset potential of the catalyst. Furthermore, the redox potentials of the POM must be at least partially more negative than the HER of the catalyst for H2 evolution to occur. This work demonstrates that platinum can be replaced in a hydrogen generation system with a more earth abundant material, which should allow a more economically viable system to be developed for hydrogen production. Progress in this area continues as new catalysts are discovered with lower HER onset potentials which, according to our results, should increase H2 evolution rates.25–27 Polyoxometalates with redox potentials capable of spontaneous hydrogen evolution are also being discovered thus providing a large scope for the discovery of new systems.28,29Conflicts of interest
There are no conflicts to declare.Acknowledgements
The authors would like to thank the EPSRC (grants EP/L023652/1, EP/K023004/1, EP/H024107/1, EP/I033459/1 and EP/J015156/1), the University of Glasgow, and the ERC (project 670467 SMART-POM). The authors would also like to thank the BBSRC, Dr Mark Symes and Prof. Richard Cogdell for their support.Notes and references
- S. Sharma and S. K. Ghoshal, Renewable Sustainable Energy Rev., 2015, 43, 1151–1158 CrossRef CAS.
- V. Kyriakou, I. Garagounis, E. Vasileiou, A. Vourros and M. Stoukides, Catal. Today, 2017, 286, 2–13 CrossRef CAS.
- R. Puskás, T. Varga, A. Grósz, A. Sápi, A. Oszkó, Á. Kukovecz and Z. Kónya, Surf. Sci., 2015, 648, 114–119 CrossRef.
- R. Ramachandran, Int. J. Hydrogen Energy, 1998, 23, 593–598 CrossRef CAS.
- M. Gurz, E. Baltacioglu, Y. Hames and K. Kaya, Int. J. Hydrogen Energy, 2017 DOI:10.1016/j.ijhydene.2017.02.124.
- R. Farrauto, S. Hwang, L. Shore, W. Ruettinger, J. Lampert, T. Giroux, Y. Liu and O. Ilinich, Annu. Rev. Mater. Res., 2003, 33, 1–27 CrossRef CAS.
- R. de Levie, J. Electroanal. Chem., 1999, 476, 92–93 CrossRef CAS.
- F. Barbir, Sol. Energy, 2005, 78, 661–669 CrossRef CAS.
- M. Sharifzadeh, H. Lubiano-Walochik and N. Shah, Renewable Sustainable Energy Rev., 2017, 72, 385–398 CrossRef.
- M. Anvari, G. Lohmann, M. Wächter, P. Milan, E. Lorenz, D. Heinemann, M. R. R. Tabar and J. Peinke, New J. Phys., 2016, 18, 63027 CrossRef.
- S. J. Sangiuliano, Renewable Sustainable Energy Rev., 2017, 80, 971–989 CrossRef.
- G. Gahleitner, Int. J. Hydrogen Energy, 2013, 38, 2039–2061 CrossRef CAS.
- G. Chisholm and L. Cronin, in Storing Energy, Elsevier, 2016, pp. 315–343 Search PubMed.
- A. Goñi-Urtiaga, D. Presvytes and K. Scott, Int. J. Hydrogen Energy, 2012, 37, 3358–3372 CrossRef.
- BP Statistical Review of World Energy, London, 2017 (http://https://www.bp.com/content/dam/bp/en/corporate/pdf/energy-economics/statistical-review-2017/bp-statistical-review-of-world-energy-2017-full-report.pdf) Search PubMed.
- L. Ghassemzadeh, K. D. Kreuer, J. Maier and K. Muller, J. Phys. Chem. C, 2010, 114, 14635–14645 CAS.
- M. Schalenbach, M. Carmo, D. L. Fritz, J. Mergel and D. Stolten, Int. J. Hydrogen Energy, 2013, 38, 14921–14933 CrossRef CAS.
- M. D. Symes and L. Cronin, Nat. Chem., 2013, 5, 403–409 CrossRef CAS PubMed.
- B. Rausch, M. D. Symes, G. Chisholm and L. Cronin, Science, 2014, 345, 1326–1330 CrossRef CAS PubMed.
- Bloomberg Markets, as of 11.52 am, 11/07/2017, retrieved from https://www.bloomberg.com/quote/XPTUSD:CUR.
- Y. Ma, G. Guan, X. Hao, J. Cao and A. Abudula, Renewable Sustainable Energy Rev., 2017, 75, 1101–1129 CrossRef CAS.
- S. Zhang, B. V. R. Chowdari, Z. Wen, J. Jin and J. Yang, ACS Nano, 2015, 9, 12464–12472 CrossRef CAS PubMed.
- E. J. Popczun, J. R. McKone, C. G. Read, A. J. Biacchi, A. M. Wiltrout, N. S. Lewis and R. E. Schaak, J. Am. Chem. Soc., 2013, 135, 9267–9270 CrossRef CAS PubMed.
- A. Laursen, K. R. Patraju, M. J. Whitaker, M. Retuerto, T. Sarkar, N. Yao, K. V. Ramanujachary, M. Greenblatt and G. C. Dismukes, Energy Environ. Sci., 2015, 8, 1027–1034 CAS.
- Z. Wu, J. Wang, J. Zhu, J. Guo, W. Xiao, C. Xuan, W. Lei and D. Wang, Electrochim. Acta, 2017, 232, 254–261 CrossRef CAS.
- J. Zhang, X. Liang, X. Wang and Z. Zhuang, Mater. Lett., 2017, 202, 146–149 CrossRef CAS.
- S. Wan, J. Hu, G.-D. Li, L. Yang, Y. Liu, R. Gao, X. Li and X. Zou, J. Alloys Compd., 2017, 702, 611–618 CrossRef CAS.
- F. M. Santos, P. Brandão, V. Félix, H. I. S. Nogueira and A. M. V. Cavaleiro, Polyhedron, 2015, 101, 109–117 CrossRef CAS.
- C.-Y. Sun, S.-X. Liu, C.-L. Wang, L.-H. Xie, C.-D. Zhang, B. Gao, Z.-M. Su and H.-Q. Jia, J. Mol. Struct., 2006, 785, 170–175 CrossRef CAS.
Footnote |
| † Electronic supplementary information (ESI) available. See DOI: 10.1039/c7se00334j |
| This journal is © The Royal Society of Chemistry 2017 |