Continuous flow photoassisted CO2 methanation†
Josep
Albero
 ,
Esther
Dominguez
,
Avelino
Corma
,
Esther
Dominguez
,
Avelino
Corma
 and
Hermenegildo
García
 *
*
Instituto de Tecnología Química, Universitat Politècnica de València-Consejo superior de Investigaciones Científicas, Avenida de los Naranjos s/n, 46022 Valencia, Spain. E-mail: hgarcia@qim.upv.es
First published on 31st May 2017
Abstract
Photoassisted CO2 methanation using Ni–Al2O3/SiO2 as a photoresponsive catalyst has been carried out at 225 °C under continuous flow conditions achieving up to 3.5% conversion of CO2 with complete selectivity to CH4 under 2327 W m−2 irradiation for a contact time of 1.3 s. An apparent quantum yield of 0.11 was estimated for the continuous flow process.
Photocatalytic CO2 reduction is attracting considerable interest due to the urgent need to drastically reduce greenhouse gas emissions.1,2 In this context, sunlight can be employed to transform CO2 gas into fuels, both in the gas or liquid phase (CH4, CO, HCOOH, etc.).3 Due to the high rates that can be achieved and the overall high efficiency, one of the most promising reactions that have been proposed for industrial scale CO2 transformation is the Sabatier reaction consisting in the catalytic formation of CH4 by reaction of CO2 and H2 (eqn (1)). To achieve low CO2 emission footprint, H2 has to be obtained from H2O using renewable energy. Although the Sabatier methanation is an exothermic reaction, it requires temperatures between 250 and 400 °C depending on the catalyst type to achieve reaction rates adequate for large scale production.4,5 We and others have found that CO2 methanation can be promoted at lower temperatures (about 250 °C or lower) photothermally using Ni-based catalysts6,7 as well as other transition metals (Co, Ru, Zn, Al, etc.) supported in different semiconductors.8,9 This decrease in the reaction temperature and the use of solar light to promote CO2 methanation make the process environmentally more attractive by diminishing the dependency of this reaction on non-renewable energy resources. Thus, it is considered that due to the high conversion and selectivity that can be achieved in the methanation, the photoassisted CO2 reduction can have some potential for the generation of solar fuels. H2 should be available in the required high quantities from H2O by electrolysis using renewable electricity.
| CO2 + 4H2 → CH4 + 2H2O, ΔH = −165 kJ mol−1 | (1) |
There are by now a sufficiently large number of reports on the photoassisted methanation of CO2 in batch mode,8,10–12 where a sealed reactor is charged with the required amounts of CO2 and H2 in contact with the photocatalyst that is irradiated through a transparent window until achieving high CO2 conversions. In contrast, only few reports have studied this reaction in continuous flow operation,13,14 which is much better suited for large scale processes, since it allows high production rates and easier automatization, resulting in optimal intensification of the process.15 Ru based photocatalysts have been employed in continuous flow operation and high rates for CH4 production obtained upon 10 Suns light intensity. This high light irradiation induced Ru nanoparticles to locally increase the photocatalyst temperature (<300 °C) in order to activate H2 and initiate CO2 hydrogenation.13
On the other hand, one of the main characteristics of batch reactions is the accumulation of products which usually results in different selectivities due to the occurrence of consecutive reactions and the generation of secondary products.16 However, continuous flow operation should provide high selectivity toward CH4 production.
The above considerations show the interest in providing data on the continuous flow operation of the photoassisted CO2 methanation and comparison with the batch reaction. Aimed at filling this gap, the present study reports the continuous-flow photoassisted CO2 methanation. The reaction was carried out in a tubular photoreactor, wherein the photoresponsive catalyst was deposited as a fixed bed exposed to irradiation with an optical fibre. In this communication, commercially available Ni–Al2O3/SiO2 previously reported by us as an efficient photoresponsive material has been used, comparing the results obtained with those previously reported for the same material under batch conditions.7,17
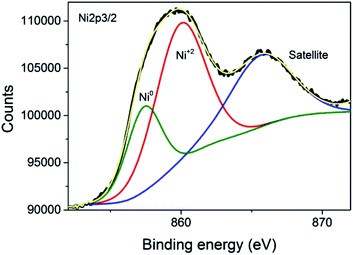
The commercial Ni–Al2O3/SiO2 sample used as the photoresponsive catalyst contains 65% of Ni as determined by inductively coupled plasma-optical emission spectrometry (ICP-OES) analysis. X-ray diffraction (XRD) revealed that the Ni present in the photocatalyst corresponds mainly to metallic Ni, although NiO was also detected in minor amounts (Fig. 1). Initial photocatalytic tests showed that the Ni–Al2O3/SiO2 samples were reduced in a H2 atmosphere at 500 °C for 2 h. However, XRD of the photocatalyst performed immediately after the reduction process showed a similar diffraction pattern to that presented in Fig. 1 (ESI Fig. SI1†). This indicates that the upper layer of the Ni nanoparticles supported on Al2O3/SiO2 undergo fast spontaneous oxidation in contact with ambient atmosphere. The average crystal size of the Ni NPs was estimated to be approximately 6 nm by the Scherrer equation. The average particle size was also calculated by measuring the diameter of a statistically relevant number of Ni nanoparticles from HRTEM images, and it was found to be 6.24 ± 1.17 nm. A representative image showing the Ni nanoparticles is presented in the ESI as Fig. SI2.† These Ni NPs are supported on mixed SiO2–Al2O3 with a Si/Al ratio of 0.23 according to the ICP-OES measurements. The specific surface area, determined by the Brunauer–Emmett–Teller (BET) analysis of isothermal N2 gas adsorption, was found to be 190 m2 g−1. X-ray photoelectron spectroscopy (XPS) was performed on the Ni–Al2O3/SiO2 photocatalysts. The XPS Si 2p and Al 2p spectra were fitted to individual components, obtaining the expected binding energies corresponding to Si and Al atoms in aluminosilicate at 102.15 eV and 74.17 eV, respectively. Moreover, the Si 2p peak at 104.86 eV and Al 2p peak at 76.54 eV were found, and they are attributed to independent SiO2 and Al2O3, respectively. The atomic ratio of Si/Al was estimated to be 0.21, in good agreement with ICP analysis. The experimental core level Ni 2p3/2 spectrum with its best deconvolution is shown in Fig. 2. The Ni 2p3/2 curve fitting shows the presence of Ni0 (857.49 eV) and Ni2+ (860.17 eV) in good agreement with previous reports,18–20 which are present in a proportion of 30% and 70%, respectively. It is worth noting that XPS only probes the outermost surface of the particles, and the contribution of Ni0 and Ni2+ is not representative of the whole sample, where core Ni nanoparticles should be constituted by Ni0 with a NiO shell passivating the nanoparticles.
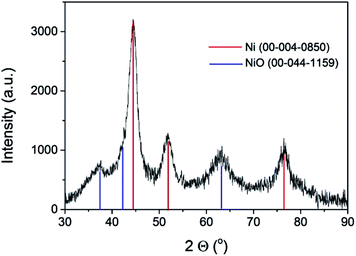 | ||
| Fig. 1 XRD spectra of the Ni–Al2O3/SiO2 catalyst. Red lines correspond to the Ni metal pattern, and blue lines to the NiO pattern. | ||
In a typical reaction 200 mg of the photoresponsive catalyst was compressed at 1 ton × cm−2 for 2 min, and the resulting wafer was crushed and sieved at 0.2–0.4 μm, then loaded on top of a fritted glass filter inside a cylindrical quartz reactor. The photoreactor can be heated at the required temperature through a heating mantle controlled with a thermocouple.
Irradiation was carried out using a UV-Vis 300 W Xe lamp as the light source through an optical guide that irradiates the catalyst bed from the top. A photograph of the system is provided in the ESI (Fig. SI3†), wherein the photocatalyst can be seen illuminated on top of the fritted glass. The gas mixtures containing CO2 and H2 diluted in N2 were introduced from the upper part of the reactor, flowing down through the photocatalyst bed and after leaving the reactor the gas mixture is directly analyzed by an on-line two-column Micro GC instrument allowing us to simultaneously monitor CO2, CO, H2, CH4, CH2–CH2, CH3–CH3 and CH3–CH2–CH3, among others. Quantification was performed by calibrating the response with mixtures of known compositions.
Prior to each experiment, the N2, CO2 and H2 flow and temperature of the reactor were equilibrated. Once the system is stabilized, the initial reaction time corresponds to the instant when the light is switched on.
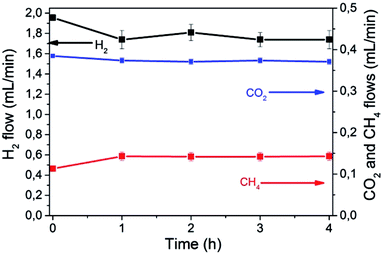
Fig. 3 shows individual CO2, H2 and CH4 flows as function of the irradiation time in a typical reaction, using a total flow of 13.9 mL min−1. No other products besides CH4 were detected. Observation of some thermal CH4 production at 0 time indicates that, at this temperature, under dark conditions CO2 methanation is already occurring to some extent.
A blank experiment in the dark established that at 225 °C, the thermal methanation takes place at a rate of 50 μL × min−1 corresponding to 2 μmol × min−1. Additional control experiments without the photocatalyst at 225 °C in the presence and absence of light irradiation showed that no detectable amounts of CH4 are formed in the absence of the catalyst or in its presence in the dark.
As can be seen in Fig. 3, the rate of CH4 formation increases up to a maximum of 143 μL × min−1, corresponding to 5.9 μmol × min−1 upon illumination. The temporal variation of the effluent composition is related to the period needed to reach the stationary state concentrations in the system once the light is switched on.
This additional formation of CH4 by the action of light was accompanied by the corresponding decrease in CO2 flow rate and the stoichiometric decrease in the H2 content of the effluent according to eqn (1). Under these conditions about 3.5% conversion of CO2 to CH4 was achieved in the photoassisted process for a contact time of 1.3 s.
The Sabatier reaction (eqn (1)) is known to produce H2O as the by-product, which could deactivate the photocatalyst by adsorbing strongly on the active sites. In order to elucidate the effect of H2O adsorption on Ni–Al2O3/SiO2, photocatalytic tests were carried out with moist gases at two different relative humidity levels. In these experiments the reactant gases were flown through a bubbler containing H2O either at 24 or at 50 °C in order to obtain an approximate relative humidity in the gas flow of 20 and 40%, respectively. As can be observed in Fig. SI4 in the ESI†, a 20% relative humidity produced a 32% decrease in the CH4 production with respect to identical experiments with initial dry reactants. Further increase in the relative humidity in the steam (40%) resulted in a 38% lower CH4 evolution. These data indicate that under these reaction conditions (225 °C with a reagent gas flow of 13.9 mL min−1 with a composition of 81.7% N2, 3.1% of CO2 and 15.2% of H2) the presence of H2O is detrimental for the photoassisted CH4 production. It is expected that the influence of H2O adsorption should be lower or higher depending on the reaction temperature that should favor H2O desorption, as well as the continuous flow operation mode that should contribute to the desorption of H2O formed as the by-product from the photocatalyst bed.
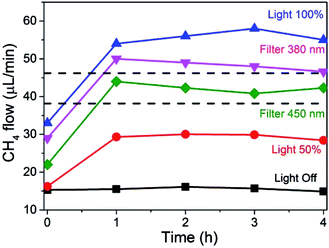
The influence of light intensity and wavelength on the photoassisted methanation of CO2 at a constant temperature of 225 °C is presented in Fig. 4. As can be seen, CO2 methanation already occurs to some extent in the dark at 225 °C resulting in constant formation of 15 μL min−1 of CH4 with time when a total flow of 14.28 mL min−1 was employed (composed of 11.39 mL × min−1 of H2 and 2.85 mL × min−1 of CO2).
At full illumination (light 100% plot in Fig. 4), a fast increase in CH4 production was monitored due to irradiation, reaching a stationary value of 55 μL min−1.
This means that, under these conditions of flow, composition, temperature and light power, light increased CH4 production by a factor of 3.7 times, reaching CO2 conversions close to 2%. Note that this conversion is lower than that reported in the previous experiment in Fig. 3. This is due to the higher reactant concentration employed in this experiment (no N2 dilution) and the higher total gas flux. At half power illumination (Light 50% plot), obtained with a neutral filter with an optical density of 50%, this fast initial rate was observed as well, and a CH4 flux of 30 μL min−1, approximately half the value obtained with full illumination, was measured. This experiment confirms again that light is responsible for the formation of CH4, whose concentration decreases proportionally as the light intensity decreases.
The influence of the irradiation wavelength was addressed by using cut-off filters. Since the intensity of the xenon lamp is approximately constant at all wavelengths in the range between 300 and 800 nm (see Fig. SI5 in the ESI†), cutting a range of wavelengths in the UV region decreases proportionally the intensity of the light transmitted through the filter. Therefore, the cut-off filters not only remove shorter wavelengths, but also decrease the light flux reaching the photoresponsive catalyst (about 84 and 70% for cut-off filters of 380 and 450 nm, respectively). The results of the photoresponse of the Ni–Al2O3/SiO2 catalyst are also presented in Fig. 4. As can be seen, cut-off filters for wavelengths shorter than 380 or 450 nm, removing partially or totally the UV component from the xenon lamp, lead to some decrease in CH4 formation rate in accordance with the expected proportion of light power decreased by the filter (see Fig. 3). Importantly, Fig. 4 clearly shows that notable CH4 production is still observed in the absence of UV light, indicating that the photoresponse of the catalyst has an important contribution of the visible light zone of the spectrum (about 70%). This photoresponse is in agreement with the diffuse-reflectance UV-Vis spectrum of the photocatalyst presented in Fig. SI6† that shows continuous absorption in the whole UV and visible regions, increasing the absorption intensity toward the shorter wavelength zone of the spectrum. Thus, it can be concluded that the photoresponse follows the absorption spectrum of Ni NPs in the Ni–Al2O3/SiO2 catalyst. It is worth noting that in all experiments the reactor temperature is continuously monitored and controlled by a thermocouple coupled to a heating mantle and a controller, avoiding temperature changes upon light intensity variations.
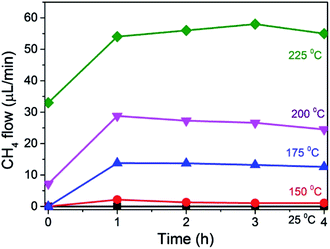
The temperature dependence of this photoassisted continuous flow methanation was studied in the range from ambient to 225 °C. The results are presented in Fig. 5. As indicated above, the temporal increase in the CH4 formation rate reflects the time taken to reach the steady state regime in the photoreactor at the flow of the experiment. As can be observed, negligible amount of CH4 was detected at room temperature either in the dark or under illumination. However, as soon as the temperature was increased from 150 °C up to 225 °C, photoassisted CH4 production was observed. This temperature dependence is not surprising and it has been reported previously for this photoassisted reaction under batch mode.17 Worth noting is that the thermal, dark process of CH4 formation under our experimental conditions starts to be detected above 175 °C. Therefore, in comparison with the production plots shown in Fig. 3 and 4, no thermal CH4 is observed in the dark at 175 °C, while under Xe lamp irradiation a CH4 formation rate of 14 μL × min−1 was measured. From the CH4 formation rates measured at different temperatures, an apparent activation energy of 45.9 kJ × mol−1 was calculated for this reaction, using Ni–Al2O3/SiO2 as the catalyst, which is consistent with activation energies previously reported using other Ni-based catalysts.21
For comparison purposes, CO2 methanation reaction at 150 °C was also performed in batch mode using the same Ni–Al2O3/SiO2 photocatalyst. Note that at this temperature no CH4 is formed in the dark. A CH4 formation rate of 16.67 μmol × min−1 was measured in batch mode using the same amount of catalysts (200 mg). This CH4 formation rate value is similar to that previously reported.17 In the present case, under continuous flow at 150 °C, a CH4 formation rate of 2 μL × min−1 has been measured. If only the contribution of light to the formation of CH4 is considered, an apparent value of quantum efficiency, i.e. moles of CH4 formed divided by moles of photons, from both batch and continuous flow procedures can be estimated. It was determined that the apparent quantum yields of CH4 formation for both the batch and the continuous flow processes were similar, obtaining a value of 0.11 molecules of CH4 per photon.
This similarity indicates that the efficiency of this photoassisted reaction is independent of the operation mode, as it should be for a common reaction mechanism. According to the current proposals, it is suggested that light absorption by Ni NPs must increase their instantaneous local temperature measured at the nanometric scale and this localized photothermal effect results in acceleration of the reaction rate.
On the other hand, it has been reported under batch conditions that besides CH4, low but detectable amounts of CO are formed in the process.17 However, in the present case under continuous flow, the only detectable product was CH4, and CO was below the detection limit (0.2 μL × min−1). Thus, selectivity is enhanced under the flow conditions, probably due to the limited CO2 conversion value.
In conclusion, the present study shows that the efficiency of methanation of CO2 by H2 is sufficiently high to allow performing the process under continuous flow operation, reaching substantial CO2 conversions, even for very short CO2-catalyst contact times. Depending on the reactor temperature, illumination of commercial Ni–Al2O3/SiO2 catalysts in the UV or visible region promotes methanation or increases CH4 formation rate compared to the same process in the dark, up to 3.7 times at 225 °C and conversions about 3.5% can be reached. The system does not undergo apparent deactivation in 4 h reaction time. Comparison between batch and continuous modes illustrates that although the quantum efficiency is almost the same in both operation modes, the overall CH4 production is higher in continuous systems. On the other hand, the selectivity is improved in continuous mode, where the formation of CO is not detected.
Acknowledgements
Financial support by the Spanish Ministry of Economy and Competitiveness (Severo Ochoa and CTQ2015-65169-CO2-R1) is gratefully acknowledged. J. A. thanks the Universitat Politècnica de València for the post-doctoral research associate contract.Notes and references
- A. J. Nozik and J. Miller, Chem. Rev., 2010, 110, 6443–6445 CrossRef CAS PubMed
.
- H. Arakawa, M. Aresta, J. N. Armor, M. A. Barteau, E. J. Beckman, A. T. Bell, J. E. Bercaw, C. Creutz, E. Dinjus, D. A. Dixon, K. Domen, D. L. DuBois, J. Eckert, E. Fujita, D. H. Gibson, W. A. Goddard, D. W. Goodman, J. Keller, G. J. Kubas, H. H. Kung, J. E. Lyons, L. E. Manzer, T. J. Marks, K. Morokuma, K. M. Nicholas, R. Periana, L. Que, J. Rostrup-Nielson, W. M. H. Sachtler, L. D. Schmidt, A. Sen, G. A. Somorjai, P. C. Stair, B. R. Stults and W. Tumas, Chem. Rev., 2001, 101, 953–996 CrossRef CAS PubMed
.
- K. Li, X. An, K. H. Park, M. Khraisheh and J. Tang, Catal. Today, 2014, 224, 3–12 CrossRef CAS
.
- S. Rönsch, J. Schneider, S. Matthischke, M. Schlüter, M. Götz, J. Lefebvre, P. Prabhakaran and S. Bajohr, Fuel, 2016, 166, 276–296 CrossRef
.
- S. K. Hoekman, A. Broch, C. Robbins and R. Purcell, Int. J. Greenhouse Gas Control, 2010, 4, 44–50 CrossRef CAS
.
- P.-W. Pan and Y.-W. Chen, Catal. Commun., 2007, 8, 1546–1549 CrossRef CAS
.
- F. Sastre, A. V. Puga, L. Liu, A. Corma and H. García, J. Am. Chem. Soc., 2014, 136, 6798–6801 CrossRef CAS PubMed
.
- Ş. Neaţu, J. Maciá-Agulló and H. Garcia, Int. J. Mol. Sci., 2014, 15, 5246 CrossRef PubMed
.
- Y. Zhao, G. Chen, T. Bian, C. Zhou, G. I. N. Waterhouse, L.-Z. Wu, C.-H. Tung, L. J. Smith, D. O'Hare and T. Zhang, Adv. Mater., 2015, 27, 7824–7831 CrossRef CAS PubMed
.
- O. K. Varghese, M. Paulose, T. J. LaTempa and C. A. Grimes, Nano Lett., 2009, 9, 731–737 CrossRef CAS PubMed
.
- X. Meng, T. Wang, L. Liu, S. Ouyang, P. Li, H. Hu, T. Kako, H. Iwai, A. Tanaka and J. Ye, Angew. Chem., 2014, 126, 11662–11666 CrossRef
.
- J. Jia, P. G. O'Brien, L. He, Q. Qiao, T. Fei, L. M. Reyes, T. E. Burrow, Y. Dong, K. Liao, M. Varela, S. J. Pennycook, M. Hmadeh, A. S. Helmy, N. P. Kherani, D. D. Perovic and G. A. Ozin, Adv. Sci., 2016, 3, 1600189 CrossRef PubMed
.
- J. Ren, S. Ouyang, H. Xu, X. Meng, T. Wang, D. Wang and J. Ye, Adv. Energy Mater., 2017, 7, 1601657 CrossRef
.
- I. Kocemba, J. Nadajczyk, J. Góralski and M. I. Szynkowska, Pol. J. Chem. Technol., 2010, 12, 1–2 CrossRef
.
- K. Gilmore and P. H. Seeberger, Chem. Rec., 2014, 14, 410–418 CrossRef CAS PubMed
.
- S. Sicardi, G. Baldi, L. van Dierendonck and T. Smeets, Chem. Eng. Sci., 1988, 43, 1843–1848 CrossRef CAS
.
- J. Albero, H. Garcia and A. Corma, Top. Catal., 2016, 59, 787–791 CrossRef CAS
.
- T.-Y. Yung, L.-Y. Huang, T.-Y. Chan, K.-S. Wang, T.-Y. Liu, P.-T. Chen, C.-Y. Chao and L.-K. Liu, Nanoscale Res. Lett., 2014, 9, 444 CrossRef PubMed
.
- S. Kasztelan, J. Grimblot, J. P. Bonnelle, E. Payen, H. Toulhoat and Y. Jacquin, Appl. Catal., 1983, 7, 91–112 CrossRef CAS
.
- A. M. Venezia, R. Bertoncello and G. Deganello, Surf. Interface Anal., 1995, 23, 239–247 CrossRef CAS
.
- Y. Feng, W. Yang and W. Chu, Int. J. Chem. Eng., 2015, 2015, 7 Search PubMed
.
Footnote |
| † Electronic supplementary information (ESI) available. See DOI: 10.1039/c7se00246g |
| This journal is © The Royal Society of Chemistry 2017 |

