Chlorine-induced degradation in SOFCs operating with biogas†
K. W.
Reeping
a,
J. A.
Bohn
a and
R. A.
Walker
 *ab
*ab
aDepartment of Chemistry and Biochemistry, Montana State University, Bozeman, MT 59717, USA. E-mail: rawalker@montana.edu
bMontana Materials Science Program, Montana State University, Bozeman, MT 59717, USA
First published on 5th May 2017
Abstract
Experiments described in this work examine degradation mechanisms of nickel-based anodes in solid oxide fuel cells (SOFCs) operating with a biogas surrogate and exposed to 110 ppm Cl (delivered either as CH3Cl or HCl). Chlorine present in green and synthetic fuels such as biogas and syngas can accelerate degradation of high temperature nickel anodes. Chlorine contamination has been studied in SOFCs where H2 was the primary fuel but little attention has focused on deleterious, cooperative effects that result from Cl-contamination in predominantly carbon containing fuels. Operando Raman spectroscopy is used to directly observe the anode's catalytic activity as evidenced by observable carbon accumulation, and electrochemical impedance and voltammetry measurements report on overall cell performance. Studies performed at 650 °C and 700 °C show that Cl immediately suppresses carbon accumulation and causes slow but steady cell degradation. Prolonged exposure to Cl results in abrupt and irreversible device failure. These results differ markedly from recent reports of Cl contamination in SOFCs operating independently with H2 and CH4.
Introduction
Biogas is a general term that describes CH4/CO2 mixtures formed from anaerobic digestion of organic material. A small carbon footprint and flexible feedstocks make biogas an attractive source of renewable energy. However, raw biogas often is too lean in CH4 to be used in conventional, natural gas powered applications, and contaminants such as H2S and HCl can exceed levels that allow for sustained device operation. Biogas can be upgraded to biomethane using membrane purification or scrubbers,1,2 but these processes place additional demands on gas handling equipment and require additional infrastructure. Consequently, biogas is relatively easy to produce but not as easy to use. In order for biogas to become globally viable as an electricity source, relevant technologies must be able to process, store and utilize biogas efficiently and inexpensively. Direct electrochemical conversion stands out as an appealing strategy for converting biogas directly into electricity with high efficiency and broad versatility.Solid oxide fuel cells (SOFCs) are well suited to electrochemically oxidize biogas from a variety of sources.3,4 Unlike low temperature devices that rely on precious metal catalysts and can operate only with H2, SOFCs use inexpensive electrocatalysts such as nickel5,6 and can convert more energy dense fuels (including CH4) into products (H2O, CO2, and electricity). SOFCs operate with efficiencies as high as 85% in combined heating and power applications.7–9 As an electrolyzer, solid oxide electrolysis cells (SOECs) use excess electricity that would otherwise go to waste from sources such as wind turbines or solar cells, to reduce CO2 to CO and other high value products.10–12 Both applications rely on ion conducting solid oxide electrolytes and require operating temperatures as high as 800 °C. High temperatures improve the kinetics of the oxygen reduction reaction as well as the electrolyte's ionic conductivity, but these conditions also can accelerate processes responsible for material degradation and ultimately, device failure.13
One contaminant known to cause degradation in SOFCs is chlorine.14–16 Chlorine present as HCl or CH3Cl, can be found in concentrations as high as 1 g per m3 of biogas collected at landfill sites and from sources that recycle wastes such as plastic, although chlorine levels in raw biogas show large variations depending on the biogas source.4,7,17,18 In solid oxide devices, halocarbons decompose rapidly and the halogens adsorb to the electrocatalyst surface.19 CH3Cl decomposes to HCl quickly at SOFC operating temperatures.20 Adsorbed halogens disrupt cell operation in a variety of ways depending on temperature. At 650 °C, adsorbed halogens reversibly occupy available active sites on the nickel21,22 preventing dissociation of the fuel.23 This effect is much more pronounced for carbon containing fuels than for hydrogen.24,25 The loss of catalytic activity is compounded by oxidation of the nickel anode itself when SOFCs are required to produce power under the demand of constant current.26 At these lower temperatures, removal of chlorine from the incident fuel leads to almost complete recovery of SOFC performance provided that the anode has not suffered excessive oxidative damage during chlorine exposure.24
At higher temperatures (700 °C) chlorine reacts more readily with the nickel catalyst and the non-zero vapor pressure of nickel chloride results in sublimation.25,27 Nickel loss is an irreversible degradation mechanism that eventually leads to total device failure.28–32 However, in SOFCs where NiClx sublimation is a relevant concern, anode exposure to chlorine initially leads to improved performance with H2 before the cell begins showing signs of chlorine induced degradation. This period of improved performance can last for several hours and has been attributed to NiClx sublimation creating more nickel surface area and, correspondingly, more sites for H2 activation.25 These effects are not observed when H2 is replaced with higher molecular weight fuels such as CH4. In these instances, introducing chlorine to the SOFC anode results in a loss of cell performance that is not recoverable.33–35 Irreversible performance loss has been attributed to chlorine more effectively blocking the larger carbon containing molecules from adsorbing, resulting in fuel starvation and nickel oxidation under galvanostatic conditions.24,25 Methane has a significantly higher activation barrier than hydrogen when chemisorbing on nickel, possibly accounting for chlorine's enhanced ability to suppress the performance of SOFCs operating with methane relative to H2.34–42 Regardless of the degradation mechanisms, differences between chlorine-induced degradation of SOFCs operating with H2 and with carbon containing fuels imply differences in surface chemistry and conversion efficiencies. Emerging models describing SOFC deactivation by contaminants need to account for these differences and will require experimental validation.
SOFC surface chemistry with biogas is more complicated than with either H2 or CH4.43–45 H2 can adsorb and either dissociate and be oxidized or recombine and desorb. CH4 will also dissociatively adsorb on a nickel catalyst and if the SOFC is at open circuit voltage or producing only small currents, carbon that is not oxidized will accumulate in the form of graphite or ‘coke’.26,46 With biogas, however, any carbon formed from CH4 dissociation can be removed through dry reforming reactions (eqn (1)–(3)), specifically through the direct oxidation of carbon by CO2 (eqn (3)).
CH4(g) + CO2(g) ![[left over right harpoons]](https://www.rsc.org/images/entities/char_21cb.gif) 2H2(g) + 2CO(g) 2H2(g) + 2CO(g) | (1) |
CO2(g) + H2(g) ![[left over right harpoons]](https://www.rsc.org/images/entities/char_21cb.gif) H2O(g) + CO(g) H2O(g) + CO(g) | (2) |
C(s) + CO2(g) ![[left over right harpoons]](https://www.rsc.org/images/entities/char_21cb.gif) 2CO(g) 2CO(g) | (3) |
While favored at higher temperatures, dry reforming remains an active carbon removal mechanism47 at temperatures as low as 650 °C. Given the sensitivity of SOFCs to chlorine surface contamination and the role played by dry reforming in keeping SOFC anode surfaces free of carbon, identifying relationships between anode stability, chlorine contamination and temperature becomes an important issue if biogas is to become a viable fuel for SOFC applications.
Studies described below examine the effects of adding 110 ppm chlorine in the form of CH3Cl and HCl to a biogas surrogate used by electrolyte supported SOFCs operating at 650 °C and 700 °C. Operando Raman spectroscopy quantifies chlorine's ability to inhibit fuel activation and subsequent carbon accumulation on Ni–YSZ cermet anodes while electrochemical impedance spectroscopy (EIS) and voltammetry measurements monitor how SOFC performance changes as a function of exposure time and applied cell polarization. The data show interesting and surprising differences when compared with results from SOFCs operating with methane alone. Chlorine-induced degradation in SOFCs operating with CH4 begins immediately after chlorine exposure and follows different mechanisms at 650 °C and 700 °C. SOFCs operating with chlorine-containing biogas, in contrast, show only modest degradation regardless of temperature before abruptly failing catastrophically. The mechanism responsible for device failure appears to be electrochemically driven as passive exposure to chlorine-containing biogas does not result in irreversible cell damage on the timescale of these studies.
Methods
Electrolyte supported membrane electrode assemblies measuring 25.4 mm diameter with 250–300 μm thick “Hionic” electrolytes were purchased from Fuel Cell Materials. Fuel cell anodes consisted of a 50 μm thick Ni–YSZ cermet and an approximately 5 μm thick Ni–GDC interlayer. Cathodes included a 50 μm thick LSM layer and approximately 5 μm thick LSM–GDC interlayer. Gold and platinum pastes attached 3 × 3 mm silver and platinum current collectors and lead wires to the anode and cathode, respectively. The relatively small current collectors were necessary in order to allow for optical access to the anode surface. A Renishaw in-Via Raman Microscope and a 25 mW, 488 nm Ar-Ion laser were used to collect Raman spectra and a Princeton Applied Research Versastat 3 collected electrochemical data. Mica gaskets isolated the anode and cathode atmospheres in a custom designed assembly dubbed SAwCER (SOFC Assembly with Concurrent Electrochemistry and Raman) discussed previously.24 With 55 sccm argon on the anode and 85 sccm air on the cathode, cells were heated to a target temperature of 650 °C or 700 °C at a rate of 3 °C per minute. At the target temperature, the anode was reduced using a flow of 18 sccm H2 in 55 sccm Ar as a carrier. When the cell reached an open circuit voltage (OCV) of −1.0 V, H2 flow was increased to 100 sccm. After one hour of further reduction, OCV was typically −1.13 ± 0.02 V relative to the O2 reduction potential. Electrochemical benchmarks were recorded with H2 and Ar flows of 100 sccm and 55 sccm, respectively. Linear scan voltammetry data were acquired with a sweep rate of 0.1 V per second and were stopped when the cell voltage reached −0.2 V in order to avoid a short circuit condition that might damage the anode. EIS data were acquired at OCV using with a 10 mV AC amplitude and frequencies ranging from 100![[thin space (1/6-em)]](https://www.rsc.org/images/entities/char_2009.gif) 000 Hz to 0.1 Hz. No high frequency induction arcs were observed.
000 Hz to 0.1 Hz. No high frequency induction arcs were observed.
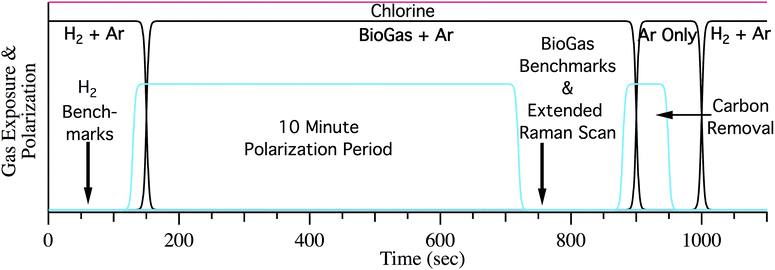
After characterizing initial cell performance, the anode was exposed to biogas. Two types of studies were performed. Cells were either subjected to multiple polarization cycles (see below) or analyzed during several hours of continuous polarization (in the presence of chlorine). In the cycling experiments the cell was first benchmarked with hydrogen and biogas without chlorine to determine the overall performance. Fig. 1 describes the sequence of steps in a cycle for the repeated polarization experiments. After the initial H2 reduction and characterization, the cell was exposed to synthetic biogas (50% CH4 50% CO2) with 55 sccm Ar as a carrier gas at OCV. Following 10 minutes at OCV, the cell is electrochemically benchmarked under the same flow of biogas and Ar. Accumulated carbon is then electrochemically removed by polarizing the SOFC in the absence of any fuel other than the carbon on the surface. Polarization was stopped following the disappearance of carbon from the Raman spectra and well before the onset of observable nickel oxide formation.26 Finally, cells were re-reduced using H2 fuel and the cycle was repeated. Following the initial cycle at OCV the cell was polarized to 50% of its maximum current during the 10 minute polarization period. The maximum current was determined from extrapolating LSV data from the initial biogas LSV trace to the x-intercept. Chlorine was introduced to the fuel stream in the form of 110 ppm CH3Cl or HCl once the cell performance stabilized during the 10 minute polarization period, typically after 2–3 cycles. Cells were then cycled with a constant 110 ppm chlorine until the potential under polarization crossed 0 V. Following cell failure, cell recovery or cooling commenced. Recovery required exposing the anode to 18 sccm of H2 and 55 sccm of argon for one hour. Cells were then cooled with argon on both the anode and cathode to preserve their chemical conditions for ex situ analyses.
Long exposure experiments consisted of the same initial heatup and characterization as the cycling experiments. After performance stabilization during the initial cycle at OCV, the contaminant flow was turned on, the cell was polarized to 50% Imax and performance was monitored for 8–12 hours. Upon failure of the cell, the apparatus was cooled under argon atmospheres for both the anode and cathode.
Results and discussion
These studies combined operando Raman spectroscopy with traditional electrochemical voltammetry and impedance measurements. Individually, both report on different aspects of the anode's condition. Raman spectroscopy provides an operando assessment of the amount of methane activated by the nickel and deposited on the anode surface while voltammetry provides details about the overall cell performance. Together, data from the combined experiments afford unprecedented insight into how molecular and material changes in the anode correspond to electrochemical performance and oxidation mechanisms. Data from each method are described below before considering how results interrelate and suggest mechanisms responsible for chlorine-induced degradation and eventual device failure.Raman spectroscopy
Due to the volatility of Raman active chlorine compounds at temperatures above 600 °C, direct spectroscopic observation of chlorine containing materials is not possible with the assembly used in these experiments.27 Instead, chlorine adsorption is inferred from a reduction in anode activity towards CH4 activation and carbon accumulation. As more chlorine adsorbs to active sites throughout the porous anode, less carbon accumulates relative to SOFCs operating in the absence of chlorine. While carbon removal via dry reforming (eqn (3)) is rapid at higher temperatures (e.g. 800 °C), below ∼700 °C, the reverse reaction becomes thermodynamically favorable (assuming standard states) so that at temperatures used in these studies – 650 °C and 700 °C – one expects to observe some carbon accumulation from biogas provided that active catalytic sites remain available.45Fig. 2 shows an operando spectrum of carbon on the anode surface following ten minutes of exposure to biogas at 650 °C while the cell was held at OCV.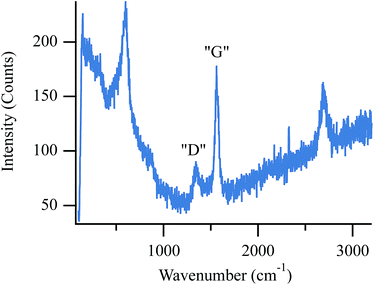 | ||
| Fig. 2 Operando spectrum of accumulated carbon on the surface of a SOFC operating with biogas at 650 °C and held at OCV. | ||
Moving from low to high frequency, the first peak in this spectrum occurs at 595 cm−1 and results from the F2g mode in cubic zirconia.48 The remaining peaks indicate carbon on the anode surface. The peak at 1356 cm−1 (labeled “D”) correlates to graphite containing point defects and/or grain boundaries and is often referred to as “disordered” carbon. The next peak, (labeled “G”) at 1556 cm−1, correlates to the in-plane optically-active vibration (E2g mode) of defect-free graphite sheets.49,50 Finally, the peak at 2698 cm−1 is a second order peak often named either G′ or 2D. Although the origin of this feature remains debated in the literature, this transition is typically assigned to electron–phonon coupling of second order zone boundary phonons that are disallowed in the first order spectra.49,50
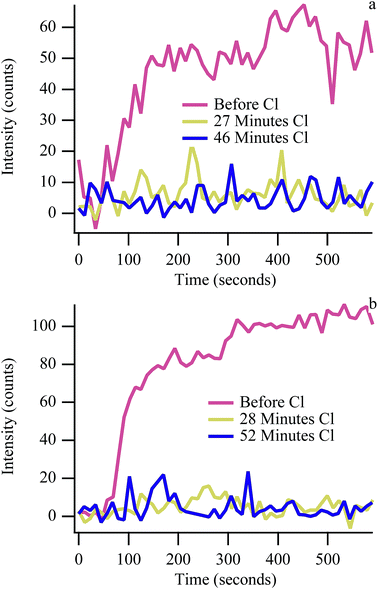
Exposing the anode to 110 ppm CH3Cl or HCl suppresses carbon accumulation when operating with biogas much more quickly than with CH4 alone. Fig. 3 shows the kinetics of G peak intensity growth in cells operating at 50% Imax as a function of time and cumulative chlorine exposure at both 650 °C and 700 °C. In the absence of chlorine, carbon signal intensity increases rapidly before stabilizing (Fig. 3, red traces). Carbon “G” peak intensity when operating on biogas is lower than typically observed with methane experiments, indicating steady state conditions. The first cycle following the start of chlorine exposure (27 minutes and 28 minutes) shows no carbon accumulation during the 10 minute polarization period at both temperatures. In contrast, when exposed to chlorine-containing methane without any carbon dioxide present, carbon accumulation is suppressed more slowly at 650 °C and never completely suppressed at 700 °C.24,25 The reduction in signal with methane was attributed to chlorine adsorption to the nickel surface, with adsorbed chlorine blocking active catalytic sites and preventing CH bond activation. Carbon still continued to accumulate over the first ∼3 cycles at 650 °C and ∼14 cycles at 700 °C with methane. The abrupt reduction in signal with chlorine-containing biogas implies that although dry reforming is not favorable enough to keep carbon from forming in the absence of chlorine (Fig. 2), by reducing the total amount of carbon that can accumulate (and reducing the number of active sites through chlorine adsorption), dry reforming at 650 °C and 700 °C is efficient enough to keep anodes ‘carbon free’ (within detection limits) when chlorine is present. Carbon signal intensity returns upon removal of chlorine from the incident fuel feed (discussed above), indicating that physisorbed chlorine has desorbed from the anode, restoring catalytic sites (Fig. S1†).
Electrochemistry
Fig. 4 and 5 show LSV and EIS results at 650 °C operating with H2/CH3Cl and CH4:CO2/CH3Cl respectively. The H2/CH3Cl data shown here are very similar to results reported previously and are included for comparative purposes.24,25 (Biogas and H2 data acquired at 700 °C appear very similar to 650 °C data, and are shown in ESI, Fig. S2–S5.†) A small decrease in the maximum cell current throughout the experimental cycling is shown in the H2 LSV plot (Fig. 4a), as evidenced by a slight increase in the V–I slope throughout the ohmic region. (Similar effects with H2 were also observed with no chlorine present.) Complementary behavior is observed in H2 EIS data with a modest increase in the polarization resistance while the series resistance remains unchanged. A slight recovery between the penultimate and ultimate cycles can be attributed to a longer than normal dormant period between exposures, allowing for the release of some adsorbed chlorine resulting slightly higher performance than expected. Biogas EIS data (Fig. 5) behave similarly to the H2 results, with the most pronounced change being a larger increase in the polarization resistance, most prominently in the low frequency arc, traditionally attributed to mass transport throughout the anode.51,52 When operating with carbon containing fuels, an increase in this arc signifies carbon accumulation within the anode's porous microstructure of the anode. In the current studies, any carbon that does form must be far enough into the anode so that it is not observed in Raman spectra that sample only the top-most anode surface.26 Despite CH4 being one of the two principle components of biogas, significant differences distinguish the electrochemical behavior of SOFCs operating with chlorine containing biogas from those operating with chlorine containing methane.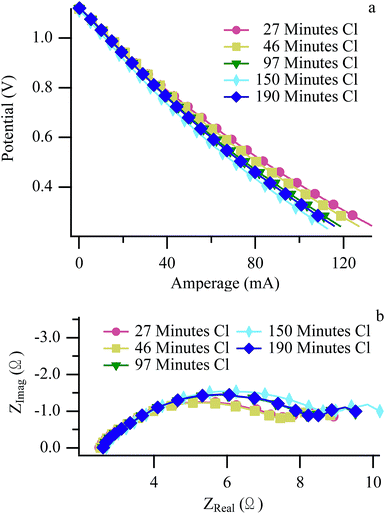 | ||
| Fig. 4 Hydrogen LSV (a) and EIS (b) at 650 °C acquired at the “H2 Benchmarks” arrow in Fig. 1. | ||
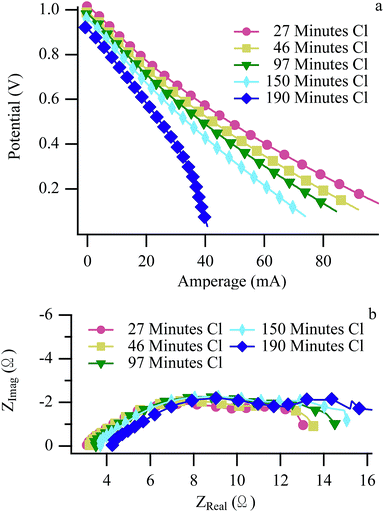 | ||
| Fig. 5 Biogas LSV (a) and EIS (b) at 650 °C acquired at the “Biogas Benchmarks” arrow in Fig. 1. | ||
The biggest difference between the biogas and CH4 experiments is that at some time after chlorine exposure begins, the cell operating with biogas fails catastrophically as evidenced by a steep decline in the biogas voltammetry data (Fig. 5a: blue diamonds). Identical catastrophic failures were observed across multiple experiments at both 650 °C and 700 °C using chlorine-containing biogas as a fuel, but never when CH4 (with chlorine) was used by itself.24,25 (Fig. S8†) Unlike previous reports that demonstrated different degradation methods and significantly longer operation until failure with CH4 at 700 °C compared to 650 °C, data from the biogas experiments resulted in identical failure mechanisms occurring on similar time scales at both temperatures.
Potential vs. time
Neither Raman experiments nor electrochemical measurements provide direct, material specific information about the origin of the failure observed in Fig. 5. However, failure mechanisms can be inferred by considering degradation rates. Galvanostatically polarizing the cell to 50% Imax resulted in catastrophic failures during cycling in both the 650 °C (Fig. 6) and 700 °C (Fig. 7) experiments. The mechanism at both temperatures resulted in rapidly falling potential under polarization (dark blue diamonds on both figures). Unlike results with chlorine contaminated methane, little degradation occurred before the catastrophic failure, as is particularly evident in Fig. 7. Generally, catastrophic failures such as those observed in Fig. 6 and 7 (blue diamond traces) would be attributed to some sort of structural breakdown that compromised separation between anode and cathode atmospheres or large-scale material changes such as those that result from redox cycling or formation of insulating phases.26,53,54 However, the SOFC remained intact and gas separation was never compromised, as evidenced by recovery data (Fig. S6†) and ex situ cell analysis. The failures observed in these chlorine containing biogas studies occur only when the cell is polarized and never when the cell is at OCV indicating that active electrochemical oxidation plays a role in promoting the sudden and dramatic degradation.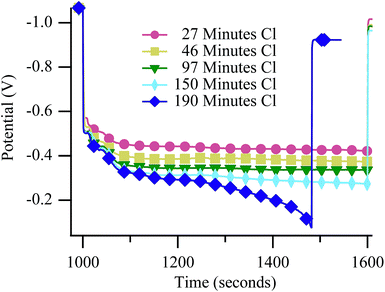 | ||
| Fig. 6 Potential vs. time at 650 °C during the 10 minute polarization period while the SOFC was polarized to 50% Imax and operating with biogas. | ||
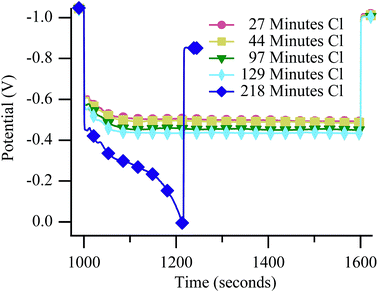 | ||
| Fig. 7 Potential vs. time at 700 °C during the 10 minute polarization period while the SOFC was polarized to 50% Imax and operating with biogas. | ||
Proposed mechanism
Previous work concluded that chlorine-induced degradation in cells operating with methane resulted from fuel starvation due to chlorine occupation of nickel's catalytically active sites and forced electrode oxidation due to the galvanostatic polarization.24,25 Methane dissociates on a pristine Ni–YSZ anode producing adsorbed hydrogen and carbon,38 and both species can be electrochemically oxidized. Adsorbed chlorine slowly, over the course of 5–6 hours, limits CH4 chemisorption by adsorbing to catalytically active nickel sites. Chlorine blocks CH4 adsorption and decomposition; eventually starving the SOFC of oxidizable fuel (coke and hydrogen), leading to cell cannibalization via nickel oxidization under galvanostatic conditions. At 700 °C, fuel starvation is slightly mitigated, likely by the formation of NiClx compounds that sublimate, constantly exposing fresh nickel surface.27 Cell failure occurs eventually due to both the anode's diminished nickel content and chlorine occupying sites on the remaining nickel particles. The same mechanisms will occur with biogas, but with increased chemical complexity on the anode surface.One explanation for the differences observed between biogas and methane assumes that the biogas degradation results from a cascade of heterogeneous surface reactions that compromise cell performance and ultimately destroy the nickel anode when the cell operates galvanostatically.
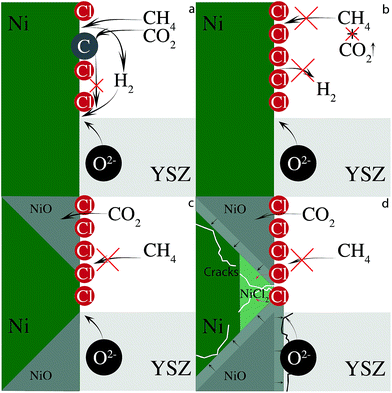
CO2 can remove built up carbon via dry reforming (eqn (3)). This process will adversely affect anode performance by removing oxidizable fuel, assuming that the newly formed CO desorbs and is not electrochemically oxidized. Less fuel forces the cell to oxidize nickel to provide current when chlorine blocks methane adsorption. Furthermore, CO2 itself is a weak oxidizing agent and can further oxidize the nickel anode to NiO.55 In the absence of chlorine, carbon removal through dry reforming will simply reopen active nickel sites for further dissociative CH4 chemisorption. Chlorine, however, can adsorb to the newly unoccupied nickel site further limiting anode electrocatalytic activity. The minor, adverse changes in electrochemical behavior of cells operating with biogas resemble those observed with SOFCs operating with hydrogen and imply that the cell is operating with hydrogen and not carbon. This scheme is illustrated in Fig. 8.
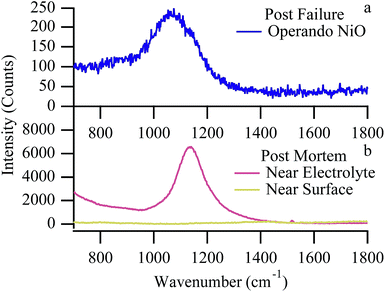
The critical step in this mechanism is the formation of NiO (Fig. 9) and the irreversible loss of anode conductivity, either through electrochemical oxidation or through heterogeneous surface reactions with CO2. In addition to the anode's electrical conductivity being compromised by NiO formation, it is further reduced at 650 °C by the formation of electronically insulating nickel chloride compounds (Fig. 8d). At 700 °C, these compounds volatilize, removing nickel from the anode network and reducing biogas performance over time, but the data suggest that degradation caused by the nickel oxidation far outpaces any degradation due to NiClx sublimation.
Post failure, the cell's OCV does not return to the pre-failure value indicating that cell failure has resulted in material change fundamentally altering the electrochemical reactions that can occur.
Fuel cell temperature with Raman
Raman data provide some evidence of physical changes that occur within the cell during a failure event such as the ones shown in Fig. 6 and 7. As the cell nears failure, the vibrational feature at 595 cm−1, assigned to an F2g mode of YSZ, shifts temporarily to lower frequency. Shifts in cubic zirconia's F2g vibrational frequency can arise from several sources. High temperature aging over hundreds of hours is known to slowly change the material's local yttria content and induce a slow phase transition from a cubic to tetragonal lattice structure.48,56 With its different symmetry and phonon structure, however, the dominant feature in a tetragonal YSZ vibrational spectrum shifts to higher frequency, not lower. Furthermore, given the relatively short duration of the experiments described in this work, such large-scale changes in material composition seem unlikely. The F2g vibrational frequency has a well defined temperature dependence:57| ω = −0.0388·T + 618.5 cm−1 | (4) |
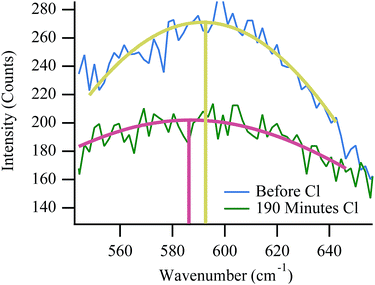 | ||
| Fig. 10 Expanded view of YSZ F2g peak position with respect to chlorine trial number (and subsequently chlorine exposure time). | ||
Effect of redox cycling on aging kinetics
Redox cycling of a fuel cell anode causes irreversible degradation and diminished performance over time52,54 likely due to irreversible change within the SOFC anode's microstructure.53,58,59 In order to eliminate the redox cycling itself as a source of the final catastrophic failure, long term experiments with no cycling were also performed. These experiments show the same type of degradation as in the cycling experiments, although the degradation requires a longer exposure, implying that the cycling experiments introduce a small degree of accelerated aging. Observed degradation with biogas is still much quicker than with chlorine-contaminated H2 or CH4, however. Fig. 11 shows a potential vs. time plot while the cell was polarized to 50% Imax for ∼6 hours while operating with biogas. The plot shows the slow degradation associated with chlorine contamination. Toward the end of the experiment the slope becomes significantly steeper indicating the onset of device failure (red circle), even in the absence of redox cycling. Control experiments with the more harsh cycling procedure showed virtually no change in slope during polarization, even after many hours (Fig. S7†).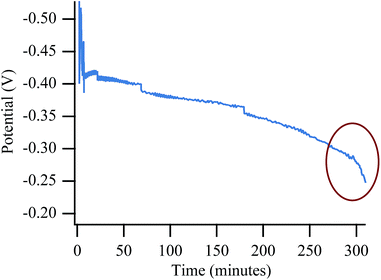 | ||
| Fig. 11 Potential vs. time trace for non-cycling experiment showing a significant and sudden voltage drop of an SOFC operated on biogas at 650 °C. | ||
Conclusion
Degradation induced by chlorine in a SOFC operating with biogas is different than the mechanism proposed by electrochemical studies using either hydrogen or methane as a fuel. Cell degradation rates with biogas are faster than with either hydrogen or methane alone. The data above do support the initial two-stage mechanism consistent with proposed degradation in SOFCs operating with both chlorine containing H2 and CH4, but operation with biogas also shows new mechanisms not considered previously. Chlorine adsorption reduces methane cracking by nickel and what solid carbon is formed is removed by CO2, reducing fuel available to the SOFC and causing rapid degradation. Continued chlorine exposure eventually impedes methane cracking and dry reforming reactions completely, heating the fuel cell due to the loss of the endothermic dry reforming reaction. The loss of oxidizable fuel causes anode cannibalization due to the galvanostatic polarization conditions, forming NiO and destroying anode interconnected microstructure, causing the potential to rise and the fuel cell to fail catastrophically at both 650 °C and 700 °C. These mechanisms occur much more rapidly than nickel chloride sublimation thought to be responsible for the long-term degradation in SOFCs operating with hydrogen and chlorine. Raman spectroscopy was used to monitor the effect the chlorine had on nickel's catalytic activity towards methane. Additionally, Raman data showed evidence of large but transient thermal stress that accompanied device failure. In conclusion, multiple electrochemical techniques combined with operando Raman spectroscopy provide a mechanistic picture of the degradation occurring on the anode of a fuel cell when operating on biogas and exposed to chlorine contaminants.Acknowledgements
The authors gratefully acknowledge support from the Office of Naval Research (ONR000141410326). The authors thank Dr Jeff Owrutsky, Dr Daniel Steinhurst, and Dr John Kirtley (all from the Naval Research Laboratory) for helpful discussions.References
- A. H. Seifert, S. Rittmann and C. Herwig, Appl. Energy, 2014, 132, 155 CrossRef CAS.
- M. Götz, J. Lefebvre and F. Mörs, et al. , Renewable Energy, 2016, 85, 1371 CrossRef.
- J. H. Fike, D. J. Parrish and D. D. Wolf, et al. , Biomass Bioenergy, 2006, 30, 198 CrossRef.
- S. Rasi, A. Veijanen and J. Rintala, Energy, 2007, 32, 1375 CrossRef CAS.
- J.-W. Snoeck, G. F. Froment and M. Fowles, J. Catal., 1997, 169, 240 CrossRef CAS.
- A. Amin, W. Epling and E. Croiset, Ind. Eng. Chem. Res., 2011, 50, 12460 CrossRef CAS.
- J. Bao, G. N. Krishnan, P. Jayaweera, J. Perez-Mariano and A. Sanjurjo, J. Power Sources, 2009, 193, 607 CrossRef CAS.
- J. Jia, Q. Li, M. Luo, L. Wei and A. Abudula, Energy, 2011, 36, 1068 CrossRef CAS.
- M. Powell, K. Meinhardt, V. Sprenkle, L. Chick and G. Mcvay, J. Power Sources, 2012, 205, 377 CrossRef CAS.
- X. Ge, L. Zhang, Y. Fang, J. Zeng and S. H. Chan, RSC Adv., 2011, 1, 715 RSC.
- Q. Qin, K. Xie, H. Wei, W. Qi, J. Cui and Y. Wu, RSC Adv., 2014, 4, 38474 RSC.
- V. Duboviks, M. Lomberg, R. C. Maher, L. F. Cohen, N. P. Brandon and G. J. Offer, J. Power Sources, 2015, 293, 912 CrossRef CAS.
- A. M. Limarga, S. Shian, M. Baram and D. R. Clarke, Acta Mater., 2012, 60, 5417 CrossRef CAS.
- H. H. Krause, J. Mater. Energy Syst., 1986, 9, 322 CrossRef.
- K. Haga, Y. Shiratori, K. Ito and K. Sasaki, J. Electrochem. Soc., 2008, 155, B1233 CrossRef CAS.
- K. Haga, S. Adachi, Y. Shiratori, K. Itoh and K. Sasaki, Solid State Ionics, 2008, 179, 1427 CrossRef CAS.
- S. Rasi, J. Läntelä and J. Rintala, Energy Convers. Manage., 2011, 52, 3369 CrossRef CAS.
- F. N. Cayan, M. Zhi, S. R. Pakalapati, I. Celik, N. Wu and R. Gemmen, J. Power Sources, 2008, 185, 595 CrossRef CAS.
- M. C. Galetz, B. Rammer and M. Schütze, Mater. Corros., 2015, 66, 1206 CrossRef CAS.
- W. Ho, Q.-R. Yu and J. W. Bozzelli, Combust. Sci. Technol., 1992, 85, 23 CrossRef CAS.
- H. Ishii, K. Asakura, T. Ohta, Y. Kitajima and H. Kuroda, Jpn. J. Appl. Phys., 1993, 32, 368 CrossRef CAS.
- A. Zahs, M. Spiegel and H. J. Grabke, Corros. Sci., 2000, 42, 1093 CrossRef CAS.
- O. A. Marina, L. R. Pederson, E. C. Thomsen, C. A. Coyle and K. J. Yoon, J. Power Sources, 2010, 195, 7033 CrossRef CAS.
- K. W. Reeping and R. A. Walker, J. Electrochem. Soc., 2015, 162, F1310 CrossRef CAS.
- K. W. Reeping, J. D. Kirtley, J. M. Bohn, D. A. Steinhurst, J. C. Owrutsky and R. A. Walker, J. Phys. Chem. C, 2017, 121, 2588 CAS.
- J. D. Kirtley, D. M. Halat, M. D. Mcintyre, B. C. Eigenbrodt and R. A. Walker, Anal. Chem., 2012, 84, 9745 CrossRef CAS PubMed.
- Y.-N. Chang and F.-I. Wei, J. Mater. Sci., 1991, 26, 3693 CrossRef CAS.
- M. Brown, S. Primdahl and M. Mogensen, J. Electrochem. Soc., 2000, 147, 475 CrossRef CAS.
- J. R. Wilson and S. A. Barnett, Electrochem. Solid-State Lett., 2008, 11, B181 CrossRef CAS.
- J. Dong, Z. Cheng, S. Zha and M. Liu, J. Power Sources, 2006, 156, 461 CrossRef CAS.
- J. N. Kuhn, N. Lakshminarayanan and U. S. Ozkan, J. Mol. Catal. A: Chem., 2008, 282, 9 CrossRef CAS.
- A. Hagen, J. F. B. Rasmussen and K. Thydén, J. Power Sources, 2011, 196, 7271 CrossRef CAS.
- E. D. German and M. Sheintuch, J. Phys. Chem. C, 2013, 117, 22811 CAS.
- H. Yang and J. L. Whitten, J. Chem. Phys., 1988, 89, 5329 CrossRef CAS.
- C. H. Bartholomew, Catal. Lett., 1990, 7, 27 CrossRef CAS.
- V. E. Ostrovskii, Thermochim. Acta, 2009, 489, 5 CrossRef CAS.
- H. Yang and J. L. Whitten, J. Chem. Phys., 1992, 96, 5529 CrossRef CAS.
- B. Ø. Nielsen, A. C. Luntz and P. M. Holmblad, Catal. Lett., 1995, 32, 15 CrossRef CAS.
- Q. Sun, J. Xie and T. Zhang, Surf. Sci., 1995, 338, 11 CrossRef CAS.
- P. Kratzer, B. Hammer and J. K. Norskov, J. Chem. Phys., 1996, 105, 5595 CrossRef CAS.
- D. R. Mullins, D. R. Huntley, T. Tang, D. K. Saldin and W. T. Tysoe, Surf. Sci., 1997, 380, 468 CrossRef CAS.
- F. Abild-Pedersen, O. Lytken, J. Engbæk, G. Nielsen, I. Chorkendorff and J. K. Nørskov, Surf. Sci., 2005, 590, 127 CrossRef CAS.
- E. S. Hecht, G. K. Gupta and H. Zhu, et al. , Appl. Catal., A, 2005, 295, 40 CrossRef CAS.
- Y. Shiratori, T. Ijichi, T. Oshima and K. Sasaki, Int. J. Hydrogen Energy, 2010, 35, 7905 CrossRef CAS.
- J. D. Kirtley, M. B. Pomfret, D. A. Steinhurst, J. C. Owrutsky and R. A. Walker, J. Phys. Chem. C, 2015, 119, 12781 CAS.
- J. D. Kirtley, D. A. Steinhurst, J. C. Owrutsky, M. B. Pomfret and R. A. Walker, Phys. Chem. Chem. Phys., 2014, 16, 227 RSC.
- A. Lanzini, P. Leone, C. Guerra, F. Smeacetto, N. P. Brandon and M. Santarelli, Chem. Eng. J., 2013, 220, 254 CrossRef CAS.
- K. Nomura, Y. Mizutani, M. Kawai, Y. Nakamura and O. Yamamoto, Solid State Ionics, 2000, 132, 235 CrossRef CAS.
- A. C. Ferrari, Solid State Commun., 2007, 143, 47 CrossRef CAS.
- S. Reich and C. Thomsen, Philos. Trans. R. Soc., A, 2004, 362, 2271 CrossRef CAS PubMed.
- P. Hofmann and K. D. Panopoulos, J. Power Sources, 2010, 195, 5320 CrossRef CAS.
- J. Laurencin, G. Delette, O. Sicardy, S. Rosini and F. Lefebvre-Joud, J. Power Sources, 2010, 195, 2747 CrossRef CAS.
- D. Waldbillig, A. Wood and D. G. Ivey, J. Power Sources, 2005, 145, 206 CrossRef CAS.
- D. Sarantaridis and A. Atkinson, Fuel Cells, 2007, 7, 246 CrossRef CAS.
- J. Kirtley, A. Singh, D. Halat, T. Oswell, J. M. Hill and R. A. Walker, J. Phys. Chem. C, 2013, 117, 25908 CAS.
- M. Hattori, Y. Takeda and Y. Sakaki, et al. , J. Power Sources, 2004, 126, 23 CrossRef CAS.
- M. B. Pomfret, J. C. Owrutsky and R. A. Walker, J. Phys. Chem. B, 2006, 110, 17305 CrossRef CAS PubMed.
- T. Klemensø and M. Mogensen, J. Am. Ceram. Soc., 2007, 90, 3582 CrossRef.
- T. Shimura, Z. Jiao and N. Shikazono, J. Power Sources, 2016, 330, 149 CrossRef CAS.
Footnote |
| † Electronic supplementary information (ESI) available. See DOI: 10.1039/c7se00156h |
| This journal is © The Royal Society of Chemistry 2017 |

