 Open Access Article
X-ray circular dichroism signals: a unique probe of local molecular chirality†
Yu
Zhang‡
 *a,
Jérémy R.
Rouxel‡
*a,
Jochen
Autschbach
*a,
Jérémy R.
Rouxel‡
*a,
Jochen
Autschbach
 *b,
Niranjan
Govind
*c and
Shaul
Mukamel
*a
aDepartment of Chemistry, University of California, Irvine, CA 92697, USA. E-mail: yuz10@uci.edu; jrouxel@uci.edu; smukamel@uci.edu
bDepartment of Chemistry, University at Buffalo, State University of New York, Buffalo, NY 14260, USA. E-mail: jochena@buffalo.edu
cEnvironmental Molecular Sciences Laboratory, Pacific Northwest National Laboratory, Richland, WA 99352, USA. E-mail: niri.govind@pnnl.gov
First published on 26th June 2017
Abstract
Core-resonant circular dichroism (CD) signals are induced by molecular chirality and vanish for achiral molecules and racemic mixtures. The highly localized nature of core excitations makes them ideal probes of local chirality within molecules. Simulations of the circular dichroism spectra of several molecular families illustrate how these signals vary with the electronic coupling to substitution groups, the distance between the X-ray chromophore and the chiral center, geometry, and chemical structure. Clear insight into the molecular structure is obtained through analysis of the X-ray CD spectra.
1 Introduction
Chirality is an interesting geometrical property of molecules which are non-superimposable on their mirror images. Molecular chirality has deep connections to the fundamental physics principle of parity violation.1 Optical activity and circular dichroism (CD) are well established spectroscopic techniques to detect molecular chirality in the infrared (IR) to the near-ultraviolet (UV) regimes.2,3 These signals vanish for ensembles of randomly oriented achiral molecules and carry valuable information about absolute molecular conformations. A considerable effort has been made recently to enhance these signals,4 which are intrinsically weak compared to linear absorption signals since they depend on higher order terms in the multipolar expansion of the field–molecule interaction. The spatial variation of incoming light by e.g. nano-optical techniques can be used to optimize these chiral signals.5In the X-ray regime, the technique is known as X-ray circular dichroism (XCD) or X-ray natural circular dichroism (XNCD).6 Another chiral technique, X-ray magnetic circular dichroism (XMCD), measures the CD signals induced by an external magnetic field.7,8 The relevant transitions in XCD are localized near the core-excited atom. This localization makes the technique more sensitive to the local molecular structures. Cohen4 has proposed to optimize the optical chirality by selecting positions where molecules are preferably excited by a spatially sculpted chiral field. Understanding the local variation of XCD signals within a molecule helps to further refine this approach5 by placing the X-ray chromophore in an optimal location. To first order in the incoming field (the linear response function is χ(1)), in general one must include a multipolar expansion of the radiation/matter coupling at least to first order in the wavevector k, i.e. include the magnetic dipole and the electric quadrupole transition moments. The CD signal, defined as the difference between the absorption of left and right polarized light,2,9 directly targets the chiral part of the response tensor and vanishes for achiral molecules.
There are a wide variety of options as to how to conduct a CD experiment in the X-ray regime. In the soft X-ray range, circularly polarized light from synchrotron sources has been used for the past few decades.10 XCD signals can be acquired in the frequency domain where a continuous wave can be scanned to generate the CD signal. Alternatively, in the time domain, the free induction decay after an impulsive excitation is measured and Fourier transformed. Recent technological developments allow the use of free electron laser (FEL) based X-ray light11–16 and tabletop sources based on a high harmonic generation (HHG) process.17,18 X-ray CD experiments are more challenging than their optical counterparts because of the lack of good circularly polarized X-ray light sources. Intense circularly polarized X-ray beams became available using helical undulators in the 1990s,19,20 and then a series of XCD measurements on single crystals were reported.21–23 So far, most XCD experiments have been carried out on crystals. The main type of X-ray circular dichroism technique has been XMCD,7,24,25 in which centrosymmetry is broken by an external static magnetic field, revealing information on the atomic magnetic properties. All amino acids in living bodies except for glycine are chiral. XCD experiments at the C, N and O K-edges on small amino-acids were performed in the 2000s.26,27 Polypeptide chains can give characteristic UV-vis CD spectra which contain information about their conformations. Optical CD signals have been widely used to study ligand–protein interactions and the secondary and tertiary structures of proteins.28 The time-resolved vibrational CD technique has made it possible to observe ultrafast molecular structural changes.29 However, the relation of XCD signals to the molecular geometry and to the chemical and electronic structure has not been thoroughly established.
Here, we report core-level time-dependent density functional theory (TDDFT)30–37 based XCD simulations of several series of chiral molecules where a distinct X-ray chromophore (chlorine atom) is attached at various positions. The XCD signals at the chlorine L2,3-edges (∼200 eV) provide a highly localized probe of the chirality. The electronic effect on XCD signals is studied in the following systems: chlorophenylethanol (CPEO, chemical structures shown in Fig. 1) and hexahelicene molecules n-chlorohexahelicene (nCHHC, n = 1–8, structures shown in Fig. 3), which are benchmarks for global chirality in molecules that do not have chiral centers. We further examine a family of 1-bromo-n-chloronona-2,4,6,8-tetraen-1-amine (BnCTA, n = 2–10, structures shown in Fig. 5) molecules in which the X-ray-chromophore-chiral-center distance is varied. Finally, we demonstrate how the XCD signals vary in slightly modified chemical structures of the chiral centers of two selected BnCTA molecules.
The paper is organized as follows: in section 2, we review the theory of the CD signals; computational details are provided in section 3; in section 4, we present and discuss the XCD simulation results; and finally we draw conclusions and outline some future directions in section 5.
2 The X-ray circular dichroism signal
Circular dichroism (CD) is the simplest chiral optical technique widely used to measure enantiomeric excess. The CD signal is given by the difference in the absorption spectra of a left and right circularly polarized pulse.2Our calculation starts with the Hamiltonian:
| H = H0 − μ·E(t) − m·B(t) | (1) |
| AL(ω, τ) = 2ωℑ[EL*(ω)·PL(ω) + BL*(ω)·ML(ω)], | (2) |
| SXCD(ω) = 2ωℑ[EL*(ω)·PL(ω) − ER*(ω)·PR(ω) + BL*(ω)·ML(ω) − BR*(ω)·MR(ω)]. | (3) |
Expanding the polarization and magnetization to first order in the incoming field and carrying out rotational averaging finally leads to:2
 | (4) |
| Rm0 = ℑ[μ·m] | (5) |
 | (6) |
Eqn (4) can be measured directly in the frequency domain by using an incoming weak plane wave and scanning its wavelength. Alternatively, one can make use of ultrafast circularly polarized sources to measure XCD in the time domain.40 In this case, the signal is given by a free induction decay generated by the following polarization and magnetization:
 | (7) |
 | (8) |
 | (9) |
 | (10) |
When the pulse is very short (impulsive), the incoming E/B field can be approximated by a δ function and the emitted polarization and magnetization directly give the response function; no integrations are needed. After performing rotational averaging, the self-heterodyne frequency-dispersed linear absorption is finally given by:
 | (11) |
3 Computational approach
Similarly to X-ray absorption, XCD signals of solids can be calculated in the framework of multiple scattering theory.41 Many program packages such as FEFF42 and FDMNES43 are available. The methods for calculating XCD signals in molecules have been summarized by Kimberg and Kosugi.44 These methods include the static exchange (STEX),45–47 the random phase approximation (RPA)48 and the “Hartree–Fock excited state” methods.In STEX, the occupied orbitals of a core-excited many-electron system are approximated by the restricted open-shell Hartree–Fock (ROHF) converged occupied orbitals of the corresponding (N-1)-electron system. One core electron is then placed in an excited orbital, which is an eigenvector of the projected single-electron STEX Fock operator.46,47 This projection guarantees orthogonality between the occupied and excited orbitals. STEX can be combined with the transition potential method49,50 to study XCD signals.51 Other applications of STEX in XCD simulation can be found in ref. 52–54.
RPA, or time-dependent Hartree–Fock (TDHF), is a response theory in the frequency domain using the Hartree–Fock ground state orbitals. It was used to calculate the C, N and O K-edge XCD signals of small molecules by Alagna et al.55 and was recommended by Kimberg and Kosgui44 as the most consistent and fastest method among the three.
The “Hartree–Fock excited state” method calculates each core-excited state through a self-consistent Hartree–Fock iteration. The obtained excited state orbitals should lie between the unrelaxed and relaxed STEX orbitals, and thus may provide better results than STEX does. However, solving the excited states one at a time is tedious and this also results in non-orthogonality between the excited states.
Another popular method for XCD simulation is the complex polarization propagator (CPP) method.56–58 CPP is a response theory in which the complex electric-dipole polarizability tensor and the mixed electric dipole-magnetic dipole tensor of the system are solved from a linear response matrix equation under external field perturbations. CPP has been used by Norman and co-workers to simulate XCD spectra of many chiral molecules from small amino acids to fullerene.59–61 Generally in the CPP,62 damped response63,64 and real-time propagation65–68 approaches, explicit solving of the excited states is avoided, which facilitates calculations on systems with a high density of states. However, the fact that there is no direct access to the involved excited states also makes signal interpretation less straightforward.
Here, all XCD signals at the Cl L2,3-edge were calculated using the CD spectrum module69–71 and the restricted excitation window TDDFT (REW-TDDFT)36,37 approach, implemented in the quantum chemistry package NWChem72 under the Tamm–Dancoff approximation (TDA).73–75 The rotatory strengths were calculated using the dipole-length formalism. The B3LYP hybrid functional76,77 was used. The cc-pVTZ78–80 basis set was used for all molecules except for the helicenes, where we used the basis set 6-311G**.81,82 We chose TDDFT as the method for XCD simulation for its balance between computational accuracy and cost. In addition, TDDFT is well developed, and large scale calculations can be started without too many trial-and-error tests.
We studied the Cl L2,3-edge at ∼200 eV rather than the K-edge because the corresponding 2p core excitations are not as localized as the 1s core excitations, hence the L2,3-edge XCD signals contain additional structural information on the entire molecule. Spin–orbit coupling (SOC) of the 2p electrons splits the XANES spectra and the electron–hole exchange interaction blurs the physical picture of the independent particle, thus the experimental intensity branching ratio of the transitions from the 2p3/2 and 2p1/2 orbitals may stray far from the ideal value of 2![[thin space (1/6-em)]](https://www.rsc.org/images/entities/char_2009.gif) :
:![[thin space (1/6-em)]](https://www.rsc.org/images/entities/char_2009.gif) 1.83 Recently a damped response study showed that this branching ratio in L-edge XANES was reproduced well from four-component full relativistic density function theory.84 Similarly, SOC should also play an important role in L-edge XCD. However, the sizes of the molecules in this study and the numbers of the involved excited states prohibit a full relativistic calculation. Thus we have neglected SOC in our current study. We do not expect quantitative accuracy with the current calculations. However, there is every reason to expect that SOC should not affect the most important findings, i.e., for molecules with a chiral center the amplitude of the XCD signals strongly decreases with the distance between the X-ray chromophore and the chiral center if the corresponding excitations are very localized to the excited atom, and that for globally chiral molecules the XCD signals also strongly depend on the chromophore position. A two-component TDDFT approach is under development for future XCD simulations of large molecules.
1.83 Recently a damped response study showed that this branching ratio in L-edge XANES was reproduced well from four-component full relativistic density function theory.84 Similarly, SOC should also play an important role in L-edge XCD. However, the sizes of the molecules in this study and the numbers of the involved excited states prohibit a full relativistic calculation. Thus we have neglected SOC in our current study. We do not expect quantitative accuracy with the current calculations. However, there is every reason to expect that SOC should not affect the most important findings, i.e., for molecules with a chiral center the amplitude of the XCD signals strongly decreases with the distance between the X-ray chromophore and the chiral center if the corresponding excitations are very localized to the excited atom, and that for globally chiral molecules the XCD signals also strongly depend on the chromophore position. A two-component TDDFT approach is under development for future XCD simulations of large molecules.
Here we focus on the XCD signal patterns and report the raw core excitation energies. These calculations must be shifted to reproduce experimental core excitation energies. To eliminate numerical errors, we adopted a tight SCF convergence criterion (energy change of SCF cycles < 10−8 a.u.) and an ultrafine grid in all DFT calculations. Test calculations on achiral molecules which are similar to our studied molecules show that the calculated rotatory strengths are zero within the numerical accuracy of the calculation (at least 4 orders of magnitude smaller than the rotatory strengths for chiral molecules), which guarantees that the numerical errors are negligible. All impulsive signals are convoluted using a Lorentzian lineshape with a 0.1 eV width, corresponding to the lifetime broadening of Cl L2,3 excitations.85
XCD signals were found to be particularly sensitive to the local geometry of the excited atom.61 Here, we study molecules with slightly different chemical structures. Geometry optimization would make the local geometry of the excited atoms in those molecules different, so direct comparison of the XCD signals might be an issue. In order to cleanly isolate the effects from different substituent positions relative to the chiral centers from local structural changes that may occur upon optimization, the molecules were constructed from pre-defined molecular fragments. All geometries used in the calculations are provided in the ESI.†
4 Results and discussion
4.1 The chlorophenylethanol (CPEO) series
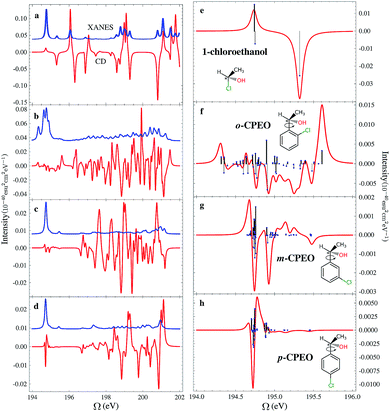
The chemical structures of the CPEOs are shown in the right column of Fig. 1. The chlorine X-ray chromophore is positioned at the ortho-, meta-, or para-position. The XCD signal of 1-chloroethanol is also provided for comparison. The XCD and X-ray absorption near edge structure (XANES) signals in the simulated energy range (194–202 eV) are shown in the left column of Fig. 1. The right column shows the XCD signals on an expanded scale in the low-energy range (194–196 eV) around the main XANES resonance. Stick spectra of the XCD signals in this energy range are also provided.We have held the geometry of the chiral center and the substituted benzene ring fixed, and only allowed the C–C single bond to rotate. We chose a series of geometries with C1–C2–C3–C4 torsion angles of 0, 60, 120, 180, 240 and 300 degrees. Here C1 denotes the C atom bound to Cl or H at the o-position; C2–C3 is the single bond connecting the chiral center and the benzene ring; and C4 is the C atom in –CH3. The XCD signals calculated for these geometries were used to compute the averaged signals. Averaging is necessary because the C–C single bond can rotate freely at room temperature. We can see in Fig. 1 that the XCD signals of 1-chloroethanol where the Cl atom is directly bound to the chiral center are much stronger than those of the CPEOs.
The rotationally averaged XANES spectra of m- and p-CPEO are similar and show a strong peak below 195 eV and many weak features in the high-energy range. The corresponding spectrum for o-CPEO has a richer peak pattern. This is because of the close proximity of the Cl atom to the chiral center, so that the rotation of the chiral center may shift the strong core excitation energies. Only limited molecular structural information can be inferred from the XANES spectra while the XCD spectra are more informative.
The XCD signal intensities of the CPEOs are summarized in Table 1. We have examined the integrated absolute value intensity in various energy regimes from low to high, as well as the peaks with the largest intensities in these energy regimes. Representative particle molecular orbitals (MOs) indicate that the low energy excitations are localized to the C–Cl bond and the benzene ring (see Fig. 2), without a substantial contribution from the atomic orbitals of the chiral center. The high-energy excitation MOs are delocalized to the chiral center (see Fig. 2). This explains why the XCD signals are weak in the low-energy regime and become stronger at higher energies. For low energy excitations, the magnitudes of the XCD integrated intensities of different isomers are ordered as: p ∼ o > m. Dispersed XCD signals in the low energy regime (right column of Fig. 1) suggest the XCD intensity order o > p ≫ m, supporting the common chemical intuition on the electronic coupling strength order of different substitution positions on the benzene ring.86 The C–C single bond rotation does not considerably change the energies but can flip the sign of the XCD signal for the same core excitation. For m-CPEO, signals with opposite signs appear at very close energies, which means that the C–C bond rotation does not shift the core excitations too much, while for the o and p isomers the C–C bond rotation shifts the excitation energies more and makes the excitations more distinct. So the cancellation of the XCD signals with opposite signs is not that serious in o and p-CPEO, compared to that in m-CPEO, which makes the XCD intensities of o and p-CPEO much larger than that of m-CPEO (see the vertical axis scales of panels (f) and (g) in Fig. 1). Again, it indicates that m-CPEO has the weakest electronic coupling between the Cl atom and the chiral center. Low energy core excitations are localized and the corresponding XCD signals can detect electronic effects at different substituent positions.
| Energy regime (eV) | Integrated absolute intensity (10−40 esu2 cm2) | Strongest peak/intensity (eV/10−40 esu2 cm2) | ||||
|---|---|---|---|---|---|---|
| o-CPEO | m-CPEO | p-CPEO | o-CPEO | m-CPEO | p-CPEO | |
| 194–196 | 0.05042 | 0.04196 | 0.05420 | 194.91/−0.02990 | 194.76/0.03286 | 194.75/0.02883 |
| 196–198 | 0.1170 | 0.03514 | 0.01651 | 197.30/−0.04449 | 197.66/0.01306 | 196.76/0.005288 |
| 198–200 | 0.2664 | 0.1767 | 0.09356 | 199.91/0.1926 | 199.76/0.03341 | 199.20/0.02534 |
| 200–202 | 0.2740 | 0.1650 | 0.1426 | 200.65/0.1065 | 200.72/−0.1486 | 200.88/−0.1273 |
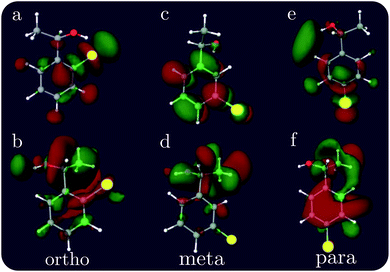 | ||
| Fig. 2 Representative particle MOs of the Cl 2p core excitations of ortho, meta and para CPEOs. The X-ray chromophore is highlighted in yellow. The energies of the excited states and the CI coefficients of the displayed MOs are (a) 194.90 eV, −0.95; (b) 199.90 eV, 0.88; (c) 194.76 eV, 0.68; (d) 200.72 eV, 0.58; (e) 194.75 eV, −0.58; and (f) 200.88 eV, 0.60. Additional relevant MOs are presented in the ESI.† | ||
For other higher energy regimes, taking the integrated and strongest peak intensities together, we find the XCD intensity to vary as o > m > p. This is because the orbitals involved in the high energy excitations are more delocalized than their low energy counterparts, and so the electronic effects of different substitution positions become less important and the corresponding XCD signals are determined by other factors such as the chiral-center-chromophore distance.
4.2 The n-chlorohexahelicene (nCHHC) series
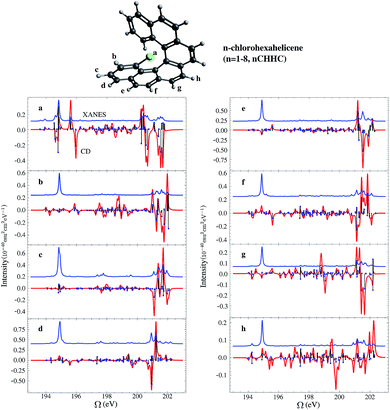
Helicenes are well-studied globally chiral molecules.87 The chirality stems from their screw-like geometry rather than a local chiral center. We have studied a family of chlorine substituted hexahelicenes. If the excitations are local, the corresponding XCD signals should be weak since they don’t probe the global structure. We expect excitations with MOs delocalized over the whole molecule to have strong XCD activity. Note that the chiral signals further depend on the magnitudes of the corresponding electric and magnetic transition dipoles.The molecular structures and the corresponding XANES and XCD signals are depicted in Fig. 3 for the right-handed (P)-hexahelicene enantiomer (CD signals for the left-handed (M) enantiomer have the opposite sign). The XCD signals vary strongly between the 8 possible Cl-substitution sites. The XANES signals of the nCHHCs do not differ appreciably until the energy becomes very high (>201 eV). Interestingly, low-energy excitations lead to significant XCD intensities only for 1CHHC (panel (a) of Fig. 3); all other molecules have strong XCD features at energies greater than 198 eV. This is confirmed by displaying the relevant MOs. Typical MOs of low- and high-energy excitations of 1CHHC and 5CHHC are shown in Fig. 4. The particle MOs of low-energy excitations in all nCHHCs are localized to the C–Cl bond (e.g., panel (c) in Fig. 4) except for 1CHHC, in which they are not localized. This explains why only 1CHHC has strong XCD features in the low energy regime. In contrast, high-energy excitations usually involve MOs delocalized over the entire molecule (e.g., panel (d) in Fig. 4), leading to strong XCD signals.
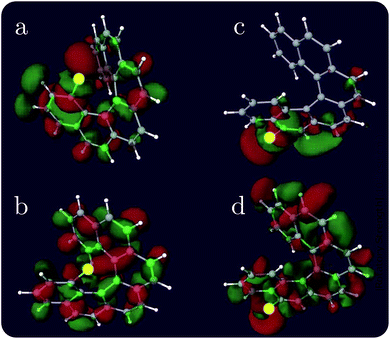 | ||
| Fig. 4 Representative particle MOs of the Cl 2p core excitations of selected nCHHCs at low and high energy excitation. The X-ray chromophore is highlighted in yellow. The excitation energy and the CI-type coefficient are, respectively: (a) 194.83 eV, 0.55; (b) 194.83 eV, 0.50; (c) 194.89 eV, −0.92; and (d) 201.53 eV, −0.59. Additional relevant MOs are presented in the ESI.† | ||
The rotatory strength, eqn (5), is given by the scalar product of the electric and magnetic transition dipoles which depends on the dipole magnitudes and their relative angle. Hence, the involvement of delocalized particle MOs is only a necessary but not a sufficient condition for a strong XCD feature. The calculated magnitudes of the electric and magnetic transition dipoles of all the studied nCHHCs as well as the angles between the two dipoles are listed in the ESI.† In general, high-energy Cl 2p excitations in the nCHHCs are delocalized and XCD can be used to provide structural information on molecules with global chirality.
4.3 The 1-bromo-n-chloronona-2,4,6,8-tetraen-1-amine (BnCTA) series
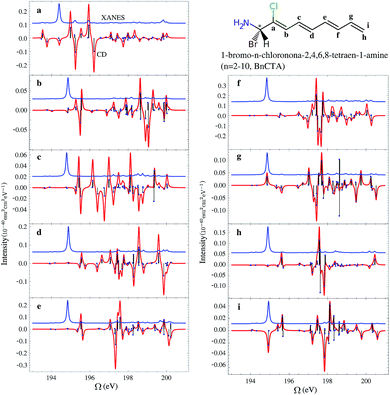
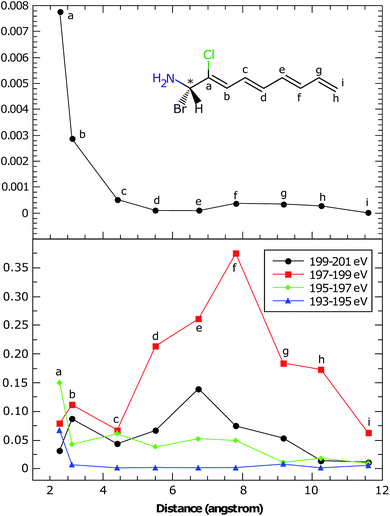
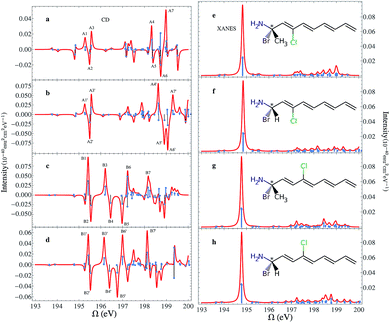
In the BnCTA molecules, a local chiral center is located at the tip of a long conjugated C–H double bond chain. The chromophore-chiral-center distance can be varied by moving the Cl substituent along the chain. Fig. 5 depicts the XANES and XCD signals. One may expect the latter to decrease with the chromophore-chiral-center distance. Indeed, the intensities in the low-energy regimes show a roughly decaying behavior with the Cl-chiral-center distance, as shown by the plots of both the individual and integrated XCD signal intensities (see Fig. 6). B2CTA, in which the Cl atom is the closest to the chiral center in the studied series, has much stronger XCD signals in the low-energy regimes (193–195 and 195–197 eV). The other BnCTAs exhibit much weaker signals in these energy regimes, and the integrated XCD intensities only show small fluctuations as the Cl-chiral-center distance increases. Again, this implies that the low-energy excitations are localized near the Cl atom. The single particle picture of an excitation becomes more ambiguous when multiple orbital pairs are involved. We have used the collective electronic oscillator (CEO)86 plots of a transition density matrix (TDM) to analyze the character of the corresponding excitations. These plots provide a real-space representation of the absolute values of the transition density matrix elements coarse-grained to various atoms (represented by indices in the plot). CEO plots of representative low energies of B2CTA (Cl is the closest to the chiral center in the series) and B10CTA (Cl is the farthest to the chiral center in the series) are shown in Fig. 7(a) and (b), respectively. We clearly see that the low-energy excitations are localized near the Cl atom and B2CTA has weak transitions between the Cl atom (index 8) and the chiral center (indices 3–5), while in B10CTA the Cl atom is too far away to affect the chiral center. This explains why B2CTA has a stronger XCD activity in the low-energy regime.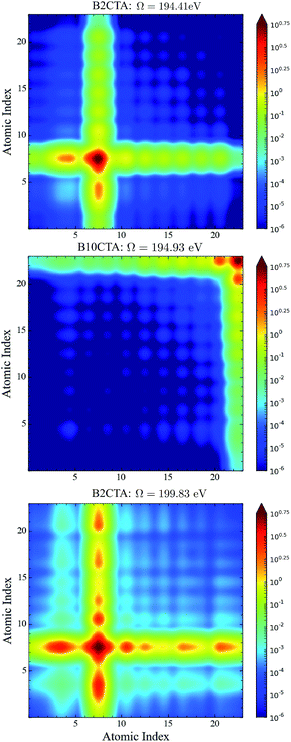 | ||
| Fig. 7 CEO plots86 of the excitation at 194.41 eV of B2CTA (top panel); the excitation at 194.93 eV of B10CTA (middle panel); and the excitation at 199.83 eV of B2CTA (bottom panel). In the top and bottom panels, the Cl atomic index is 8, and in the middle panel the Cl atomic index is 23. In all plots the chiral center atomic indices are 1–5 and all the other atomic indices are for the conjugated long chain. | ||
Fig. 7(c) shows that higher energy excitations are more delocalized along the entire chain. XCD signals at higher energies are complicated (see Fig. 5 and 6 bottom panel). Some excitations are delocalized, but have a charge-transfer-like character, which leads to very small electric transition dipoles and XCD signals (e.g., B10CTA at 200.32 eV). B9CTA has weak XCD signals in the high energy regime because of the small angles between the electric and magnetic transition dipoles (e.g. 89.85° for B9CTA at 200.46 eV). It is then difficult to interpret XCD intensities in the high-energy regimes in a simple manner. MO or CEO analysis only offer information about the transition dipole magnitudes but no direct information about the angles between those dipoles, which are determined by the molecular configuration and affect the rotatory strength. The magnitudes of the electric and magnetic transition dipoles of all BnCTAs studied as well as the angles between the two dipoles are provided in the ESI.† In summary, XCD signals in different energy regimes provide a fine description of the electronic coupling between the X-ray chromophore and the chiral center as well as clear structural information on the relative positions of the chiral center and the X-ray chromophore.
We conclude the study of this molecular series by examining the influence of different types of chiral centers. When the chiral center is changed, e.g. one –H is replaced by –CH3 in the BnCTA molecules, the XCD spectra are altered. We have modified the chiral centers in B3CTA and B4CTA as described and calculated the corresponding XCD spectra as displayed in Fig. 8. As before, the XANES spectra of all the species are very similar. The calculated XCD spectra of the original BnCTA and their modified counterparts are generally similar in shape too. One may find that peaks with similar characters shift slightly. To evaluate the effect of the chiral center variation on the XCD signals, we labeled seven major strong peaks of each species in the simulated spectra (see Fig. 8) and calculated their intensity differences. The results are shown in Table 2. Under the chiral center change, three major peaks (A2/A2′, A3/A3′ and A4/A4′) in the energy regime of 195–199 eV have significant intensity variations, while only the peak around 197 eV (B6/B6′) changes in the higher energy regime. The intensity changes of other peak pairs are very small. This comparison of B3CTA, B4CTA and their modified forms indicates that B4CTA and its modified form show more differences in the XCD spectra, which is supported by the chemical structure analysis. In B3CTA the Cl atom is located at the cis-position of the changed atom, while in B4CTA the Cl atom is at the trans-position. The cis-species are more sensitive to changes in the chiral center. This demonstrates that XCD signals can sensitively probe the relative configuration of chemical groups.
| Peak pairs | Intensity difference (10−42 esu2 cm2) |
|---|---|
| A1–A1′ | −0.08275 |
| A2–A2′ | 1.232 |
| A3–A3′ | −1.058 |
| A4–A4′ | −1.122 |
| A5–A5′ | 0.1062 |
| A6–A6′ | 0.3182 |
| A7–A7′ | 0.2312 |
| B1–B1′ | 0.6503 |
| B2–B2′ | −0.3057 |
| B3–B3′ | 0.3011 |
| B4–B4′ | −0.2624 |
| B5–B5′ | −0.1442 |
| B6–B6′ | 1.406 |
| B7–B7′ | −0.4992 |
5 Conclusions and future perspectives
We have investigated the local chirality in several families of molecules. We first considered the role of ortho, meta and para substitution in CPEO molecules and its interaction with the chiral center. We then discussed the localization of the interactions in hexahelicene for low and high energy core transitions, and also studied the decay of the chiral signal with the distance of the X-ray chromophore from the chiral center in linear BnCTA molecules. We have further shown that different chiral centers have different XCD signatures depending on the relative structures of the chemical groups.The simulation of the XCD spectra of molecules is challenging. The relevant quantity is the rotatory strength, whose magnitude depends strongly on the angle between the electric and the magnetic dipoles. This angle is sensitive to the approximations made in the computational model. In addition, XCD signals are very sensitive to the local geometry in the vicinity of the absorbing center. Simulating the XCD spectra of highly flexible molecules is far more challenging and demanding due to conformational changes and vibrational effects and their impact on rotatory strengths resulting from closely spaced states. Even though TDDFT is, in principle, an exact theory and provides a computationally affordable framework to calculate XCD spectra, as we have demonstrated in this paper, the approximate nature of the exchange–correlation functionals leaves much room for improvement and for more systematic studies of molecules in realistic dynamical environments.
The development of new sources of X-ray circularly polarized light allows us to investigate the spectroscopic and structural properties of molecules. Circular dichroism is the simplest experimental probe of chirality and is now readily achievable by various X-ray sources. For molecules with a chiral center, XCD simulations indicate that the amplitude of the signals strongly decreases with the distance between the X-ray chromophore and the chiral center if the corresponding excitations are very localized to the excited atom. For globally chiral molecules, experimental XCD signals also strongly depend on the chromophore position because of different local chemical environments. Optical CD signals have been routinely used to detect the absolute configuration of large molecules for a long time. XCD signals can reveal more detailed information about the relative configuration of different chemical groups in a molecule, thanks to the localization of the core excitations invoked by X-rays.
With the advancement of X-ray laser technology, the challenges of XCD experiments will be overcome and more experiments on complicated molecular systems such as proteins are expected. The combination of XCD with time-domain techniques such as time-resolved CD88 provides a natural link between structural and functional properties. Transient XCD spectroscopy can be further used to monitor asymmetric chemical reactions.
Acknowledgements
The support of the National Science Foundation (grant CHE-1361516) and the Chemical Sciences, Geosciences, and Biosciences division, Office of Basic Energy Sciences, Office of Science, U.S. Department of Energy through Awards No. DE-FG02-04ER15571 (S. M.) and KC030105066418 (N. G.) is gratefully acknowledged. J. R was supported by the DOE grant. J. A. acknowledges the National Science Foundation (CHE-1560881) for financial support. A portion of the research was performed using EMSL, a DOE Office of Science User Facility sponsored by the Office of Biological and Environmental Research and located at PNNL. PNNL is operated by Battelle Memorial Institute for the United States Department of Energy under DOE contract number DE-AC05-76RL1830.References
- M. Quack, J. Stohner and M. Willeke, Annu. Rev. Phys. Chem., 2008, 59, 741–769 CrossRef CAS PubMed.
- Circular Dichroism, Principles and Applications, ed. N. Berova, K. Nakanashi and R. W. Woody, Wiley-VCH, Inc., 2nd edn, 2000 Search PubMed.
- A. Lázár, J. G. Ángyán, M. Hollósi, P. Huszthy and P. R. Surján, Chirality, 2002, 14, 377–385 CrossRef PubMed.
- Y. Tang and A. E. Cohen, Phys. Rev. Lett., 2010, 104, 163901 CrossRef PubMed.
- J. R. Rouxel, V. Y. Chernyak and S. Mukamel, Chem. Sci., 2016, 7, 6824–6831 RSC.
- J. Goulon, A. Rogalev and C. Brouder, in Comprehensive Chiroptical Spectroscopy, Volume 1, Instrumentation, Methodologies, and Theoretical Simulations, ed. N. Berova, P. L. Polavarapu, K. Nakanishi and R. W. Woody, John Wiley & Sons, Inc., 2012, ch. 17, pp. 457–491 Search PubMed.
- G. van der Laan and A. I. Figueroa, Coord. Chem. Rev., 2014, 277–278, 95–129 CrossRef CAS.
- A. Rogalev, K. Ollefs and F. Wilhelm, in X-Ray Absorption and X-Ray Emission Spectroscopy: Theory and Applications, ed. J. A. Van Bokhoven and C. Lamberti, Wiley-Blackwell, 2016, ch. 22, pp. 671–694 Search PubMed.
- L. D. Barron, Molecular Light Scattering and Optical Activity, Cambridge University Press, New York, 2nd edn, 2009 Search PubMed.
- J. Stöhr, Y. Wu, B. Hermsmeier, M. Samant, G. Harp, S. Koranda, D. Dunham and B. Tonner, Science, 1993, 259, 658 Search PubMed.
- Y. Ding, Z. Huang, D. Ratner, P. Bucksbaum and H. Merdji, Phys. Rev. Spec. Top.–Accel. Beams, 2009, 12, 060703 CrossRef.
- M. Chini, K. Zhao and Z. Chang, Nat. Photonics, 2014, 8, 178 CrossRef CAS.
- J. D. Biggs, Y. Zhang, D. Healion and S. Mukamel, J. Chem. Phys., 2012, 136, 174117 CrossRef PubMed.
- Y. Zhang, J. D. Biggs and S. Mukamel, J. Mod. Opt., 2014, 61, 558–567 CrossRef CAS PubMed.
- S.-K. Son, H. N. Chapman and R. Santra, J. Phys. B: At., Mol. Opt. Phys., 2013, 46, 164015 CrossRef.
- K. Tamasaku, E. Shigemasa, Y. Inubushi, T. Katayama, K. Sawada, H. Yumoto, H. Ohashi, H. Mimura, M. Yabashi, K. Yamauchi and T. Ishikawa, Nat. Photonics, 2014, 8, 313 CrossRef CAS.
- S. Ghimire, A. D. DiChiara, E. Sistrunk, P. Agostini, L. F. DiMauro and D. A. Reis, Nat. Phys., 2011, 7, 138–141 CrossRef CAS.
- C. Hernández-García, C. G. Durfee, D. D. Hickstein, T. Popmintchev, A. Meier, M. M. Murnane, H. C. Kapteyn, I. J. Sola, A. Jaron-Becker and A. Becker, Phys. Rev. A, 2016, 93, 043855 CrossRef.
- P. Elleaume, J. Synchrotron Radiat., 1994, 1, 19–26 CrossRef CAS PubMed.
- S. Sasaki, Nucl. Instrum. Methods Phys. Res., Sect. A, 1994, 347, 83–86 CrossRef.
- J. Goulon, C. Goulon-Ginet, A. Rogalev, V. Gotte, C. Malgrange, C. Brouder and C. R. Natoli, J. Chem. Phys., 1998, 108, 6394–6403 CrossRef CAS.
- L. Alagna, T. Prosperi, S. Turchini, J. Goulon, A. Rogalev, C. Goulon-Ginet, C. R. Natoli, R. D. Peacock and B. Stewart, Phys. Rev. Lett., 1998, 80, 4799–4802 CrossRef CAS.
- B. Stewart, R. D. Peacock, L. Alagna, T. Prosperi, S. Turchini, J. Goulon, A. Rogalev and C. Goulon-Ginet, J. Am. Chem. Soc., 1999, 121, 10233–10234 CrossRef CAS.
- D. J. Higley, K. Hirsch, G. L. Dakovski, E. Jal, E. Yuan, T. Liu, A. A. Lutman, J. P. MacArthur, E. Arenholz and Z. Chen, et al. , Rev. Sci. Instrum., 2016, 87, 033110 CrossRef PubMed.
- T. Fan, P. Grychtol, R. Knut, C. Hernández-García, D. D. Hickstein, D. Zusin, C. Gentry, F. J. Dollar, C. A. Mancuso, C. W. Hogle, O. Kfir, D. Legut, K. Carva, J. L. Ellis, K. M. Dorney, C. Chen, O. G. Shpyrko, E. E. Fullerton, O. Cohen, P. M. Oppeneer, D. B. MiloÅąeviÄĞ, A. Becker, A. A. JaroÅĎ-Becker, T. Popmintchev, M. M. Murnane and H. C. Kapteyn, Proc. Natl. Acad. Sci. U. S. A., 2015, 112, 14206–14211 CrossRef CAS PubMed.
- S. Turchini, N. Zema, S. Zennaro, L. Alagna, B. Stewart, R. D. Peacock and T. Prosperi, J. Am. Chem. Soc., 2004, 126, 4532–4533 CrossRef CAS PubMed.
- M. Tanaka, K. Nakagawa, A. Agui, K. Fujii and A. Yokoya, Phys. Scr., 2005, 115, 873–876 CrossRef.
- M. Pecul and W. Dzwolak in Optical Spectroscopy and Computational Methods in Biology and Medicine, ed. M. Baranska, Springer Nature, 2014, pp. 161–177 Search PubMed.
- H. Rhee, Y.-G. June, J.-S. Lee, K.-K. Lee, J.-H. Ha, Z. H. Kim, S.-J. Jeon and M. Cho, Nature, 2009, 458, 310–313 CrossRef CAS PubMed.
- E. Runge and E. K. U. Gross, Phys. Rev. Lett., 1984, 52, 997–1000 CrossRef CAS.
- C. A. Ullrich, Time-Dependent Density-Functional Theory: Concepts and Applications, Oxford University Press, New York, 2012 Search PubMed.
- M. Stener, G. Fronzoni and M. de Simone, Chem. Phys. Lett., 2003, 373, 115–123 CrossRef CAS.
- N. A. Besley and A. Noble, J. Phys. Chem. C, 2007, 111, 3333–3340 CAS.
- S. DeBeer-George, T. Petrenko and F. Neese, Inorg. Chim. Acta, 2008, 361, 965–972 CrossRef CAS.
- W. Liang, S. A. Fischer, M. J. Frisch and X. Li, J. Chem. Theory Comput., 2011, 7, 3540–3547 CrossRef CAS PubMed.
- K. Lopata, B. E. V. Kuiken, M. Khalil and N. Govind, J. Chem. Theory Comput., 2012, 8, 3284–3292 CrossRef CAS PubMed.
- Y. Zhang, J. D. Biggs, D. Healion, N. Govind and S. Mukamel, J. Chem. Phys., 2012, 137, 194306 CrossRef PubMed.
- D. P. Craig and T. Thirunamachandran in Molecular Quantum Electrodynamics, Dover Publications, 1998, ch. 8, pp. 188–189 Search PubMed.
- J. Autschbach, Chirality, 2009, 21, E116–E152 CrossRef CAS PubMed.
- I. Eom, S.-H. Ahn, H. Rhee and M. Cho, Phys. Rev. Lett., 2012, 108, 103901 CrossRef PubMed.
- A. Gonis and W. H. Butler, Multiple Scattering in Solids, Springer New York, 2000 Search PubMed.
- J. J. Rehr, J. J. Kas, F. D. Vila, M. P. Prange and K. Jorissen, Phys. Chem. Chem. Phys., 2010, 12, 5503–5513 RSC.
- O. Bunău and Y. Joly, J. Phys.: Condens. Matter, 2009, 21, 345501 CrossRef PubMed.
- V. Kimberg and N. Kosugi, J. Chem. Phys., 2007, 126, 245101 CrossRef PubMed.
- W. J. Hunt and W. A. Goddard, Chem. Phys. Lett., 1969, 3, 414–418 CrossRef CAS.
- H. Ågren, V. Carravetta, O. Vahtras and L. G. Pettersson, Chem. Phys. Lett., 1994, 222, 75–81 CrossRef.
- H. Ågren, V. Carravetta, O. Vahtras and L. G. M. Pettersson, Theor. Chem. Acc., 1997, 97, 14–40 CrossRef.
- P. L. Altick and A. E. Glassgold, Phys. Rev., 1964, 133, A632–A646 CrossRef.
- M. Stener, A. Lisini and P. Decleva, Chem. Phys., 1995, 191, 141–154 CrossRef CAS.
- L. Triguero, L. G. M. Pettersson and H. Ågren, Phys. Rev. B: Condens. Matter Mater. Phys., 1998, 58, 8097–8110 CrossRef CAS.
- O. Takahashi, M. Kimoto and L. G. Pettersson, Chem. Phys., 2015, 450–451, 109–114 CrossRef CAS.
- V. Carravetta, O. Plachkevytch, O. Vahtras and H. Ågren, Chem. Phys. Lett., 1997, 275, 70–78 CrossRef CAS.
- O. Vahtras, H. Ågren and V. Carravetta, J. Phys. B: At., Mol. Opt. Phys., 1997, 30, 1493–1501 CrossRef CAS.
- O. Plashkevych, V. Carravetta, O. Vahtras and H. Ågren, Chem. Phys., 1998, 232, 49–62 CrossRef CAS.
- L. Alagna, S. D. Fonzo, T. Prosperi, S. Turchini, P. Lazzeretti, M. Malagoli, R. Zanasi, C. Natoli and P. Stephens, Chem. Phys. Lett., 1994, 223, 402–410 CrossRef.
- P. Norman, D. M. Bishop, H. J. A. Jensen and J. Oddershede, J. Chem. Phys., 2001, 115, 10323 CrossRef CAS.
- P. Norman, D. M. Bishop, H. J. A. Jensen and J. Oddershede, J. Chem. Phys., 2005, 123, 194103 CrossRef PubMed.
- U. Ekström, P. Norman, V. Carravetta and H. Ågren, Phys. Rev. Lett., 2006, 97, 143001 CrossRef PubMed.
- A. Jiemchooroj, U. Ekström and P. Norman, J. Chem. Phys., 2007, 127, 165104 CrossRef PubMed.
- A. Jiemchooroj and P. Norman, J. Chem. Phys., 2008, 128, 234304 CrossRef PubMed.
- S. Villaume and P. Norman, Chirality, 2009, 21, E13–E19 CrossRef CAS PubMed.
- J. Kauczor and P. Norman, J. Chem. Theory Comput., 2014, 10, 2449–2455 CrossRef CAS PubMed.
- L. Jensen, J. Autschbach and G. C. Schatz, J. Chem. Phys., 2005, 122, 224115 CrossRef CAS PubMed.
- J. Autschbach, Comput. Lett., 2007, 3, 131–150 CrossRef CAS.
- K. Yabana and G. F. Bertsch, Phys. Rev. A, 1999, 60, 1271–1279 CrossRef CAS.
- K. Lopata and N. Govind, J. Chem. Theory Comput., 2011, 7, 1344–1355 CrossRef CAS PubMed.
- S. Tussupbayev, N. Govind, K. Lopata and C. J. Cramer, J. Chem. Theory Comput., 2015, 11, 1102–1109 CrossRef CAS PubMed.
- J. J. Goings and X. Li, J. Chem. Phys., 2016, 144, 234102 CrossRef PubMed.
- J. Autschbach and T. Ziegler, J. Chem. Phys., 2002, 116, 891–896 CrossRef CAS.
- J. Autschbach, T. Ziegler, S. J. A. van Gisbergen and E. J. Baerends, J. Chem. Phys., 2002, 116, 6930–6940 CrossRef CAS.
- J. Autschbach, ChemPhysChem, 2011, 12, 3224–3235 CrossRef CAS PubMed.
- M. Valiev, E. Bylaska, N. Govind, K. Kowalski, T. Straatsma, H. V. Dam, D. Wang, J. Nieplocha, E. Apra, T. Windus and W. de Jong, Comput. Phys. Commun., 2010, 181, 1477–1489 CrossRef CAS.
- I. Tamm, J. Phys., 1945, 9, 449–460 Search PubMed.
- S. M. Dancoff, Phys. Rev., 1950, 78, 382–385 CrossRef.
- S. Hirata and M. Head-Gordon, Chem. Phys. Lett., 1999, 314, 291–299 CrossRef CAS.
- A. D. Becke, J. Chem. Phys., 1993, 98, 5648–5652 CrossRef CAS.
- P. J. Stephens, F. J. Devlin, C. F. Chabalowski and M. J. Frisch, J. Phys. Chem., 1994, 98, 11623–11627 CrossRef CAS.
- T. H. Dunning, J. Chem. Phys., 1989, 90, 1007–1023 CrossRef CAS.
- D. E. Woon and T. H. Dunning, J. Chem. Phys., 1993, 98, 1358–1371 CrossRef CAS.
- A. K. Wilson, D. E. Woon, K. A. Peterson and T. H. Dunning, J. Chem. Phys., 1999, 110, 7667–7676 CrossRef CAS.
- R. Krishnan, J. S. Binkley, R. Seeger and J. A. Pople, J. Chem. Phys., 1980, 72, 650–654 CrossRef CAS.
- A. D. McLean and G. S. Chandler, J. Chem. Phys., 1980, 72, 5639–5648 CrossRef CAS.
- J.-M. Chen, R. Klauser, S.-C. Yang and C.-R. Wen, Chem. Phys. Lett., 1995, 246, 285–290 CrossRef CAS.
- T. Fransson, D. Burdakova and P. Norman, Phys. Chem. Chem. Phys., 2016, 18, 13591–13603 RSC.
- G. H. Zschornack, Handbook of X-Ray Data, SprinSpr-Verlag, Berlin, Heidelberg, New York, 2007 Search PubMed.
- S. Tretiak and S. Mukamel, Chem. Rev., 2002, 102, 3171–3212 CrossRef CAS PubMed.
- C.-F. Chen and Y. Shen, Helicene Chemistry: From Synthesis to Applications, Springer-Verlag, Berlin, Heidelberg, 2017 Search PubMed.
- J. R. Rouxel, M. Kowalewski and S. Mukamel, Struct. Dyn., 2017, 4, 044006 CrossRef PubMed.
Footnotes |
| † Electronic supplementary information (ESI) available: Molecular coordinates, more relevant molecular orbital plots and detailed calculation results. See DOI: 10.1039/c7sc01347g |
| ‡ These authors contributed equally to this work. |
| This journal is © The Royal Society of Chemistry 2017 |

