A quantitative method to determine preservice chemistry teachers' perceptions of chemical representations
M. L.
Head
 *,
K.
Yoder
,
E.
Genton
and
J.
Sumperl
Department of Chemistry and Biochemistry, Kennesaw State University, Kennesaw, GA, USA. E-mail: mdean28@kennesaw.edu
First published on 26th July 2017
Abstract
Chemical representations serve as a cornerstone to guide the teaching of chemistry concepts. The influence that a chemical representation has on instruction is largely dependent on how well the viewer interprets the information in the representation. Teachers serve as a guide to the students as they point out and make connections between the features present in a chemical representation. To influence how well the teacher serves as a guide it is important to develop teachers' pedagogical content knowledge as it relates to visualizations. As a first step towards developing this area of teaching expertise it is crucial to develop an understanding of how preservice chemistry teachers perceive a variety of chemical representations. To this end, this paper presents a novel card-sorting methodology that utilizes Johnstone's triangle as a continuum to determine how chemistry preservice teachers perceive representations relative to the presence of each of the three representational levels: macroscopic, submicroscopic, and symbolic. This study has determined that this methodology is both valid and reliable among a group of chemistry preservice teachers. The participants were able to effectively detect the presence or absence of the macroscopic domain. However, there was greater variance when the symbolic and submicroscopic levels were present. In addition, variance among the participants’ responses also increased dramatically when multiple levels were present in one representation. This was largely a result of what key features the participant focused on while viewing the card. The variance results of this study, along with the accompanying rationales for the placement of the cards, serve to inform the development of practices to further foster preservice chemistry teachers’ pedagogical-visual-content-knowledge (PVCK).
Introduction
Chemical representations are the pictures that tell the story of chemistry. It is very uncommon to open a chemistry textbook to a page that is void of a chemical representation. In the absence of a representation, it may be difficult for the reader to develop an accurate mental model, or internal representation, based solely on a text description of abstract chemical information. Over time historical models, or representations, have been developed and refined to convey abstract information regarding a chemical system (Gilbert, 2004). Therefore, among a variety of chemistry textbooks, one will find a large number of similar chemical representations, or models, that experts have agreed best represent a particular chemical phenomenon. These chemical representations serve as a basis for the constructed internal representation and aid to solidify a student's understanding of a topic (Mayer et al., 1995; Papageorgiou et al., 2017).Schnotz (2002) summarizes the importance that visual representations have in a textbook stating that they “…cannot only have a decorative function, but also have functions of representation, organization, interpretation, and mnemonic encoding.” Textbooks provide a rich source of high quality chemical representations that may be used to guide classroom instruction. Although the images may be of high quality, they do not directly translate to high quality instruction or the development of accurate internal representations. It has previously been shown that textbook representations may be a source of student misconceptions (Myers, 1992; Tulip and Cook, 1993; Mayer et al., 1995). In addition, it has also been determined that language-mastery strongly influences students’ abilities to understand science textbooks (Davies and Greene, 1984; Fang, 2006). Both language, whether it be verbal or written, and visualizations serve as two of the primary communication tools used in science instruction (Mammino, 2014). Therefore, it is important that teachers have well-developed pedagogical-visual-content-knowledge (PVCK) as they make choices with regards to representation selection and planning the accompanying verbiage that will be used to introduce the representations (Eilam, 2012). Ensuring that teachers are aware of difficulties associated with a variety of representational types is important so that introducing misconceptions, or further supporting existing misconceptions, may be avoided. Although the importance of the development of PVCK has recently become a focus of research, it is still recognized that further research in this area needs to be conducted to determine how to best develop this area of teacher expertise (Prain and Waldrip, 2006; Prain and Waldrip, 2008; Cook, 2011; Gilbert and Eilam, 2014). To determine the best practices for developing PVCK among chemistry teachers, and quite possibly the further development of visual literacy as a precursor to PVCK, it is important to first gain an understanding of how teachers perceive a variety of chemical representations, both with regards to Johnstone's level of chemical representation, and also the various representational types (i.e. equations versus graphs in the symbolic domain).
Theoretical background
Johnstone proposed that a well-developed understanding of chemistry concepts requires multiple levels of thought. He described that visual representations used in chemistry exist at three levels: macroscopic, submicroscopic, and symbolic (Johnstone, 1991). The macroscopic domain is described as those things that are tangible and visible. Submicroscopic, often synonymous with particulate, depicts atoms, molecules, ions, or chemical structures, while the symbolic level includes representations that use characters (letters, numbers, and symbols) to represent relationships among chemical phenomena (Johnstone, 2000). More than one representational domain may be present within the same visual; multiple domains may be shown as a multiple representation, where each domain present occupies its own space within the visual, or as a hybrid, where different domains are situated overlaying each other, such as water molecules shown in a beaker (Gkitzia et al., 2011).Johnstone described that each representational level be positioned at the three points of a triangle. He used the depiction of a triangle to describe that the teaching practices often employed in a chemistry classroom take place within the triangle as opposed to at just one apex of the triangle or along one edge. He also pointed out that experts move across this triad from one representational domain to another fluently, while the novice may get stuck making sense of a representation, or surface features, at one level (Johnstone, 1991). With this in mind, instructors must carefully craft how the multiple levels of representations are presented to students so that the learners may bridge and see the connections between the different domains of chemical representations. This bridge of course can only be formed when the teacher is aware of the connections between each domain. This awareness will allow the teacher to carefully select chemical representations and scaffold the presentation appropriately to allow the students to construct an appropriate internal representation. By doing so, students will best be able to understand the relationships between the symbolic, submicroscopic, and/or macroscopic domains.
Johnstone's triangle may serve as an appropriate framework to develop PVCK among chemistry teachers (Gilbert and Eilam, 2014). In fact, the language used by Johnstone has become more common among high school chemistry classrooms due to the introduction of A Framework for K-12 Science Education (National Research Council, 2012). This document explicitly calls on students to engage in science practices that are directly associated with visual literacy, such as developing and utilizing models, analysing and interpreting data, and obtaining, evaluating and communicating information. The crosscutting concepts also address a central tenet of visual literacy-scale, proportion, and quantity. As a result of the development of the Framework many states have either adopted the Next Generation Science Standards, a national set of standards that align to the Framework, or have developed custom state standards that address many of the key points made by the Framework.
Due to the increasing prevalence of model-based instruction and student-generated modelling tasks in the chemistry classroom, the language that Johnstone has introduced is now frequently used in chemistry instruction. Therefore, it is important that both teachers and students have a clear understanding of what constitutes each representational domain. This knowledge will allow the teacher to clearly articulate instructional prompts while also allowing students to best understand the expectations of what the teacher has conveyed. With the increased focus on model-based instruction, classroom activities have been developed to address this area of science education. Specifically, one published classroom activity has been designed to enhance student understanding of the language around modelling in chemistry (Edwards and Head, 2016).
Similar to the purpose of a pre-test that might be given to students, it is important to evaluate how preservice chemistry teachers perceive chemical representations. This evaluation will provide a basis that will inform how instruction should be designed to further develop PVCK among chemistry teachers. This exploratory study is guided by the theoretical framework of phenomenography, where an investigation is conducted to determine how various phenomena, concepts, or principles are understood by people. Specifically, this theoretical framework is focused on the content of the thoughts that aid in a person's perception of conceptualization of the world (Marton, 1986). The Personal Construct Theory may be considered a more specific type of phenomenography (Kelly, 1977). This theory states that how people respond to an event or information is based on how they categorize the world around them. These categories, or constructs, exist any time someone is giving attention to an object and trying to make sense of it.
A characteristic methodology of the Personal Construct Theory is card sort tasks. Card sort tasks in the science education literature have primarily been used to reveal differences among how experts and novices perceive scientific word problems and conceptual information (Chi et al., 1981; Kozma and Russell, 1997; Smith et al., 2013; Krieter et al., 2016). Evidence suggests that sorting a set of cards is an external representation of a person's internal understanding of the construct (McGeorge and Rugg, 1992). Card sorts may be framed, i.e. bound by predetermined categories, or unframed, i.e. categories are determined by the participant (Smith et al., 2013). An example of a framed card sort is the “All in One” sort. The participants engaged in this type of sort are asked to evaluate a set of cards and place them on a matrix, often a Cartesian axis (Rugg and McGeorge, 1997). This type of sorting activity allows a researcher to examine similarities and differences among the placement of the cards along with examination of the underlying factors for the placement of the set of cards on such a continuum.
Considering this overall goal and the underlying theoretical framework, this study seeks to answer the following research questions:
(1) Can a framed card-sorting task that utilizes Johnstone's triangle as a continuum for sorting chemical representations based on the levels of representation present be a valid and reliable method for understanding how preservice chemistry teachers perceive a variety of chemical representations?
(2) What can the card-sorting task tell us about how preservice chemistry teachers perceive chemical representations?
Methods
The exploratory study follows all guidelines approved by the University's Institutional Review Board (IRB) and invited preservice chemistry teachers (N = 10) who were enrolled in a chemistry teaching methods course during the last year of their degree program to participate. Of the population that was invited, all the participants would earn, or had earned an undergraduate degree in chemistry. This study took place in a class where the instructor was not the researcher. However, the classroom instructor and the researchers collaborated to develop a classroom activity that would also serve as a data collection method. Students were invited to participate at the onset of the instruction on visual literacy and chemical representations. Prior to the start of data collection, the participants were asked to read an article by Johnstone that highlighted information processing and the multiple levels of chemical representations (Johnstone, 1993). Following this, in class the preservice teachers were presented with a set of 26 cards containing chemical representations from a popular general chemistry textbook (Burdge, 2014). The participants were also provided with a worksheet containing an equilateral triangle, where each vertex was labelled with one of Johnstone's chemical representation domains: macroscopic, submicroscopic, or symbolic. The preservice teachers were first asked to define each of the representational domains in their own words. They were then asked to use the triangle as a continuum, much like Johnstone described the teaching of chemistry (Johnstone, 1991), and to rank the cards based on the relative level that each chemical representation domain was present in the card. This method is similar to how a ternary phase diagram would be interpreted. To represent the placement of the cards, the participants drew a dot on the triangle and labelled it with the letter of the card. Providing the participants with all 26 cards at the beginning allowed them to compare and contrast the representations. If the participant perceived multiple cards as equivalent, they were instructed to place one dot on the triangle and label it with the respective letters.Prior to beginning the ranking process, the instructor provided examples on how to use the continuum by placing the worksheet on the board for the class to view. Two examples were reviewed and it was shown how the cards should be identified on the worksheet. First, it was explained that if a card included all representational levels equally it should be placed in the center of the triangle (Point A in Fig. 1) where it was equidistant from each vertex of the triangle. The second example used was a description of a representation that only included symbolic and macroscopic levels equally, or 50% of each domain. It was explained that a dot should be placed along the middle of that corresponding edge of the triangle (Point B in Fig. 1) so that it was equidistant from the symbolic and macroscopic vertex, but not removed from the line since this would then represent that it also contained a portion of the submicroscopic domain. Following these two examples, the instructor provided a third example, a card that was 70% submicroscopic, and 15% in both the symbolic and macroscopic domains, and asked the class to consider where the card should be placed on the continuum. Once the participants each considered the placement of this last card, the class came to a consensus that this type of card would be best represented as Point C of Fig. 1. As the instructor went through this exercise, representations were only discussed using a description of the relative percentages of each domain present in order to avoid influencing how the participants may place the cards used in this study.
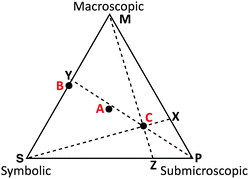 | ||
| Fig. 1 Sample continuum and measurements that were collected to determine the percent of each representational domain present on a card. | ||
The set of cards that was provided contained carefully chosen chemical representations. At least one card from each single representational level or a combination of two or three representational domains was chosen. However, often more representations were selected to acknowledge differences that occur in each domain. For example, both a graph and an equation may be considered symbolic, yet each may be thought about differently by the viewer. In some cases very similar representations were also selected to allow internal consistency to be established for this methodology. Although, the chemical representations are not included in this paper for copyright reasons, the descriptions of the complete set are included in Appendix 1.
The ranking of the cards was analysed using an intersection method to interpret the ternary plot (Stover, 2017). Card C in Fig. 1 will be used to discuss this method. The intersection method draws a ray from each vertex of the triangle through the point designating each card, as shown for lines MZ, SX, and PY in Fig. 1. To obtain the percentage of each domain present, the line segment was measured from the point representing the card to the opposite side of the triangle. For example, the length of CX was measured to determine the value for the symbolic domain. This length was then divided by the entire length of the line segment from the symbolic vertex of the triangle to the opposite edge of the triangle (SX). This calculation is summarized in eqn (1). Similar measurements and calculations (eqn (2) and (3)) were performed for the macroscopic and submicroscopic domains. All three equations, % symbolic, % submicroscopic, and % macroscopic, totalled to 100 ± 0.05.
 | (1) |
 | (2) |
 | (3) |
Following this card sorting activity, each participant was invited to participate in an interview with a researcher, where they were asked to explain their placement of at least three cards on the continuum. This interview further helped to validate the placement of the participant's cards and sought to gain an understanding of what component(s) of each card corresponded to each domain, according to the placement of that card. The interviews were transcribed and coded to determine common reasons for the placement of each card in question. Initially, the rationales provided by the participants were deductively coded based on the representational domains (macroscopic, submicroscopic, and symbolic) that were stated to be present on the card of interest. The reason for the placement was then inductively coded using an open coding method. The set of codes that emerged was then used by a second coder to recode each interview in its entirety. Due to a low interrater reliability (Cohen's κ > 0.5) the coders met to discuss the definitions of each code, and subsequently, each recoded the rationales that had low agreement. The final codebook and example of the coded transcript can be found in Appendix 2.
One participant, S9, was excluded from the data set since the definitions that this person provided for the particulate and symbolic domains were reversed. Therefore, it was believed that the cards might have also been reversed as well. However, due to uncertainty that arose during the interview process this person was removed from the data set completely.
Establishing validity and reliability among the methods
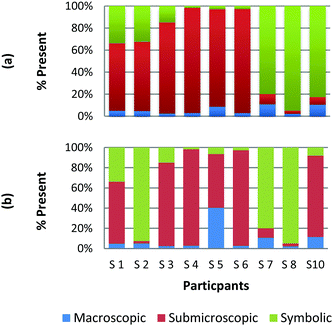
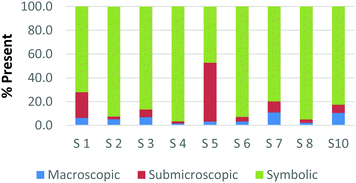
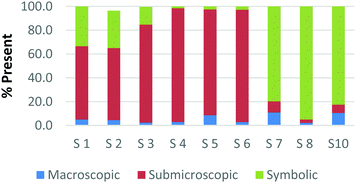
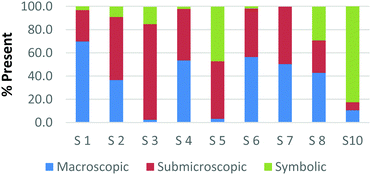
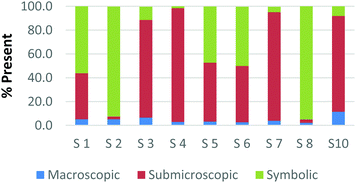
To create a frame of reference for the discussion of the study results, two chemical education experts identified the representation domains present in each card relative to the description of each domain provided by Johnstone (2000) and the more elaborate description provided by Gkitzia et al. (2011). The experts also determined whether the cards could be considered nearly identical based on the features of the representation, e.g. both are symbolic and show a mathematical expression. Identifying pairs of cards that were similar in nature allowed the researchers to establish internal consistency among the participants' responses. Fig. 2a and b shows the responses of two cards that could be considered purely symbolic in nature: one containing a general rate equation and the other containing the formula to calculate pH from the hydrogen ion concentration. Due to the small sample size and continuous nature of the variable, a correlation coefficient was used to compare the placement of the two cards. In the case of these two equations, it was found that there is a perfect relationship between the two cards in all representational domains (r = 1.0) that were present or absent. Table 1 provides the correlation coefficients for each pair of representations that were deemed identical. All correlation coefficients were found to be significant, p < 0.05. One outlier, a different subject in each case, was removed from the macroscopic and submicroscopic comparisons. As revealed later in the Results and discussion section, the participants noticed different features of the representation and therefore may not perceive the representations as identical. Based on this notion it was reasonable to exclude these cases.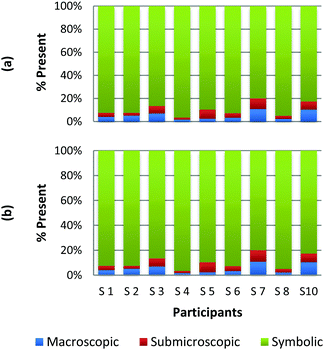 | ||
| Fig. 2 Preservice chemistry teacher perception of the representational domains present in two symbolic cards; (a) rate = k[A]a[B]b and (b) pH = −log[H+]. | ||
| Representational domain | Card description | Correlation coefficienta (r) | ||
|---|---|---|---|---|
| Symbolic | Submicroscopic | Macroscopic | ||
| a All correlation coefficients that are listed are significant, p < 0.05. | ||||
| Symbolic | Card H: rate = k[A]a[B]b | 1.00 | 1.00 | 1.00 |
| Card K: pH = −log[H+] | ||||
| Macroscopic | Card B: paper chromatography set-up | 1.00 | 1.00 | 1.00 |
| Card F: two watch glasses, one containing a white powder and the other containing a blue powder (p. 67) | ||||
| Submicroscopic | Card A: ball-and-stick water molecule and space-filling water molecule (p. 5b,c only) | 0.656 | 0.624 | 0.996 |
| Card G: chemical equation of carbon monoxide reacting with hydrogen to form methanol depicted using space-filling molecules (p. 101) | ||||
| Macroscopic and submicroscopic | Card T: multiple representations of household products with callout bubbles that contain molecule in each product (p. 136) | 0.701 | 0.757 | 0.828 |
| Card X: multiple representations of two Erlenmeyer flasks containing different concentrations of iodine with a callout bubble containing the submicroscopic representation of each (p. 150) | ||||
As observed, there is perfect internal consistency for representations that contain only the symbolic or macroscopic domains. However, variation among the participant's responses arises when the submicroscopic domain is present. Among the cards containing only the submicroscopic domain, all the participants are in near agreement that the macroscopic level is absent and therefore high internal consistency was found. However, it appears that the participants struggle to classify the submicroscopic feature as such or as symbolic. A similar trend is also observed among the multiple representations that contained both the macroscopic and submicroscopic domains.
Overall it can be concluded that there is high internal consistency among this methodology when the participants are asked to rank representations that contain the symbolic or macroscopic domains. However, internal consistency decreases, although still considered moderate to strong, when the submicroscopic domain is present or multiple levels containing the submicroscopic domain are present. The difficulty that the submicroscopic level presents when classifying chemical representations will be further discussed below in the Results and discussion section.
Participant interviews were conducted to further establish validity and reliability among the methods used. Near perfect agreement (Cohen's κ = 0.88–1.00) between the two coders was found once the coders had reviewed the definition of each code that was used. Following this level of agreement, it was determined how frequently the provided rationale was consistent with the placement of a card. It was found that only four descriptions for the placement of the cards (8.7% of the cards described) did not correspond to where the participant had identified them on the continuum. This demonstrates that the participants understood how to use the ranking methodology as well as had an understanding of the meaning for each representational domain that was consistent with the researchers.
Results and discussion
Twenty-six total chemical representations were investigated in the present study. The results described below focus on 11 representations that provide evidence for the major results and conclusions drawn from this study. The researchers felt that the 11 representations included additional information from the interview that helped to further support that participant's rankings. The participants' ranking of all cards has been provided in Appendix 1. Note that the results are presented relative to an expert’s classification of the set of cards based on the presence or absence of a domain.Single domain representations
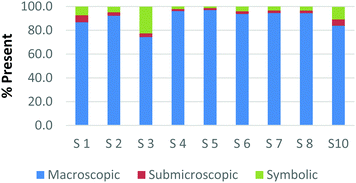
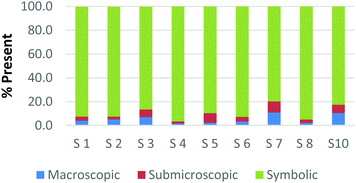
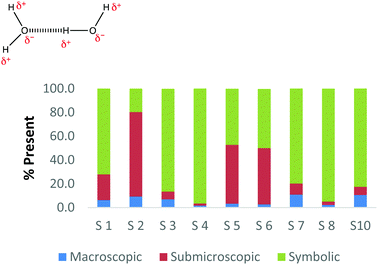
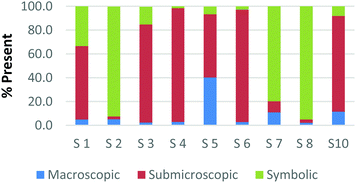
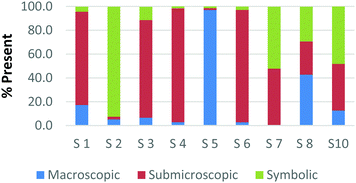
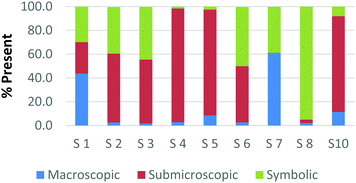
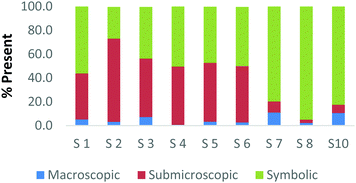
The method employed in this study demonstrates that the participants may perceive representations that are classified with one domain in a variety of ways. For example, Fig. 2a and b and 3a and b display the results of how the participants perceived four purely symbolic representations: the general rate equation, equation to calculate pH, hydrogen bonding among water molecules where elemental symbols are utilized to represent the atoms, and a phase diagram of water (Fig. 2a, b and 3a, b, respectively) (Burdge, 2014, p. 507). It is very clear from Fig. 2a and b that all the participants agree that a mathematical equation is considered symbolic. However, a third of the preservice teachers felt that the hydrogen bonding representation (Fig. 3a) could be considered both symbolic and submicroscopic in nature despite the absence of atoms, or particles. However, this result may demonstrate that these teachers are able to make the connections between the symbolism shown and the particles that are implied or merely have considered the elemental symbols are the atoms. This is often cited as a difficult task for students to do, however certainly a skill that is important for preservice teachers to build among their chemistry students (Bucat and Mocerino, 2009).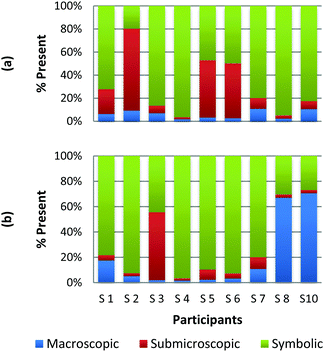 | ||
| Fig. 3 Preservice chemistry teacher perception of cards containing symbolic representations; hydrogen bonding (a) and a phase diagram of water (b). | ||
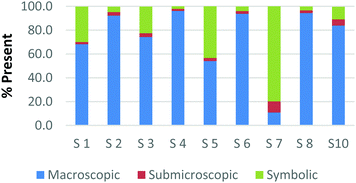
Similarly, the participants are observed making connections beyond the representation as they ranked the card containing the phase diagram of water. In Fig. 3b, it can be seen that two participants rank this card as largely (>65%) macroscopic in nature. In the discussion that took place during the class period, these participants explained this placement due to the fact that phase changes can be observed at the macroscopic level, i.e. as ice melts to form liquid water. One teacher felt this representation was about 50% particulate in nature. S3 described this connection beyond what was explicitly displayed in the representation by stating,
“This one…this one I was kind of…this one I was not entirely sure. In looking back I would have probably moved it over to the symbolic representation. But I think the reason I might have kept it in the middle [of symbolic and particulate] and not changed it was because of how….of how the structure of solids, liquids and vapors change at the particulate level. And the symbolic part of that would come from the fact that this is a chart or a graph that actually shows data.”
Among the preservice teachers interviewed about the phase diagram card, none of them commented on the actual features of the graph, such as how conditions of pressure and temperature relate to the phase that is observed. Therefore, although the participants were observed extending the perception of the representations beyond the symbolic level; they based their rationale on the surface features of solid, liquid, and gas rather than, for example, the fact that water can be vaporized at different temperature/pressure combinations. This attention to surface features among visual representations in a variety of science subjects has been well-noted in the literature among novice learners, and even graduate students in some cases (Chi et al., 1981; Weiser and Shertz, 1983; Hardiman et al., 1989; Kozma and Russell, 1997; Bhattacharyya and Bodner, 2005; Patrick et al., 2005; Stains and Talanquer, 2008). Therefore, it is important to consider how science teacher preparation may train teachers to not only notice features beyond the surface that are instrumental to understanding the concept, but also convey their importance to their students so that a better understanding of a representation is developed.
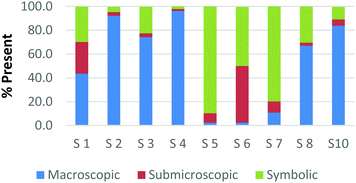
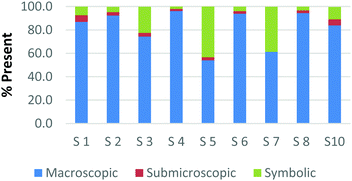
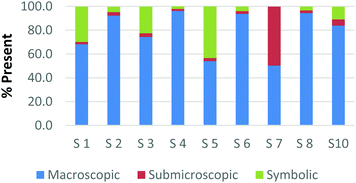
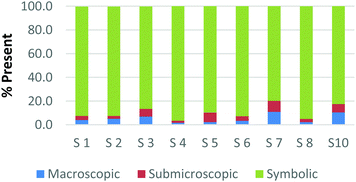
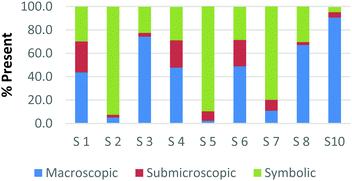
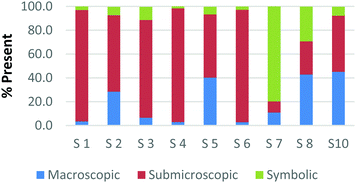
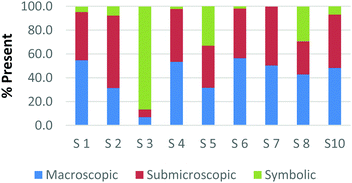
The difference among how the participants perceive representations at a single domain is also present at the macroscopic level. Fig. 4a and b shows differences in how preservice chemistry teachers classified cards where one has a picture of two powders placed on watch glasses (Fig. 4a) and the other is a picture of an Alka-Seltzer tablet bubbling in a glass of water (Fig. 4b) (Burdge, 2014, p. 67 & 4, respectively). Although the participants largely agreed that these two representations were primarily macroscopic, three of the participants perceived the Alka-Seltzer picture differently than the picture of the two powders. This difference was most pronounced when comparing S5 and S7. Both the participants agreed that each representation was about 50% macroscopic in nature. The remaining 50% portion of the card is where the two deviated in their perception. S5 described the words on the box of Alka-Seltzer as being symbolic. Prior to the activity, the role that text plays in a chemical representation had not been discussed; therefore the placement of this Alka-Seltzer card by S5 is reasonable. S7 perceived the remaining half as particulate in nature. This participant described the bubbles that are generated as a particulate element in this representation. Although an instructor may connect the generation of carbon dioxide to the particulate level, it is important for students to understand the scale and that each bubble is not a carbon dioxide molecule.
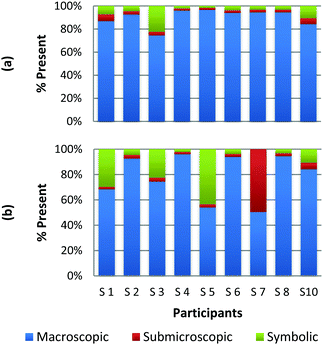 | ||
| Fig. 4 Preservice chemistry teacher perception of cards containing macroscopic representations; two watch glasses containing powders (a) and a line spectrum of hydrogen and helium (b). | ||
The above classification is an example of how misconceptions may be perpetuated due to the lack of scale literacy. It has been previously documented that like many groups of students, experienced and preservice teachers are most accurate with their knowledge of scale when considering objects that are in the human range (1 millimeter to 1 kilometer). Both groups are then more accurate considering the scale of objects larger than a human than compared to objects that were smaller (Tretter et al., 2006; Jones et al., 2008) The lack of scale literacy, especially on the smaller end, presents a challenge since macroscopic chemical properties are most often a result of changes at the submicroscopic level.
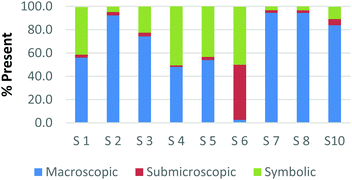
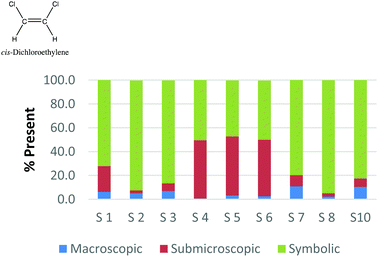
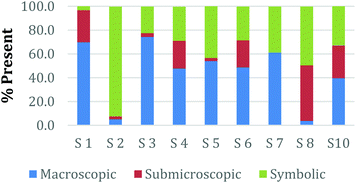
Overall, the participants had the most difficulty in ranking the submicroscopic representations. This is shown by the results for a card that contained both a ball-and-stick and space-filling representation of water and one that depicted a chemical equation of carbon monoxide reacting with hydrogen to form methanol using space-filling molecules, Fig. 5a and b (Burdge, 2014, p. 5 & 101, respectively). A third of the participants ranked the card containing the two water molecule representations as a largely (>80%) symbolic representation, while another third ranked it as largely (>65%) submicroscopic with a small portion of symbolic, and only one-third ranked it as purely submicroscopic in nature. Through the interviews, it was revealed that one participant ranked it as symbolic since the particles shown were done so with symbols. This nuance is what likely caused the correlation coefficients in Table 1 between the two submicroscopic representations to be lower than the other single-domain cards.
When the participants evaluated a different card where a chemical equation was shown using space-filling molecules to depict the quantity of the reactants and products, a third of the teachers changed their perception of how this submicroscopic representation should be classified (Fig. 5b). One participant reversed their classification between the two cards from largely symbolic to largely submicroscopic, while another teacher reversed it in the opposing direction. Surprisingly, one teacher felt as though the chemical equation had nearly half (40%) of the representation shown at the macroscopic level. Although these differences were not further investigated, they further support the notion that the participants had a difficult time ranking the submicroscopic level.
The placement of these two cards on the continuum makes it apparent that preservice teachers often perceive the submicroscopic representations as partially or largely symbolic in nature. This is a reasonable outcome since the representations using molecular models do not depict an image of the actual atoms. It is therefore important that preservice teachers understand that the use of molecular models, such as ball-and-stick or space-filling, is currently the best method for representing the submicroscopic level. With that said, it is important to acknowledge that the participants who have categorized these representations as largely symbolic may have a stronger sense of visual literacy when it relates to the submicroscopic domain. This group of participants has acknowledged that such things as the colour of the atom or the presence of a bond as merely a symbol. Consequently, this group of teachers may be more likely to address these misconceptions with their students in the classroom (Griffiths and Preston, 1992; Coll and Treagust, 2003; Talanquer, 2009; Taber and García-Franco, 2010). The difficulty the participants had in ranking the submicroscopic domain should not be seen necessarily as a deficit, but rather an asset to their classroom teaching practices.
Multiple and hybrid representations
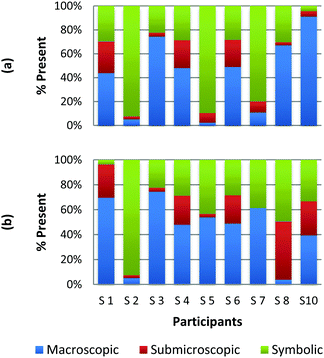
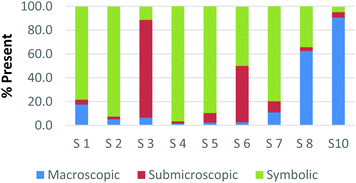
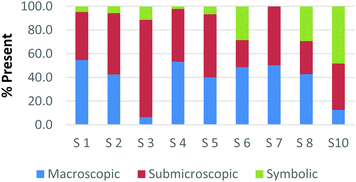
Among the cards containing multiple levels of representations, there is considerable variance in how the participants ranked each card. Following the validation interviews, it became apparent that the difference in how the participants ranked the same card is a result of what features of the card the individual was noticing and how prominent a feature is. This effect is demonstrated by the results shown in Fig. 6a for the placement of a card that contained the electromagnetic spectrum along with a macroscopic image of devices that operate in each region (Burdge, 2014, p. 228). There was variety in the classification of this representation as well as variety in the rationales given for the placement of the cards on the continuum. For example, participant S2 explained their placement by stating, “It's symbolic because of the scale.” This person made no reference to the macroscopic domain that was present and therefore may not have noticed this domain when ranking the card. On the other hand, participant S10 ranked this card initially as macroscopic, but during the interview realized that he/she had not observed the prominent symbolic feature of this representation. This change in classification is demonstrated by the conversation below, where the participant had initially placed it as a purely macroscopic representation.S10: It is just a representation of the spectrum and you’re not actually seeing it and then there are real world of where you see those waves. Ummm… I would put it somewhere else now that I am looking at it.
Interviewer: What would you change it to?
S10: Between macroscopic and symbolic because it has all the numbers on here for the different wavelengths and frequencies.
Participants S1 and S4 initially positioned this card on the continuum to represent the presence of all representational domains. Although an expert may not categorize this card as containing a particulate element, the participants both commented that different wavelengths are a result of how the particles move. Here these teachers are observed demonstrating expert-level processing of the representations as they extend the information shown on the card to other representational levels that are not present.
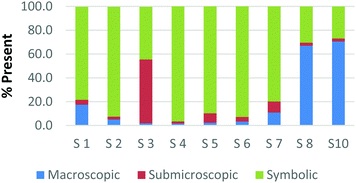
Participants largely gave a similar response for the placement of a card containing an image of a guitar and various vibrational patterns for the guitar strings, Fig. 6b (Burdge, 2014, p. 245). Here again participant S4 describes the wave patterns shown as a result of the movement of particles in addition to the macroscopic, the guitar, and symbolic, wave patterns, that were present on the card. Now that the waves are shown in the representation, participant S10 also makes the connection to moving particles. On the other hand, participant S7 is shown to only focus on the contents of the representation by stating, “So the guitar is macro, but these (pointing to the wave patterns) are symbolic representations are musical notes.”
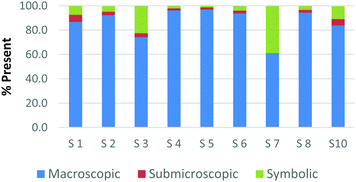
The participants are again observed placing a card on the continuum based on the prominent features present in the chemical representation that contains all three levels of representations. Fig. 7 displays the results for a card that contained a set of three Erlenmeyer flasks in the background with a caption bubble coming from each flask containing a particulate representation of the contents in the flask (Burdge, 2014, p. 325). Finally, below this was printed in small text the chemical equation for the reaction that was taking place in the set of flasks. Participants S7 and S10 described their placement of this card by only recognizing the flasks and the particulate diagrams. However, neither stated the presence of the overall chemical equation. In a similar way participant S3 initially ranked the card as only symbolic, due to the particulate representations shown in the foreground. However, during the interview he/she recognized the additional features and commented that it should be moved to the center of the triangle.
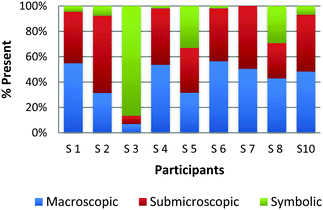 | ||
| Fig. 7 Multiple representations containing Erlenmeyer flasks (macroscopic), particulate representation of the flask contents (submicroscopic) and the chemical equation (symbolic). | ||
The last multiple representation that is important to discuss is a card that contained various ways of representing a water molecule, including a ball-and-stick water molecule, a space-filling water molecule, a line drawing of water, Lewis dot structure, and molecular formula of water. This card is similar to the card described in Fig. 5a. The preservice teachers who ranked the previous card containing only the ball-and-stick and space-filling representations of water as only symbolic labelled the current card as exactly identical, i.e. also symbolic. These results were also similar for those participants who ranked the initial card as a combination of both symbolic and submicroscopic, the only difference being a slight change in the relative percentages of each domain. However, all of the participants who ranked the initial card as purely submicroscopic now ranked the current card as nearly half submicroscopic and half symbolic. The placement of this multiple representation demonstrates that the majority of the group perceives submicroscopic representations, as actual symbols.
The results for the multiple representations described in this section suggest that cognitive load may contribute to the variance observed. Cognitive Load Theory recognizes the limited space of the working memory. This theory argues that instructional materials should be designed in such a way that best reduces the cognitive load placed on a learner (Sweller et al., 1998). Therefore, as the visual complexity of a representation increases, when more representational levels are included, the cognitive load also increases. Once the limit of the working memory is reached by the viewer, they may have only recognized and tried to make sense of the prominent features. Since the capacity of the working memory is exceeded, the viewer may not have been able to process all features of the representation nor be able to make the connections between all the levels present in a representation. The inability to process all of the information present hinders the viewer's ability to develop a complete understanding of the message conveyed.
Conclusions
The results of this study reveal that the participants were able to easily detect when the macroscopic level was present, or absent, in a chemical representation. This outcome may likely be attributed to the fact that this level is tangible and within the “human scale,” as was previously described. The participants also easily recognized mathematical equations as symbolic in nature, although it was not investigated whether the participants were able to accurately describe what the symbols represented. Variation among the participants' responses increased when the symbolic domain was presented as a graph or elemental symbol(s) and when the submicroscopic level was present. For these two levels (symbolic and submicroscopic), a greater degree of interpretation is required to understand the information that is conveyed in the representation. Due to this level of interpretation, one is likely to draw on personal experiences, a type of chemical knowledge that has been argued to be essential in developing a complete understanding of a chemical concept (Johnstone, 1991; Talanquer, 2011). The differing personal experiences, both educational and professional, result in differences among prior knowledge that likely contribute to the variation among the perceptions that are detected for chemical representations that contain these representational domains.It is also evident from the results that as the number of representational levels increases in one representation, variance among the levels perceived to be present increases dramatically. This may be both a result of the increase in the complexity as well as the level of interpretation necessary to make sense of the representation. Many textbooks now contain complex representations that try to connect two or three levels of Johnstone's triangle in order to encourage the reader to develop a complete understanding of the concept at multiple levels of chemistry. Cook described, “Even though a particular graphic may be designed to be cognitively useful, it may turn out to be functionally useless unless the learner perceives the information in the intended manner (Cook, 2006).” The variety among the participant responses for the placement of each card demonstrates that not all viewers may actually perceive the representation in the intended manner. Therefore, as more information is shown in the representation, the working memory may become overwhelmed and therefore the viewer may focus only on the prominent features or those features they can connect easily to prior knowledge. If the viewer does not notice the key features at the different representation levels, the point the representation was meant to convey is not achieved.
This exploratory study draws conclusions that begin to convey an understanding of how preservice teachers perceive a variety of chemical representations. Although, the study included a small sample size, a graduate class of ten chemistry education preservice teachers is considered a sizable amount. Therefore, the methods to establish validity and reliability took this into consideration. Although variance exists in how participants responded to the same card, there was an overall moderate to strong internal consistency in how preservice teachers responded to cards that were deemed to contain nearly identical representations. Certainly, the reliability of this methodology is stronger for the detection, or absence, of the macroscopic level. In addition, the validation interviews demonstrated that the rationales provided were described at a level that was largely consistent (>90%) with the placement of the card. Therefore, the methodology described in this paper is considered to be a valid and reliable method in detecting differences in how preservice teachers perceive a variety of chemical representations. However, saturation was not achieved to fully understand reasons for the variation in the rankings.
Collectively, the conclusions drawn from this study demonstrate a number of different factors that influence how one perceives a chemical representation. These findings align with the chemistry knowledge space that has been described by Talanquer (2011), specifically in relation to personal experiences, scale, and types of representations. The findings of this study have a number of implications for the training of preservice teachers. Improving the visual literacy among teachers may trickle down to improving the large population of students they teach. The results of this study suggest that primary areas to focus on as a mode of improving the visual literacy include understanding what makes up each domain of chemical representations, scale literacy and acknowledging the strength and weakness of the submicroscopic models.
The results of this study were collected at the beginning of a unit on visual literacy and teaching with chemical representations. Therefore, the participants were still constructing their understanding of each of the chemical representational domains, which may have resulted in the wide variation observed among some of the cards. Following instruction, it is important that the teachers come to a consensus for the classification of the majority of the cards presented in this study. The researchers recognize that not all chemical representations may be classified in a straightforward manner, since what constitutes each domain of Johnstone's triangle is an ongoing debate (Talanquer, 2011; Taber, 2013). In fact, discussions about differences in how one ranked a card is important to aid in recognizing the intricacies and subtle features of representations. It is however important that the teacher and students have a shared understanding of each domain for effective model-based instruction to take place. In addition, it is vital that the teacher is aware of the differences in how students perceive the chemical representations used in the classroom.
As noted previously, teachers, both preservice and experts, demonstrate the most difficulty with the scale for those objects smaller than humans (Tretter et al., 2006). In order to build a strong conceptual understanding of chemistry, it is important to understand how changes at the submicroscopic level result in observable changes at the macroscopic level (Berkel et al., 2009; Papageorgiou et al., 2017). Therefore, a strong conceptual understanding in chemistry is underpinned by a strong sense of scale at this submicroscopic end of the scale continuum. The development of practices that allow preservice teachers to master a sense of scale in the submicroscopic domain is vital. In addition, it is also important that the teachers are cognizant of their language choices when they describe this level of chemistry to their students. The literature notes the importance of the interplay between language and visualizations and the teacher in guiding students in how to learn to read an image (Mammino, 2014). Recall the example described earlier with the bubbles of carbon dioxide; it is important that the instructor explicitly comments on how the bubbles contain numerous molecules of carbon dioxide, as opposed to describing them as carbon dioxide bubbles. These subtle changes in instruction are vital to steering students away from common misconceptions in chemistry (Gabel, 1992).
An understanding of the chemistry at the submicroscopic level is vital to fully explain the chemical properties and phenomena. To do so, models are extensively used. Chemists use a vast array of model types (i.e. space-filling, ball-and-stick, etc.) at this level and the choice of which one is used is based upon the strengths and weaknesses of each type. Therefore, teachers should become aware of the strengths and weaknesses of such submicroscopic models, as well as symbolic representations of atoms and molecules. In addition, teachers should investigate student misconceptions that are developed from instruction that takes place at this level (e.g.Griffiths and Preston, 1992; Coll and Treagust, 2003; Talanquer, 2009; Taber and García-Franco, 2010) and develop practices that will allow students to steer clear of misconceptions.
The development of visual literacy, like all science practices, may be viewed as developmental. It is the role of the teacher to allow students to develop this skill. Therefore, it is vital that teachers carefully choose chemical representations that are developmentally appropriate and offer the relative structure that is needed to guide the students through the interpretation of the representation. The process of doing this is guided by PVCK. An initial way to begin evaluating PVCK among chemistry teachers may be through the use of the Representations in Chemistry Instruction (RICI) protocol, which aims to assess how and what kind of representations are used in the classroom along with the quality of discourse around the representations (Philipp et al., 2014). Following the evaluation of a teacher, this protocol may be used as a coaching tool for the teachers to build expertise related to PVCK.
The results of this study further provide insight into additional components of PVCK that are necessary to develop among chemistry teachers. First, the variation among the results of this study cannot be ignored. It is believed that the differences in perception are largely governed by prior knowledge and experiences. Therefore, one important element of PVCK development is equipping teachers with assessment practices that allow for the evaluation of student interpretation of chemical representations. Analysis of such assessment data prior to instruction would allow for congruence between the representations chosen and how they are used to guide the teaching of the content with the students' abilities. Although textbooks often present multiple or hybrid representations in an effort to link the domains of chemical representations, these types of representations may not be developmentally appropriate for students. In some cases these types of representations may introduce a level of complexity and induce cognitive load, adversely affecting student learning of the topic. Assessment following instruction is also vital to ensure that students can appropriately interpret the information conveyed in the representation.
Another key feature of the results that informs an essential element of PVCK was the tendency of the participants to extend their perception of a representation beyond the level(s) that are explicitly present. This is similar to an expert's ability to move past the surface features of a representation and connect the information present to other domains. Certainly, teachers strive to build this skill among their students. Therefore, another important element of PVCK is the ability of teachers to parse out the explicit (e.g. presence of atoms, linear relationship of a graph) and implicit (e.g. atomic symbols that are used to represent atoms) features of a representation. Making teachers aware of where the interpretation of a representation is rooted may influence how the teachers initially perceived the set of representations. Instructional practices must then be developed that support students first in interpreting explicit features of a chemical representation and then plan purposeful instruction that allows students to explore connections beyond the representation to other representational domains of chemistry.
The implications highlighted here may be most important for consideration in the development of chemistry education teaching methods course work. However, these implications are also practical for chemistry faculty teaching content courses in which the preservice teachers enroll. Exemplary teaching practices serve to influence the practices that teachers implement in their own classroom.
Appendix 1
This appendix provides a detailed description of each representation. When possible the exact content has been included. All presentations were taken from a popular chemistry textbook and the accompanying online materials (Burdge, 2014). The textbook page is included after each description.Macroscopic cards
Symbolic representations
Submicroscopic representations
Macroscopic and symbolic representations
Macroscopic and submicroscopic cards
Symbolic and submicroscopic representations
Macroscopic, symbolic and submicroscopic representation
Appendix 2
| Representational domain | Open code for rationale provided | Exemplary response |
|---|---|---|
| Macroscopic | Includes objects that are able to be seen with the eye | “And then S, I think I kept this as just…this one, this one I said was macroscopic and I still agree with that because its more….because when your talking about something that you can visibly see on your own without having to use a microscope or trying to imagine what it will look like. And that's what I would consider a macroscopic representation of a chemical concept.” Participant S3 |
| Represents a process that can be observed | “B I felt like the particle….like you could actually see the different…like the chromatography of this was breaking it up into smaller particles. So I originally thought it was particulate but then I moved into to macroscopic because in my eyes macroscopic is what actually happens. And this is a picture of what is actually happening.” – Participant S8 | |
| Absence of particles from the representation | “Ok, well we don't actually see atoms there. We aren't actually seeing what the atoms themselves, or the molecules themselves are doing there. So we are looking at the macroscopic.” (Description of the macroscopic portion of Card F) – Participant S5 | |
| It is something you can hear | “Cause the guitar is kind like a macroscopic example…like you can hear the guitar when pluck the string and the strings vibrate and whatever.” – Participant S10 | |
| Symbolic | Represents something that can not be seen | “I would understand this as a symbolic representation of hydrogen bonding. But I guess after the article emphasizes the fact that it is a symbolic representation of water. So its not water itself, it's a symbolic representation.” (Description of Card L) – Participant S7 |
| Includes equations, formulas, letters, numbers, or labels | “I felt L fit best here (in the symbolic corner) because of the Hs and Os and also the plus…and also the particle positive and negative charges.” – Participant S3 | |
| A representation of a process (i.e. chemical equation, position of electrons) | “So this is an equation. An equation is a symbolic representation of a process or an experiment.” (Description of card K) – Participant S2 | |
| Representations of data | “The symbolic part of that would come from the fact that it is a chart, or a graph, that actually shows data.” – Participant S3 | |
| Use of colors to represent information | “It’s definitely a visualization where the colors are symbolic.” (Descriptions of Card D) – Participant S1 | |
| Symbols are used to represent the particulate nature of matter | “Symbolic was the spheres representing the different molecules.” (Description of Card N) – Participant S8 | |
| Submicroscopic | Presence of an atom or molecule | “The ball-and stick there (pointing to the molecule) are the particle.” (Description of Card D) – Participant S1 |
| Connection to something at the particulate level | “So again this is similar to the other one where we got the wavelengths and we’ve got the colors. And it might be because of the colors or something that we can see the visible spectrum. Umm…maybe…well that was this one (pointing to Card S) but since it’s in the visible spectrum it is something that we can tie to things that we see. We can do the spectroscope or the lamps or the flame test or something where this can be seen with out eyes. But we are talking about electrons which are particles.” (Descriptions of Card C) – Participant S1 | |
References
- Berkel B. V., Pilot A. and Bulte, A. M. W., (2009), Micro–macro thinking in chemical education: Why and how to escape, in Gilbert J. K. and Treagust P. D. (ed.), Multiple Representations In Chemical Education, New York: Springer, pp. 31–54.
- Bhattacharyya G. and Bodner G. M., (2005), “It gets me to the product”: how students propose organic mechanisms, J. Chem. Educ., 82(9), 1402–1407.
- Bucat B. and Mocerino M., (2009), Learning at the sub-micro level: structural representations, in Gilbert J. K. and Treagust D. (ed.), Models and Modeling in Science Education: Multiple Representations in Chemical Education, Netherlands: Springer, pp. 11–30.
- Burdge J., (2014), Chemistry, 3rd edn, New York: Mcgraw-Hill.
- Chi M. T. H., Feltovich P.J. and Glaser R., (1981), Categorization and representation of physics problems by experts and novices, Cognit. Sci., 5(2), 121–152.
- Coll R. K. and Treagust D. F., (2003), Investigation of secondary school, undergraduate, and graduate learners' mental models of ionic bonding, J. Res. Sci. Teach., 40(5), 464–486.
- Cook M. P., (2006), Visual representations in science education: the influence of prior knowledge and cognitive load theory on instructional design principles, Sci. Educ., 90(6), 1073–1091.
- Cook M., (2011), Teachers' use of visual representations in the science classroom, Sci. Educ. Int., 22(3), 175–184.
- Davies F. and Greene T., (1984), Reading for learning in the sciences, Edinburgh: Oliver & Boyd.
- Edwards A. and Head M. L., (2016), Introducing a culture of modeling to enhance conceptual understanding in high school chemistry courses, J. Chem. Educ., 93(8), 1377–1382.
- Eilam B., (2012), Teaching, learning, and visual literacy: the dual role of visual representation, New York: Cambridge University Press.
- Fang Z., (2006), The language demands of science reading in middle school, Int. J. Sci. Educ., 28(5), 491–520.
- Gabel D., Briner D. and Haines D., (1992), Modeling with magnets: A unified approach to chemistry problem solving, Sci. Teach., 59(3), 58–63.
- Gilbert J. K., (2004), Models and modelling: routes to more authentic science education, Int. J. Sci. Math. Educ., 2(2), 115–130.
- Gilbert J. K. and Eilam B., (2014), Developing science teachers' representational competence and its impact on their teaching, in Eilam B. and Gilbert J. K. (ed.), Science teachers' use of visual representations, New York: Springer International Publishing, pp. 315–329.
- Gkitzia V., Salta K. and Tzougraki C., (2011), Development and application of suitable criteria for the evaluation of chemical representations in school textbooks, Chem. Educ. Res. Pract., 12(1), 5–14.
- Griffiths A. K. and Preston K. R., (1992), Grade-12 students' misconceptions relating to fundamental characteristics of atoms and molecules, J. Res. Sci. Teach., 29(6), 611–628.
- Hardiman P. T., Dufresne R. and Mestre J. P., (1989), The relation between problem categorization and problem solving among experts and novices, Mem. Cognit., 17(5), 627–638.
- Johnstone A. H., (1991), Why is science difficult to learn? Things are seldom what they seem, J. Comp. Assisted. Learn., 7(2), 75–83.
- Johnstone A. H., (1993), The development of chemistry teaching: A changing response to changing demand, J. Chem. Educ., 70(9), 701.
- Johnstone A. H., (2000), Teaching of chemistry – logical or psychological? Chem. Educ. Res. Pract., 1(1), 9–15.
- Jones M. G., Tretter T., Taylor A. and Oppewal T., (2008), Experienced and novice teachers' concepts of spatial scale, Int. J. Sci. Educ., 30(3), 409–429.
- Kelly G. A., (1977), Personal construct theory and the psychotherapeutic interview, Cognit. Ther. Res., 1(4), 355–362.
- Kozma R. B. and Russell J., (1997), Multimedia and understanding: expert and novice responses to different representations of chemical phenomena, J. Res. Sci. Teach., 34(9), 949–968.
- Krieter F. E., Julius R. W., Tanner K. D., Bush S. D. and Scott G. E., (2016), Thinking like a chemist: development of a chemistry card-sorting task to probe conceptual expertise, J. Chem. Educ., 93(5), 811–820.
- Mammino L., (2014), The interplay between language and visualization: the role of the teacher, in Eilam B. and Gilbert J. K. (ed.), Science teachers' use of visual representations, New York: Springer, pp. 195–226.
- Marton F., (1986), Phenomenography—a research approach to investigating different understandings of reality, J. Thought, 21(3), 28–49.
- Mayer R. E., Steinhoff K., Bower G. and Mars R., (1995), A generative theory of textbook design: using annotated illustrations to foster meaningful learning of science text, Educ. Technol. Res. Dev., 43(1), 31–41.
- Mcgeorge P. and Rugg G., (1992), The uses of ‘contrived’ knowledge elicitation techniques, Expert Syst., 9(3), 149–154.
- Myers G. A., (1992), Textbooks and the sociology of scientific knowledge, Engl. Specific Purp., 11(1), 3–17.
- National Research Council, (2012), A framework for K-12 science education: practices, crosscutting concepts, and core ideas, Washington, DC: The National Academies Press.
- Papageorgiou G., Amariotakis V. and Spiliotopoulou V., (2017), Visual representations of microcosm in textbooks of chemistry: constructing a systemic network for their main conceptual framework, Chem. Educ. Res. Pract. 10.1039/C6RP00253F.
- Patrick M. D., Carter G. and Wiebe E. N., (2005), Visual representations of DNA replication: middle grades students' perceptions and interpretations, J. Sci. Educ. Technol., 14(3), 353–365.
- Philipp S. B., Johnson D. K. and Yezierski E. J., (2014), Development of a protocol to evaluate the use of representations in secondary chemistry instruction, Chem. Educ. Res. Pract., 15, 777–786.
- Prain V. and Waldrip B., (2006). An exploratory study of teachers' and students' use of multi-modal representations of concepts in primary science, Int. J. Sci. Educ., 28(15), 1843–1866.
- Prain V. and Waldrip B., (2008), A study of teachers' perspectives about using multimodal representations of concepts to enhance science learning, Can. J. Sci., Math. Technol. Educ., 8(1), 5–24.
- Rugg G. and Mcgeorge P., (1997), The sorting techniques: a tutorial paper on card sorts, picture sorts and item sorts, Expert Syst., 14(2), 80–93.
- Schnotz W., (2002), Commentary: Towards an integrated view of learning from text and visual displays, Educ. Psych. Rev., 14(1), 101–120.
- Smith J. I., Combs E. D., Nagami P. H., Alto V. M. Goh H. G., Gourdet M. A. A., Hough C. M., Nickell A. E., Peer A. G. Coley J. D. and Tanner K. D., (2013), Development of the biology card sorting task to measure conceptual expertise in biology, CBE Life Sci. Educ., 12(4), 628–644.
- Stains M. and Talanquer V., (2008), Classification of chemical reactions: stages of expertise, J. Res. Sci. Teach., 45(7), 771–793.
- Stover C., (2017), Ternary Diagram, Homepage Of Wolfram Research, Inc., online, available: http://Mathworld.Wolfram.Com/Ternarydiagram.html, Apr 4, 2017.
- Sweller J., Van Merrienboer J. J. G. and Paas F. G. W. C., (1998), Cognitive architecture and instructional design, Educ. Psych. Rev., 10(3), 251–296.
- Taber K. S., (2013), Revisiting the chemistry triplet: drawing upon the nature of chemical knowledge and the psychology of learning to inform chemistry education, Chem. Educ. Res. Prac., 14, 156–168.
- Taber K. S. and García-Franco A., (2010), Learning processes in chemistry: drawing upon cognitive resources to learn about the particulate structure of matter, J. Learn. Sci., 19(1), 99–142.
- Talanquer V., (2009), On cognitive constraints and learning progressions: the case of Structure Of Matter, Int. J. Sci. Educ., 31(15), 2123–2136.
- Talanquer V., (2011), Macro, submicro, and symbolic: the many faces of the chemistry, Int. J. Sci. Educ., 33(2), 179–195.
- Tretter T. R., Jones M. G. and Minogue J., (2006), Accuracy of scale conceptions in science: mental maneuverings across many orders of spatial magnitude, J. Res. Sci. Teach., 43(10), 1061–1085.
- Tulip D. and Cook A., (1993), Teacher and student usage of science textbooks, Res. Sci. Educ., 23(1), 302–307.
- Weiser M. and Shertz J., (1983), Programming problem representation in novice and expert programmers, Int. J. Man-Mach. Stud., 19(4), 391–398.
| This journal is © The Royal Society of Chemistry 2017 |

