Development of an instrument to evaluate high school students' chemical symbol representation abilities
Zuhao
Wang
a,
Shaohui
Chi
 *b,
Ma
Luo
a,
Yuqin
Yang
a and
Min
Huang
a
aInstitute of Curriculum and Instruction, Faculty of Education, East China Normal University, Shanghai 200062, China
bThe State University of New York at Buffalo, Buffalo, NY, USA. E-mail: shaohuic@buffalo.edu
First published on 30th August 2017
Abstract
Chemical symbol representation is a medium for transformations between the actual phenomena of the macroscopic world and those of the sub-microscopic world. The aim of this study is to develop an instrument to evaluate high school students' chemical symbol representation abilities (CSRA). Based on the current literature, we defined CSRA and constructed a four-level measurement framework validated by expert review. After that, an initial measurement instrument was developed based on the framework. Then, 52 students of Grade 10 and 56 students of Grade 11 were selected from school A to participate in the first round of testing. During the data analysis, Rasch measurement was used to investigate and improve the quality of the instrument. After that, 55 Grade 10 students and 57 Grade 11 students from school B participated in the second-round of testing, and the Rasch analysis results demonstrated good reliability and validity of measures based on the CSRA framework.
Introduction
By investigating the changes of matter as well as the essential principles, chemistry has its own features in terms of requiring the understanding of the invisible micro world (Gkitzia et al., 2011). For the sake of representing chemical phenomena, specialized symbol systems (molecular formulae, chemical equations, molecular models, Fischer projections, etc.) have been invented to help chemists to communicate and visualize chemistry (Hoffmann and Laszlo, 1991; Mathewson, 2005).In chemistry education, the relevance of the triplet relationship proposed by Johnstone (1982) has been explicitly highlighted, which contains three levels: the macro, the micro, and the symbolic. This three-level way of thinking can be represented by the vertices of a triangle (illustrated in Fig. 1), comprising (a) the macro and tangible including observable and sensory phenomena, (b) the micro (also known as sub-micro) including atoms, molecules, ions, etc., and (c) the symbolic or representational comprising formulae, equations, molarity, mathematical manipulation, and graphs (Johnstone, 2000).
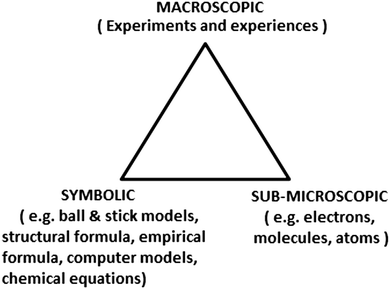 | ||
| Fig. 1 The three representational levels in chemistry (Johnstone, 1991). | ||
The chemistry triplet is often shown as the vertex of an equilateral triangle to symbolize the equal importance of each type of representation and the links between them in understanding chemistry (Lin et al., 2016). Although this interpretation of the triplet is common, other valid frameworks and perspectives exist and are in use in chemistry education research and instruction (Gilbert and Treagust, 2009; Talanquer, 2011; Taber, 2013). Taber (2013) believed that it was not helpful to think of symbolic knowledge as a discrete ‘level’ of chemistry knowledge that is one element of an ontological triad of macroscopic–submicroscopic–symbolic. The symbolic level can act as a bridge between the other two levels by simultaneously representing both the macroscopic and submicrosopic, and aiding us in shifting between these levels in our explanations. It is such shifts that are so important in building up the explanatory schemes that make chemistry a science (offering explanation and prediction) and not just a natural history that catalogues and characterises substances (Taber, 2013).
Due to its abstract nature, chemistry relies on a system of representations. As representations are commonly used in explanations of macroscopic phenomena and as a way of communicating chemical ideas (Sim and Daniel, 2014), representational abilities have become a necessary skill in learning chemistry. Since chemical composition, structure, qualitative and quantitative descriptions of chemical reactions have to be expressed by symbolic representations, it is essential for students to thoroughly absorb the method of converting a symbol into the meaningful information it represents (Kozma and Russell, 1997). For the sake of improving symbolic representation instruction in chemistry, it is important to understand the extent to which students have developed chemical symbol representation abilities (CSRA). Unfortunately, until now, few attempts have been made to research students' symbolic representations (Jaber and BouJaoude, 2012; Milenkovic et al., 2014). In order to fill the gap, this study aims to develop and validate an instrument to evaluate senior high school students' chemical symbol representation abilities (CSRA).
Literature review
Chemical symbols form a symbolic system in international academic circles with the use of unified regulation, expressing chemical composition, structure and chemical processes in the chemistry discipline. It is an international language that goes beyond national boundaries regardless of the language barrier, and it is the basic language that mediates the transformations between actual phenomena in the macroscopic world and the sub-microscopic world. This level is assumed to include all types of signs, chemical or mathematical, used to represent concepts and ideas in the discipline. Previous studies have found high correlation of general reasoning abilities and visualisations of microscopic processes (Keig and Rubba, 1993).Regarding symbolic representations, including symbols, letters, numbers and signs, they are usually used to represent atoms, molecules, ions, substances and chemical phenomena (Wu and Shah, 2004). The language of chemists is constructed by symbolic representations, where a symbol is the equivalent of a word (Hoffmann and Laszlo, 1991). Symbolic representations should be considered as the bridge or means to connect between the observable macroscopic representation and the molecular representation.
In terms of ability, different researchers have different definitions. It could refer to the quality of being able to perform, or a quality that permits or facilitates achievement or accomplishment, or possession of the qualities (especially mental qualities) required to do something or get something done (Niaz, 1995; NRC, 2005). Kozma and Russell (1997) once referred to representational competence as the core of the chemistry curriculum which is defined as the ability to identify, analyze, and interpret features of one or many representations, the skill of transforming representations into other forms, and the ability to generate a representation and to explain its appropriateness (Kozma and Russell, 1997). In this study, chemical symbol representation ability was defined as a major factor of students' chemical ability, including the competence to identify and understand the meaning of scientific symbols, as well as the ability of expressing, inferring and application of those symbols. Chemical symbols not only contain rich information (macro, micro, quantitative relations, etc.), but also can be used to express the composition, structure and rules of changes. At the same time, they also entail one's thinking and reasoning to solve chemical problems. Chemical learning activities are always linked with chemical symbols, and student's chemical symbol representation abilities directly determine whether they are able to think and solve problems using chemical methods and the level of learning.
Representation of chemical concepts requires the learners not only to understand the chemical concepts and chemical representations involved, but also their ability to translate between representations. Many novice learners are unable to create a link between the three levels of thinking simultaneously (Sim and Daniel, 2014). Numerous studies about the “chemistry triplet” imply constant interplay between the macroscopic, submicroscopic, and symbolic levels of thought, which is in favor of meaningful understanding of chemical concepts and the development of representational abilities (Gkitzia et al., 2011; Jaber and BouJaoude, 2012; Milenkovic et al., 2014). Treagust et al. (2003) have shown that effective learning in chemistry is related to the simultaneous use of the submicroscopic and the symbolic components of knowledge in chemical explanations. Similarly, Wu and Shah (2004) in their investigation of the role of visuospatial reasoning in learning chemistry propose the use of multiple representations with explicit connections. Moreover, Dori and Hameiri (2003) have introduced a three-understanding-level model for analyzing and constructing quantitative problems in chemistry (symbolic–macroscopic, symbolic–submicroscopic and symbolic-process). Moving fluently between any two of the three representations based on the chemical symbols to reason and solve chemistry problems is exactly the heart of chemical symbol representation abilities. Nevertheless, symbolic representations, such as chemical symbols, formulae, and equations, are less concrete because they are more arbitrarily connected to the referent (Lin et al., 2016). Thus, chemical symbol representation abilities should be given more focus in the field of chemical education.
A literature review suggests that it is worth investigating the extent to which students develop chemical symbol representation abilities and exploring how symbolic representations are used by them to make meaning of the chemical world. However, few studies in the existing literature have been conducted in the evaluation of the development of students' chemical symbolic representation abilities. Some existing studies directly focusing on the learning levels are flawed and in chemistry education, even fewer studies can be found relating to the learning levels of chemical symbolic abilities in high school students. As the cultivation of the students’ abilities is hierarchical, the evaluation of CSRA is a legitimate aspect of scientific investigation in the field of chemistry education. To fulfil the gap, therefore, this study aims to develop a valid and reliable instrument guided by a measurement framework involving learning levels to evaluate high school student's chemical symbol representation abilities. With this aim in view, the following research questions are raised.
(1) What are the learning levels of chemical symbolic representation abilities (CSRA) which can explain students' performance?
(2) How can a reliable and valid measurement of students' CSRA be constructed based on the learning levels?
Measurement framework of CSRA
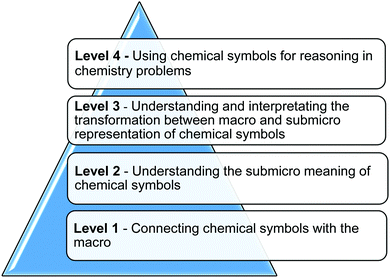
To answer these two research questions, it is necessary to evaluate a cognitive learning process as a basis of chemical abilities (Su, 2016). Bloom's taxonomy (Bloom et al., 1956), a well-established model for understanding higher order levels of learning, can be useful in developing chemical abilities. It is based on the idea that complex learning is built upon simpler components, suggesting that those simpler components must be learned first, allowing them to ‘develop and become integrated with other behaviors to form more complex behavior which is classified in a different way’ (Bloom et al., 1956, p. 10). As revised by Anderson et al. (2001), Bloom's taxonomy consists of six major levels of learning: remembering, understanding, applying, analyzing, evaluating, and creating. Similarly, SOLO taxonomy proposed by Biggs and Collis (1982) provides criteria that identify the levels of increasing complexity of students' performance for understanding when mastering new learning (Biggs, 1999). It includes levels revealing the structure complexity of students' knowledge as they learn. The lower levels focus on the quantity (the amount the learner knows) while the higher levels focus on the integration (Jimoyiannis, 2011). As a general educational taxonomy, this schema is assumed to apply to the evaluation of students' learning in various subjects, like mathematics, science, technology etc. (Chick, 1998; Hazel et al., 2002; Padiotis and Mikropoulos, 2010). SOLO describes a hierarchy where “each partial construction [level] becomes a foundation on which further learning is built” (Biggs, 2003, p. 41).Considering the levels of chemistry learning and theories of taxonomy, we hypothesized students' learning levels of chemical symbol representation abilities to ensure the crucial roles that symbolic representations play. What's more, a well-designed framework contributes to students' identifiable advancements for different levels of cognitive constructions integrated with CSRA. For this reason, we constructed a measurement framework of chemical symbol representation abilities specifically for high school students including four levels (Fig. 2). The hierarchical nature of chemical symbol representation abilities is somewhat analogous to the levels of learning in taxonomy. Experts dedicated to science education or chemistry education have discussed and modified the measurement framework during the construction process, in order to ensure good validity of the framework.
CSRA contains four levels including the macro level, the submicro level, the transformation between the former two levels and the interpretation of it, and the reasoning level involving chemical symbols. The four levels of CSRA show basic rules and increasing sophistication during the process of chemistry learning and scientific thinking development. The performance of the four levels has been presented in Appendix 1, as well as the diverse demands of content knowledge, indicating the basis of capability development and difficulty differences of measurement items in the same level. It should be noticed that the description has not shown the exhaustion of performance in each level, while the development of measurement items and data analysis in the following study will be conducted in terms of the typical ones listed in this table.
Methods: development of a measurement instrument
Guided by the measurement framework, an initial measurement instrument with corresponding test items was prepared in this part. After two rounds of test, we obtained quantitative evidence for instrument improvement.Rasch model analysis
The Rasch model is the mostly widely used IRT model for constructing measurement instruments. One of the assumptions of the Rasch model is that it requires the collected empirical data to meet the specified criteria and structure for objective measurement, rather than using different parameters to fit the characteristics of data. Unidimensionality and local independence are the two other important assumptions of Rasch modeling, which assumes that all items measure a same construct and the covariance among items is explained solely by the hypothesized construct. The two assumptions are hypotheses to be empirically tested based on model-data-fit statistics. According to the Rasch model, each item’s difficulty and person’s ability is estimated on a logit scale. In addition, the scale ensures that we can compare item difficulty measures and students' latent abilities directly across all populations and test items (Wright and Stone, 1979; Wright, 1997; Hambleton, 2000; Smith, 2002; Liu, 2007). Under Rasch model conditions, these measures are item-distribution-free and person-distribution-free, so that the measures are statistically equivalent for the items regardless of which persons (from the same population) are analyzed, and for the items regardless of which items (from the same population) are analyzed (Linacre, 2006, 2011).During the application of the Rasch model to evaluate the measurement instrument, a fitting test with the model and test data should be done, including the examination of overall measurement data fitting with the theoretical model, and the unidimensionality test on the fitting degree of certain testing items with the model. Only after the overall model-data-fit test and the unidimensionality test of certain testing items could the reliability of the parameter estimation of the people latent ability level and item difficulty be guaranteed (Wright and Stone, 1979; Wright, 1997; Hambleton, 2000; Smith, 2002; Liu, 2007).
It is such a holistic and iterative process that assessing the data fitness to the Rasch model requires numerous fit indices to determine item and person fit, such as an overall analysis, an item unidimensionality test, a variable map (or a Wright map named after Benjamin Wright, Wilson and Draney, 2002), and an item characteristic curve (ICC), etc. All these tests are used for assessing and optimizing the measurement framework. The criteria of these indices and tests can be found in the manual (Linacre, 2006, 2011) and others' research (Mok et al., 2006; Liu, 2010; Wei, 2011; Sondergeld and Johnson, 2014).
Rasch model analysis has been widely used in science and chemical education research, ranging from teachers' behavior performance to students' achievement, as well as the assessment and development of valid instruments (Philipson and Tse, 2007; Lang and Wilkerson, 2008; Chan, 2010; Liu, 2010; Randall, 2010; Wei, 2011; Wei et al., 2012). All of these studies have provided useful reference for this study.
Procedure
Based on the principles and theories of the Rasch model, Wilson has proposed the four-cornerstone approach as the framework of measurement development and design (Wilson, 2005). According to this, firstly we need to construct a measurement framework of CSRA. Secondly, guided by the framework, we need to design items for the development of the instrument of a pilot test, and examine the validity and reliability. Then we should conduct the test and analyze the data during which we should consider the sampling and various indices for the quality of the initial instrument. Based on the data analysis, we should modify the instrument, test it again, and repeat the analysis process until the data fit the Rasch model.Items of measurement instrument
The initial instrument for CSRA consisted of 27 items, including 24 multiple-choice questions (PS1–PS24) with four choices while only one of them was correct, and 3 constructed-response questions (PS25–PS27). All items of the measurement instrument correspond to the CSRA levels of the framework (Table 1). To ensure the face and content validity of items, the draft measurement instrument was reviewed by six experts in the field of science education, and 12 undergraduate students, in order to check for possible omissions and seek recommendations for improvement. Then we revised wording of some items according to the results of the review, and an interview on the refinements was undertaken, in which all six experts agreed that these items had both acceptable face validity, and content validity.| Level | Items |
|---|---|
| Level 1 | PS1, PS2, PS3, PS4, PS5, PS6, PS7, PS8 |
| Level 2 | PS9, PS10, PS11, PS12, PS13, PS14, PS15, PS16 |
| Level 3 | PS17, PS18, PS19, PS20, PS21, PS22 |
| Level 4 | PS23, PS24, PS25, PS26, PS27 |
Through the examination based on the partial-credit Rasch model, the modification (adjustment, deletion or addition etc.) of the initial instrument was conducted. Finally, the instrument for the second-round test, including 17 multiple choice questions (S1–S17) and 3 constructed-response questions (S18–S20) was created. All items of the measurement instrument correspond to the CSRA levels of the framework (Table 2), in order to ensure the content validity of items.
| Level | Items |
|---|---|
| Level 1 | S1, S2, S3, S4, S5 |
| Level 2 | S6, S7, S8, S9, S10 |
| Level 3 | S11, S12, S13, S14, S15, S16 |
| Level 4 | S17, S18, S19, S20 |
For multiple choice questions, each question contains four options and only one is correct. The following examples illustrate a brief analysis of the items and levels of the CSRA.
Example 1 (PS4/S3): which group in the following is listed in the order of acid, base and salt? (Correct answer: D)
A. H2SO4, Na2CO3, NaCl
B. NaHSO3, CaO, Na2SO4
C. HCl, Cu2(OH)2CO3, Na2CO3
D. CH3COOH, Ca(OH)2, NaCl
The item belongs to level 1, examining the ability of connecting chemical symbols with the macro world. It reflects a respondent's ability to identify the matters and the categories represented by the common chemical formulae. It should be noted that students should apply the Arrhenius definition rather than the Bronsted definition to solve this problem, while the latter one is beyond the learning standards of middle school chemistry in China.
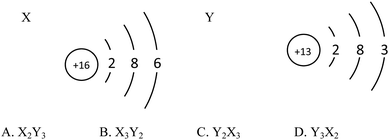
Example 2 (PS14/S9): the structure schematics of the two particles X and Y are shown below. So the chemical formula of the compound formed by X and Y is (![[thin space (1/6-em)]](https://www.rsc.org/images/entities/char_2009.gif) ) (Correct answer: D)
) (Correct answer: D)
This item aims to examine students' understanding and application of atomic structure schematics and belongs to level 2. In order to answer the question correctly, students should not only acquire the knowledge of ‘Atoms are made up of nucleus and extranuclear electrons’, ‘Nucleus consists of protons and neutrons’, ‘Nuclear charge number = proton number = electron number’, ‘The electrons are layered’ etc., but they also should use structure schematics to represent the structure of atoms, comprehend the significance of the outermost electrons to the nature of elements, know that the elements of positive valence are written in the front while the elements of negative valence are written in the back when writing chemical formulae, understand that the sum of the elements in the chemical formula is 0 and so on. If students choose A or B, they may not understand the rules when writing chemical formulae. And if they choose C, they generate misunderstanding when they determine the gain or loss of the electrons and the valence of elements.
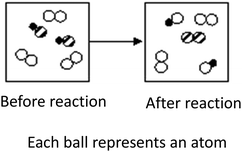
Example 3 (PS21/S15): through their initial random motion the molecules of nitrogen and hydrogen will attach themselves to the catalyst surface. Each hydrogen molecule breaks up into hydrogen atoms while each nitrogen molecule decomposes into nitrogen atoms. The atoms of hydrogen and nitrogen will combine into ammonia molecules that adhere to the surface of the catalyst and will be off the surface after reaction. N2, H2 and NH3 are, respectively, represented by “![[thin space (1/6-em)]](https://www.rsc.org/images/entities/char_2009.gif) ”. Please observe the following figures. Which order is in line with the ammonia synthesis process at the surface of the catalyst? (Correct answer: C)
”. Please observe the following figures. Which order is in line with the ammonia synthesis process at the surface of the catalyst? (Correct answer: C)
Item PS21/S15 belongs to level 3, examining the ability of understanding and interpretating the transformation between the macro and submicro representation of chemical symbols. At this level, students should be able to transform flexibly between macro matters, phenomena, submicro structures, and theories. The molecules of nitrogen and hydrogen, in the random motion at the beginning, will rank on the catalyst surface when the catalyst works. Hydrogen is divided into hydrogen atoms while nitrogen decomposes into nitrogen atoms. The atoms of hydrogen and nitrogen will combine into ammonia molecules that adhere to the surface of the catalyst and will be off the surface after reaction.
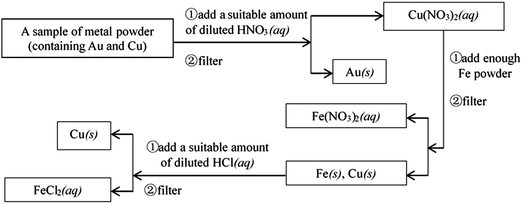
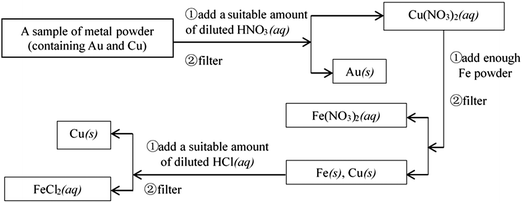
Example 4 (PS27/S20): experimental designs or thinking processes are usually represented by process charts and chemical symbols in chemistry. The following process chart shows us an experiment procedure, which introduces how to separate Au and Cu from some mixed metal powder.
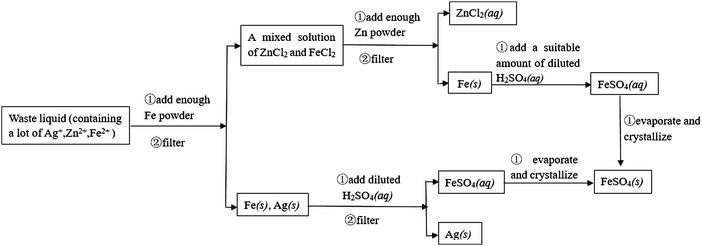
Suppose that there is some waste liquid from the processing of the photographic films, which contains lots of Ag+, Zn2+ and Fe2+. And you want to recover silver (main product) and ferrous sulfate crystals (by-product) from the waste liquid, draw a process chart and use chemical symbols to describe your experimental design.
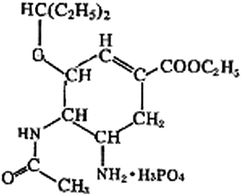
This question is a constructed-response item, and belongs to level 4. It is designed to examine whether students can express their experimental designs or thinking process with chemical symbols, which is the highest level of the ability of chemical symbolic representation. A complete process chart (about how to separate Au and Cu from some mixed metal powder) has been given to students, so that they can imitate how to introduce their experimental designs (about how to recover silver and ferrous sulfate crystals (by-product) from waste liquid) with chemical symbols. The necessary and basic knowledge they need is the understanding of chemical conceptions, such as metal activity series, and reactions between metal and salt solution, and the understanding of chemical operations, such as filtering and crystallization. The thinking process of students should be expressed by the means of chemical symbolic representation.
If students were able to use the process chart to describe the experimental process, obtain two products, and the process is entirely reasonable, they would score full points. Below is the reference answer:
Participants
The sample was drawn from high school (Grades 10–12) students in Jiangsu Province of China who were taking physics and chemistry for their elective science subjects. They should learn the two specific subjects every school year. After that, they will attend the College Entrance Examination. On account of the practical benefits of convenience sampling, during the first-round of test, 52 students of Grade 10 and 56 students of Grade 11 were selected from school A, consisting of 48.1% female students and 51.9% male students. Then, 55 Grade 10 students and 57 Grade 11 students from school B participated in the second-round of test, consisting of 49% female students and 51% male students. The average age of all these participants was 16.8 years with a range of 15–17 years. Besides that, we also took teaching quality (demonstrating the representative level of Jiangsu Province) and distribution of students' cognitive ability (based on their academic performance of science subjects) into consideration. The two schools are both four-star high schools accredited by the Jiangsu Agency for Educational Evaluation Authorities, which means the highest-level appraisal with first-class school conditions, teaching staff and management. The first-round of test was conducted in mid-September 2011, with the second-round test one month later. According to the ethical principles, through the process of informed consent, all the participants were aware of the aim and content of the tests, as well as the procedures. The test moderator informed the participants that there were no risks involved of their academic performance and we would ensure the anonymity of all the participants. The participants were allowed to act autonomously and to express their right of self-determination. They should answer the questions totally on their own within limited time (45 minutes per test).Data analysis of the first-round test
The data of the student's scores of the first-round test were collected for Rasch analysis. Bond & Fox Steps (version 1.0) software for Rasch modeling was used to calibrate item difficulty and student ability estimates. The reliability and validity of the measurement instrument were tested and described through various fit test and indices, which provided scientific evidence for instrument modification.Table 3 presents summaries for all persons and items. In the table, Measure is the estimated measure (for persons) or calibration (for items). Generally, the measure value of items is set as 0. According to the table, the measure value of all persons is 1.94, which indicates the Rasch estimated ability of all subjects. The estimated ability score (1.94) is higher than the mean item difficulty, indicating that the measurement instrument is easy for random selected students. Error is the standard error of the estimate, reflecting the accuracy of parameter estimation. The closer Error is to 0, the better. Person ability error is 0.52, while item difficulty error is 0.30, indicating that the instrument needs to be rectified (Linacre, 2006; Liu, 2007, 2010).
| Measure | Error | Infit | Outfit | Separation | Reliability | ||||
|---|---|---|---|---|---|---|---|---|---|
| MNSQ | ZSTD | MNSQ | ZSTD | ||||||
| First-round | Person | 1.94 | 0.52 | 0.87 | −0.3 | 1.18 | 0.1 | 1.39 | 0.66 |
| Item | 0.00 | 0.30 | 1.00 | −0.1 | 1.18 | 0.3 | 2.76 | 0.88 | |
From Table 3, the person separation index is 1.39, with a corresponding person reliability coefficient of 0.66. The item separation index is 2.76, and the item reliability coefficient is 0.88. Generally, a separation index greater than two is considered adequate (Duncan et al., 2003). Although the person values are acceptable and the item values represent a good level (Duncan et al., 2003), the separation index of person is lower than 2.00, which needs to be considered.
Based on Linacre's suggestion (Linacre, 2011), items fit the model when the item’s MNSQ falls within the range of 0.5 to 1.5, and the ZSTD value is within the range of −2 to +2 (Liu, 2007, 2010). As shown in Table 3, the overall fit index is acceptable based on a criterion of MNSQ (both INFIT and OUTFIT) > 0.70 and < 1.3, and a criterion of ZSTD (both INFIT and OUTFIT) within 2.0. Overall, the data fit the Rasch model well, and the initial instrument is reliable and acceptable for student CSRA measurement. However, further analysis of each separate item is necessary for instrument optimization.
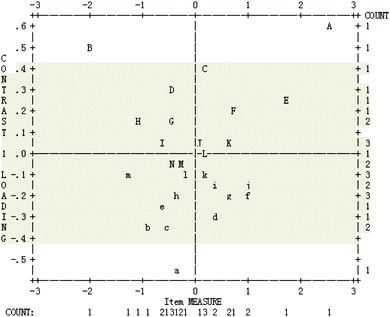
The loading scatterplot of principal components analysis of the residuals is presented in Fig. 3. Principal component plots of item loadings show the contrasts by plotting the loading on each component against the item calibration. The contrast shows items with different residual patterns (Linacre, 2006). Horizontal axis is estimated item difficulty in the Rasch scale, which has been extracted from the data prior to the analysis of residuals. The left hand vertical axis is correlation coefficient between student item scores and another potential construct after the primary construct, i.e. chemical symbol representation abilities, is controlled. The right hand vertical axis is the frequency of items with a particular correlation coefficient on the left hand vertical axis and item difficulty on the horizontal axis; and letters in the box represent different items. When all items have a contrast loading within the range of −0.4 to +0.4, which means that after the measured construct is controlled, there does not seem to be another strong construct measured by the instrument. According to Fig. 3, three items are beyond the range: A – PS27, B – PS05, a – PS18, indicating that they need to be reconsidered for analysis. Overall, it is considered that the data meet the unidimensionality requirement, thus also the local independence requirement, which provides evidence for the construct validity of the instrument (Linacre, 2006; Liu, 2007, 2010).
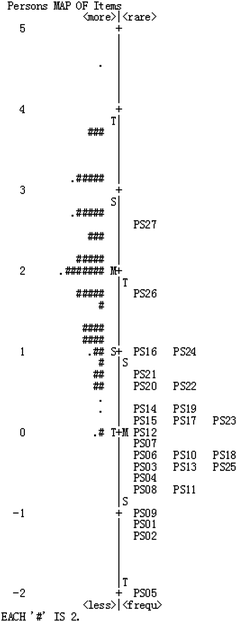
Fig. 4 shows the combined person and item estimate map (Wright map). A person and item estimate map shows the locations of item and person parameter estimates along a logit interval scale. On the left hand side we see how students' ability estimates distribute, and each “#” represents two respondents. On the right hand side the map shows how the items distribute from the easiest to most difficult. The left map of this figure shows that person ability formed approximately a normal distribution, and the distributions of item difficulty estimates and person ability almost overlap. However, the person ability estimates located higher than items’ indicates that the items are easy for those participants overall, and the corresponding items from this instrument could not evaluate some students with higher chemical symbol representation abilities (Linacre, 2006; Liu, 2007, 2010). Moreover, some item difficulties are inconsistent with the initial design. For example, we assumed PS9 and PS11 to belong to level 2, while the results of the test show that they are level 1; items PS23 and PS25 were assumed to be level 4, but they are located in level 2 and 3 from this figure. Therefore, the instrument should be rectified by increasing the difficulty of some items to match more students.
The fit statistics for the 27 items in the instrument are presented in Table 4 (columns 3 to 8). Item fit indicates the fitting degree between actual characteristics of items and expected characteristics of the Rasch model. From Table 4, item difficulties measured in the Rasch range from −2.00 to 2.50. Moreover, the S.E.s for all items are below 1.0, ranging from 0.10 to 0.59; three items (PS05, PS02, and PS01) have bigger values than the others do, but all of them are acceptable based on the index criterion above (S.E. stands for standard error of the estimated difficulty measure). Mostly, the Infit and Outfit index of items are acceptable, except that the Outfit index of some items (i.e. PS05, PS09, PS10, PS18, PS19, PS26, and PS27) could be misfit according to the criteria presented before. PTMEA CORR. refers to partial correlation between students' scores on the item and their total test scores; the higher and more positive the correlation is the better (Linacre, 2006; Liu, 2007, 2010). All partial correlations are positive and are reasonably large, ranging from 0.10 to 0.87, except PS05 and PS18. Overall, the data in Table 4 fit the model, while some items need to be revised or improved.
| Item | Measure | S.E. | Infit | Outfit | PTMEA CORR. | ||
|---|---|---|---|---|---|---|---|
| MNSQ | ZSTD | MNSQ | ZSTD | ||||
| PS27 | 2.50 | 0.10 | 0.80 | −1.80 | 0.50 | −2.40 | 0.87 |
| PS26 | 1.73 | 0.10 | 0.85 | −3.00 | 0.54 | −3.70 | 0.85 |
| PS16 | 0.96 | 0.23 | 1.12 | 1.20 | 1.30 | 1.80 | 0.23 |
| PS24 | 0.96 | 0.23 | 0.96 | −0.40 | 0.87 | −0.80 | 0.43 |
| PS21 | 0.75 | 0.23 | 1.10 | 0.90 | 1.16 | 0.90 | 0.26 |
| PS22 | 0.64 | 0.24 | 0.87 | −1.20 | 0.91 | −0.40 | 0.47 |
| PS20 | 0.63 | 0.24 | 1.04 | 0.40 | 1.09 | 0.50 | 0.31 |
| PS14 | 0.34 | 0.25 | 1.19 | 1.40 | 1.02 | 2.00 | 0.10 |
| PS19 | 0.34 | 0.25 | 1.19 | 1.30 | 1.41 | 1.60 | 0.12 |
| PS15 | 0.21 | 0.26 | 1.04 | 0.30 | 1.31 | 1.20 | 0.24 |
| PS17 | 0.21 | 0.26 | 1.01 | 0.10 | 1.09 | 0.40 | 0.28 |
| PS23 | 0.21 | 0.26 | 0.97 | −0.1 | 0.99 | 0.00 | 0.33 |
| PS12 | 0.06 | 0.27 | 1.17 | 1.00 | 1.24 | 0.90 | 0.14 |
| PS07 | −0.18 | 0.29 | 1.09 | 0.50 | 1.18 | 1.90 | 0.12 |
| PS0 | −0.26 | 0.30 | 0.89 | −0.50 | 0.71 | −0.80 | 0.40 |
| PS10 | −0.26 | 0.30 | 1.15 | 0.80 | 1.94 | 2.30 | 0.03 |
| PS18 | −0.35 | 0.31 | 1.22 | 1.10 | 1.61 | 1.60 | −0.01 |
| PS25 | −0.42 | 0.22 | 0.79 | −1.30 | 0.66 | −1.60 | 0.55 |
| PS03 | −0.45 | 0.31 | 0.93 | −0.20 | 0.79 | −0.50 | 0.33 |
| PS13 | −0.45 | 0.32 | 1.02 | 0.20 | 1.22 | 0.70 | 0.20 |
| PS04 | −0.56 | 0.33 | 1.02 | 0.20 | 1.21 | 0.20 | 0.18 |
| PS08 | −0.67 | 0.34 | 1.02 | 0.20 | 0.95 | 0.00 | 0.22 |
| PS11 | −0.67 | 0.34 | 1.05 | 0.30 | 1.24 | 0.70 | 0.15 |
| PS09 | −0.93 | 0.38 | 1.05 | 0.30 | 1.57 | 1.20 | 0.09 |
| PS01 | −1.08 | 0.40 | 0.92 | −0.10 | 0.92 | −0.90 | 0.33 |
| PS02 | −1.25 | 0.43 | 0.96 | 0.00 | 0.60 | −0.60 | 0.27 |
| PS05 | −2.00 | 0.59 | 1.06 | 0.30 | 2.29 | 1.40 | −0.02 |
Item modification
The data analysis of the first-round test suggests that there are some items that need to be revised although the instrument was found to be relatively accurate in terms of its goal to measure student's chemical symbol representation abilities, so this part is to discuss the modification of the initial instrument.The data analysis of the first-round test points out a number of weak items of low quality. For instance, PS05, a multiple-choice question with 4 choices, has the lowest measure value and negative PTMEA CORR. There were no students who chose option D, with only a few students choosing options A and B. This suggests that the options are either unnecessary or redundant. What's more, item PS05 is found to have failed to meet the unidimensionality requirement, and the contrast loading is out of range. Therefore, this item is eliminated during the modification of the initial instrument.
Like PS05, some options of the multiple-choice questions are weak in terms of discrimination, suggesting that the options should be removed or revised. For instance, in item PS13, only one student chose option A. As the atomic structure diagram of A refers to magnesium, which is a kind of metal that cannot react with metal sodium, it is easy for subjects to identify and then exclude the other choices. Consequently, as is shown below, the distractor has been designed to replace the premier one in the second-round test.
PS13: among the structure diagrams as follows, which particle is the most reactive with sodium?
S08: among the structure diagrams as follows, which particle is the most reactive with sodium?
The modified option A has targeted 5% students during the second-round test. In addition, as shown in Table 5, the PTMEA CORR. index of this item has increased from 0.20 to 0.34.
| Item | Options | Score | Count | % | Measure | S.E. | Outfit MNSQ | PTMEA CORR. |
|---|---|---|---|---|---|---|---|---|
| PS13 | A | 0 | 1 | 1 | 0.98 | 0.5 | −0.10 | |
| C | 0 | 6 | 6 | 1.37 | 0.43 | 1.1 | −0.15 | |
| D | 0 | 5 | 5 | 1.53 | 0.52 | 1.5 | −0.10 | |
| B | 1 | 95 | 89 | 2.01 | 0.09 | 1.0 | 0.20 | |
| S08 | C | 0 | 10 | 8 | 0.53 | 0.27 | 0.9 | −0.23 |
| D | 0 | 11 | 9 | 0.76 | 0.41 | 1.4 | −0.17 | |
| A | 0 | 7 | 5 | 0.76 | 0.64 | 0.9 | −0.12 | |
| B | 1 | 84 | 78 | 1.52 | 0.11 | 1.0 | 0.34 | |
Some items are found to be inconsistent with the presupposed level, because the options give subjects hint or clues to the answers. Given this, reorganizing or redesigning the multiple-choice question (i.e. PS23 for the first-round test) into a constructed-response question (accordingly, S18 for the second-round test) has been taken into consideration.
What's more, reading difficulty is one of the most important factors that influence learners' comprehension of texts (Kahveci, 2010). The item expression can be an obstacle to solve a problem. Accordingly, some items need to be checked regarding the quality of the language in terms of accuracy or precision.
Besides the modification of items, we also re-assessed the validity of the initial levels of CSRA or the initial defined level of each item before we proceeded to adjust the measurement framework, or the presupposition level of some items.
Some items were found to have failed to match the presupposed levels, probably because the presupposed ability level of the item was unreasonable. In other words, solving the item actually represents different levels of students CSRA. PS16 (labelled in the first-round test) is such an item shown as follows.
It is known that the valence of Fe is 3 in MFe2Oy, which of the following statements is correct (
![[thin space (1/6-em)]](https://www.rsc.org/images/entities/char_2009.gif) )
)
A. SO2 is a catalyst in the reaction
B. MFe2Ox undergoes a reduction reaction
C. y > x
D. SO2 decomposes in the reaction
This item is set up to examine if students can explain the composition of matter and changes from the perspective of valence, belonging to level 2. The data result of the first-round test has shown a higher level (approached to level 3), according to Fig. 4. Through careful reconsideration, this item requires students' understanding of matter changes from the perspective of valence, which represents the ability to use symbols as an intermediary. Accordingly, this item is adjusted to level 3.
The same group of experts for the examination of the original items has reviewed the modified instrument again to ensure the content and face validity. Finally, through the modification and review process, the instrument for the second round of test includes 20 items (shown in Appendix 3, note that the original Chinese-version instrument has been translated into English for reporting in the journal). The constructed-response questions (S18–S20) were scored by rating scales.
Results: data analysis of the second-round test
During the data analysis of the second test, two raters (both are doctorate candidates majoring in chemistry education) have participated in the scoring process. Through rater reliability check, the acceptable coefficient of agreement (S18, kappa = 1.00; S19, kappa = 0.91; S20, kappa = 0.86) indicates that the scoring criteria of the constructed-response questions are reliable.Firstly, the same as the first test, data files of student's scores were established for Rasch analysis. The summaries for all persons and items are shown in Table 6. Through comparing the results of the two rounds of test, the error of person ability and item difficulty both decline, while separation and reliability indices for both persons and items increase. All these indices are close to the ideal values in the second test; although the person separation is lower than 2.00, the modified instrument has been improved, and become more reliable and acceptable.
| Measure | Error | Infit | Outfit | Separation | Reliability | ||||
|---|---|---|---|---|---|---|---|---|---|
| MNSQ | ZSTD | MNSQ | ZSTD | ||||||
| Second-round | Person | 1.31 | 0.42 | 0.87 | −0.3 | 1.11 | 0.1 | 1.80 | 0.76 |
| Item | 0.00 | 0.24 | 1.00 | 0.0 | 1.11 | 0.2 | 3.36 | 0.92 | |
As shown in Fig. 5, only two items are beyond the −0.4 to +0.4 range: A – S20 and B – S12, indicating that most of the items meet the unidimensional requirement.
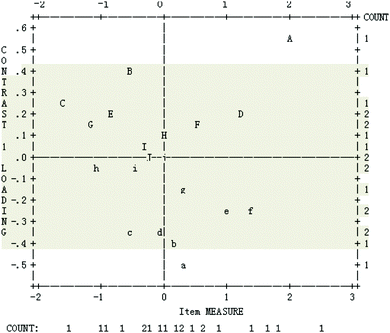 | ||
| Fig. 5 Contrast loadings of residuals (standardized residual contrast plot) (the second-round test). | ||
Fig. 6 shows that the distribution of 20 items in terms of difficulty estimates and person ability is better than the initial instrument. It can be seen that the modified instrument has an adequate coverage, and the above patterns are consistent with the fit theory of Rasch modeling.
Table 7 (columns 3 to 8) presents fit statistics for the 20 items in the instrument. The S.E.s for all items range from 0.10 to 0.38, lower than the first-round test. Mostly, the Infit and Outfit index of items are acceptable, except for S20 and S06. All partial correlations are positive and are reasonably large, ranging from 0.14 to 0.85.
| Item | Measure | S.E. | Infit | Outfit | PTMEA CORR. | ||
|---|---|---|---|---|---|---|---|
| MNSQ | ZSTD | MNSQ | ZSTD | ||||
| S20 | 2.00 | 0.11 | 0.66 | −2.10 | 0.64 | −2.10 | 0.85 |
| S19 | 1.36 | 0.10 | 0.71 | −1.60 | 0.71 | −1.40 | 0.82 |
| S18 | 1.21 | 0.11 | 0.78 | −1.80 | 0.79 | −1.60 | 0.74 |
| S17 | 0.98 | 0.21 | 1.05 | 0.70 | 1.13 | 1.00 | 0.35 |
| S16 | 0.53 | 0.22 | 1.11 | 1.10 | 1.48 | 1.70 | 0.26 |
| S12 | 0.29 | 0.22 | 1.07 | 0.60 | 0.95 | −0.20 | 0.33 |
| S15 | 0.29 | 0.22 | 1.09 | 0.20 | 1.00 | 0.10 | 0.31 |
| S11 | 0.14 | 0.23 | 1.13 | 0.20 | 1.13 | 0.70 | 0.25 |
| S14 | 0.03 | 0.23 | 0.92 | −0.70 | 0.81 | −0.80 | 0.44 |
| S13 | −0.02 | 0.23 | 1.09 | 0.60 | 1.13 | 0.60 | 0.26 |
| S08 | −0.08 | 0.24 | 0.99 | 0.00 | 1.04 | 0.20 | 0.34 |
| S09 | −0.25 | 0.25 | 1.04 | 0.10 | 1.31 | 0.20 | 0.19 |
| S06 | −0.32 | 0.25 | 1.20 | 1.30 | 2.00 | 1.80 | 0.37 |
| S07 | −0.44 | 0.26 | 1.12 | 0.90 | 1.25 | 1.50 | 0.16 |
| S04 | −0.51 | 0.26 | 0.93 | −0.40 | 1.07 | 0.30 | 0.33 |
| S10 | −0.51 | 0.26 | 1.03 | 0.20 | 1.22 | 0.80 | 0.26 |
| S05 | −0.81 | 0.28 | 1.11 | 0.60 | 1.71 | 0.80 | 0.14 |
| S03 | −1.07 | 0.31 | 1.08 | 0.40 | 1.26 | 1.30 | 0.14 |
| S02 | −1.17 | 0.32 | 0.85 | −0.20 | 0.76 | −0.50 | 0.31 |
| S01 | −1.65 | 0.38 | 0.94 | −0.10 | 0.76 | −0.50 | 0.28 |
As a result, these entire indices demonstrate the improved quality of the modified measurement instrument, as it can well target students' chemical symbol representation abilities with an acceptable degree of reliability, while the different ability levels of students are obvious and discriminable. Therefore, the instrument can be applied in the exploration study with larger samples (which will be reported in another paper).
The mean scores (measures in the logit scale) of each level in this study have been calculated, as shown in Table 8, and we define the average value of these items belonging to each level as the threshold value of four levels. Accordingly, we can divide students' performance into four levels. For instance, if students' ability measures are higher than 0.21 (the threshold value of level 3), we would define that they have achieved Level 3 of CSRA. If their measures are lower than −1.04 (the threshold value of level 1), we would define it as an insufficient level of CSRA.
| Items, measures | Threshold value | |
|---|---|---|
| Level 1 | S01(−1.65), S02(−1.17), S03(−1.07), S04(−0.51), S05(−0.81) | −1.04 |
| Level 2 | S06(−0.32), S07(−0.44), S08(−0.08), S09(−0.25), S10(−0.51) | −0.32 |
| Level 3 | S11(0.14), S12(0.29), S13(−0.02), S14(0.03), S15(0.29), S16(0.53) | 0.21 |
| Level 4 | S17(0.98), S18(1.21), S19(1.36), S20(2.00) | 1.39 |
Conclusions and limitations
Our study has explored a new area of chemical symbol representation abilities (CSRA), to construct a measurement framework of this special ability in the chemistry discipline, and then use it to develop an instrument. Through two-rounds of test and Rasch analyses, we have improved our initial instrument based on empirically driven recommendations to delete some items, modify others, and even change our framework to elicit a valid, reliable and unidimensional measurement (Sondergeld and Johnson, 2014). All the analysis under the Rasch model, with the tables and figures above, demonstrate good reliability and validity of the measurement instrument based on the CSRA framework. And the items meet the unidimensional requirement which indicates a good measurement. The Infit and Outfit index of a few items are still out of the criteria, while others' are acceptable. Finally, we can target the different CSRA levels of students, which are obvious and discriminable based on the constructed framework.Accordingly, we have transferred the raw scores of students' performance into logarithmically scaled measures, and based on the four levels of the CSRA, we defined the threshold value for each level, as well as the ability measures' range. It should be noted that the threshold value will be different for another sample, due to their different ability measures, while the items in each CSRA level are certain. Therefore, we have obtained a well-targeted, reliable and valid instrument to assess and a well-defined framework to analyze students' CSRA.
The implication of this study is that people who devote themselves to science education would find a reliable and moderate framework for CSRA evaluation; not only can the assessment instrument be applied in the actual instruction evaluation, but also the research methods and perspectives. The application of Rasch model theory to the development of ability assessment, although not new, provides a practical example in the field of education evaluation. Perhaps this work will also act as a primer for science education researchers interested in measurement issues and specific ability, skill, or competence studies and provide a meaningful reference. This measurement framework and instrument for the CSRA may also find application in further exploration studies with larger samples, focusing on the chemical symbol representation abilities of high school students in different grades. Furthermore, we provided a raw score to the Rasch scale score conversion table for readers to use so that no Rasch analysis needs to be conducted by users (seen in Appendix 2). The comparison analyses will indicate the underlying characteristics of students' CSRA, with potential benefits for chemistry teaching and learning. The exploration study is one possible direction of our research, and it can also be viewed as another validation study of the modified instrument for the CSRA.
This study has some limitations. The prepared instrument is not good enough and it requires more rectification based on the data analysis, even though the tables and figures presented in the paper have depicted the good model-data-fit of the instrument. The flaws of these estimation results cannot be ignored, and the possible reasons could be the items' language, or the format, to name a few examples. Besides, the samples may also affect the power of our measurement. Since no cognitive interviews were conducted, it remains uncertain whether a student would interpret the items as intended, thus further studies using cognitive interviews may enhance the construct validity of the measures.
Sample selection is always a practical problem for educational research, as with any statistical analysis. In this study, due to the limited conditions, we chose participants from Jiangsu Province only, so that the statistical power would be affected. Although the Rasch measurement produces item difficulty and student ability estimates independent from each other, the potential problem with the convenient sample used in our study is that the variation in student abilities of the sample may not be wide enough to represent the variation of other student populations. In further study, we should select more students more randomly from different grades, different schools, and a wider socioeconomic range to increase the statistical power of our data. Thus, the results will be more forceful and convincing, and we may obtain more unexpected findings.
Conflicts of interest
There are no conflicts to declare.Appendix 1: the learning levels of CSRA
| Learning levels | Performance | Content knowledge |
|---|---|---|
| Level 1: connecting chemical symbols with the macro (identifying the objects, matters and phenomena that chemical symbols represent, write the basic symbols correctly.) |
♦ Writing corresponding elementary symbols correctly according to the information about elements, such as the four most abundant elements in the crust.
♦ Recognizing the element or the name of an elementary substance according to the symbol of the element, such as “Cu”, which can represent both the element and metal copper. |
⋄ Names and symbols of common elements
⋄ The general rules of writing element symbols ⋄ The macroscopic and microscopic meaning of element symbols |
|
♦ Writing corresponding chemical formulae correctly according to the information about chemical substances, such as the chemical formula of a salt.
♦ Recognizing the name and elementary composition of the substance represented by a chemical formula. |
⋄ Chemical formulae
⋄ The rules of writing chemical formulae |
|
|
♦ Writing chemical equations of common chemical reactions normally.
♦ Balancing chemical equations correctly. ♦ Describing the reactants, products and reaction conditions of chemical equations. ♦ Judging the type of chemical reaction, such as combination, decomposition, replacement, double decomposition according to chemical equations. |
⋄ The macroscopic meaning of chemical equations
⋄ The writing steps of chemical equations ⋄ Four basic types of chemical reactions |
|
| Level 2: understanding the submicro meaning of chemical symbols (representing the microstructure of atoms, molecules and ions using chemical symbols; describing the microscopic meaning expressed by chemical symbols) |
♦ Knowing that the elementary symbol can mean an atom of the element and the number in front of the symbol means the atom's number.
♦ Understanding the meaning of the numbers in isotopic symbols. ♦ Understanding the meaning of the numbers in chemical equations. |
⋄ The microscopic meaning of elementary symbols
⋄ The representation method of isotopes ⋄ The microscopic meaning of chemical equations |
|
♦ Analyzing the bonding characteristics of carbon atoms in organic compounds according to the atomic structure diagram of carbon.
♦ Writing the symbols of functional groups and the structural formulae of typical representatives in organic compounds. ♦ Writing condensed structural formulae or simplest formulae according to structural formulae. ♦ Understanding the meaning represented by the ball-and-stick model and scale model, and drawing ball-and-stick models of simple organic compounds. ♦ Inferring the general formula according to the carbon skeleton and functional group in the molecule. |
⋄ Molecular formulae, simplest formulae (empirical formulae), structural formulae
⋄ The bonding characteristics of carbon atoms in organic compounds ⋄ The symbols of common functional groups in organic compounds (carbon–carbon double bond, carbon–carbon triple bond, halogen atoms, alcohol, aldehyde, carbonyl, carboxyl, nitrocellulose, amino and so on) ⋄ The structural formulae of typical representatives (methane, ethylene, acetylene, benzene, ethyl bromide, ethanol, aldehyde, phenol, ether, acetone, acetic acid, ethyl acetate and so on) ⋄ Ball-and-stick model, scale model ⋄ The general formula |
|
|
♦ Drawing the atomic structure diagram of common atoms according to the number of extra-nuclear electron and the law of extra-nuclear electron configuration.
♦ Describing the stability of the structure, and the complexity of receiving and losing electrons according to the atomic structure. ♦ Drawing the ionic structure diagram, writing ionic symbols correctly and stating the meaning of ionic symbols. ♦ Representing the number of the outermost extra-nuclear electrons in an atom or ion using electronic formulae according to the structure of the atom or ion. |
⋄ The law of extra-nuclear electron configuration
⋄ The atomic structure diagram ⋄ The atomic structure features of typical metallic elements, non-metallic elements and noble-gas elements ⋄ The symbols of positive and negative ions, including the radical ions ⋄ Electronic formulae |
|
|
♦ Inferring the common valences of elements according to atomic structures.
♦ Writing the chemical formulae of matters according to the valences given or the ordinary valences of common elements and radicals. |
⋄ The relation of valence and atomic structure
⋄ The ordinary valences of common elements and radicals ⋄ Writing chemical formulae according to valences |
|
| Level 3: understanding and interpretating the transformation between macro and submicro representation of chemical symbols (transforming neatly among chemical objects, macro phenomenon, microstructure and theories represented by symbols as an intermediary; stating and explaining the principles of macro phenomena or progress from the point of microstructure or micro process) |
♦ Stating the nature of chemical change or mechanism of chemical reaction with a micro schematic diagram.
♦ Explaining the reason of mass conservation before and after chemical reaction from a molecular or atomic perspective. |
⋄ The microcosmic nature of chemical change |
|
♦ Calculating the mass percent of elements according to the chemical formula.
♦ Understanding the meaning of stoichiometric number in chemical equations. ♦ Calculating the molar relation of reactants and resultants according to the chemical equation. |
⋄ The relation of elementary mass ratio in chemical equations
⋄ The quantitative relation in chemical equations |
|
|
♦ Expressing the formative progress of ionic compounds and covalent compounds with electronic formulae; explaining the formation principles of ionic compounds and covalent compounds.
♦ Writing ionization equations of strong electrolytes and weak electrolytes; explaining the reason of conductivity difference between strong electrolytes and weak electrolytes. |
⋄ Electronic formulae of simple ionic compounds and covalent compounds
⋄ Ionization equations of strong electrolytes and weak electrolytes |
|
|
♦ Expressing chemical reactions containing ions with ionic equations and explaining the micro nature of the type of chemical reactions; understanding the meaning of the ionic equation and writing the corresponding chemical equation.
♦ Judging whether a reaction is an oxidation–reduction equation according to the valence change of the elements composing the matter. ♦ Representing the electronic transfer in an oxidation–reduction equation with the methods of “double track bridge” and “single track bridge”, explaining the nature of the oxidation–reduction equation; balancing oxidation–reduction equations based on the electronic transfer. ♦ Explaining the theory of a primary battery or electrolytic tank with the electrode reaction equation and battery reaction equation. ♦ Explaining the reason why a salt has different acid–base properties and the nature of saline hydrolysis with ionic equations of saline hydrolysis. ♦ Representing endothermic reactions and exothermic reactions with thermochemical equations, understanding the meaning of the stoichiometric number in thermochemical equations. |
⋄ Ionic equation and the meaning
⋄ Expressing oxidation–reduction equations with the methods of “double track bridge” and “single track bridge”, balancing oxidation–reduction equations ⋄ Electrode reaction equation, battery reaction equation ⋄ Ionic equations of saline hydrolysis ⋄ Thermochemical equation |
|
| Level 4: using chemical symbols for reasoning in chemistry problems (representing and analyzing chemistry problems with symbols; grasping the nature and inner connection of matters; generalizing characteristics and rules of property, structure and change; predicting the possibility; judging the reasonability etc.) | ♦ Transforming the written message of problems into a chemical symbolic message; analyzing and solving questions according to the qualitative and quantitative relation in symbolic messages. |
⋄ The qualitative and quantitative relation in chemical formulae
⋄ The qualitative and quantitative relation in chemical equations |
|
♦ Inferring, explaining and stating some chemical properties of elements based on the atomic structure diagram and electron configuration.
♦ Inferring oxidation and reduction of matters according to chemical equations. ♦ Explaining the physical properties based on the formative characteristics of ionic bonds, such as sodium chloride and cesium chloride. ♦ Drawing hydrogen bond expression of some molecules; explaining hydrogen bond's impact made on molecular properties; inferring some properties of the molecule. ♦ Predicting the properties of organic compounds according to the relation of functional groups in an organic molecule and properties |
⋄ Electron configuration
⋄ The relation of the atomic structure and elementary properties ⋄ The relation of chemical bonds and material properties ⋄ The relation of intermolecular forces and material properties ⋄ The relation of functional groups in an organic molecule and organic compound's properties ⋄ The mutual influence of perssads in an organic molecule |
|
| ♦ Drawing a concept map and representing the inner connection of chemical concepts or the mutual transformation of matters. |
⋄ The mutual transformation of element compounds
⋄ The inner connection of chemical concepts |
|
|
♦ Inferring the synthesis path of organic compounds with chemical symbols.
♦ Expressing chemical thinking, experimental design, the progress and outcome of experimental research with a chemical symbol system. |
⋄ Chemical symbol system
⋄ Chemical symbolic thinking |
|
Appendix 2: score conversion
| Score | Measure | S.E. | Normed (500/100) | S.E. |
|---|---|---|---|---|
| 0 | −5.06 × 10 | 1.66 | −272 | 240 |
| 1 | −3.78 | 0.85 | −117 | 113 |
| 2 | −2.97 | 0.58 | −19 | 80 |
| 3 | −2.45 | 0.47 | 44 | 67 |
| 4 | −2.04 | 0.41 | 94 | 59 |
| 5 | −1.69 | 0.37 | 136 | 54 |
| 6 | −1.38 | 0.34 | 173 | 51 |
| 7 | −1.10 | 0.32 | 208 | 48 |
| 8 | −0.84 | 0.31 | 240 | 46 |
| 9 | −0.59 | 0.29 | 270 | 45 |
| 10 | −0.35 | 0.28 | 299 | 44 |
| 11 | −0.12 | 0.27 | 327 | 42 |
| 12 | 0.10 | 0.26 | 353 | 41 |
| 13 | 0.31 | 0.26 | 379 | 40 |
| 14 | 0.51 | 0.25 | 404 | 39 |
| 15 | 0.71 | 0.25 | 428 | 39 |
| 16 | 0.91 | 0.24 | 452 | 39 |
| 17 | 1.11 | 0.24 | 476 | 39 |
| 18 | 1.30 | 0.24 | 499 | 39 |
| 19 | 1.50 | 0.24 | 523 | 39 |
| 20 | 1.70 | 0.24 | 547 | 39 |
| 21 | 1.90 | 0.25 | 571 | 40 |
| 22 | 2.11 | 0.26 | 596 | 41 |
| 23 | 2.33 | 0.29 | 624 | 44 |
| 24 | 2.58 | 0.32 | 655 | 49 |
| 25 | 2.89 | 0.39 | 692 | 56 |
| 26 | 3.29 | 0.49 | 741 | 69 |
| 27 | 3.90 | 0.68 | 814 | 92 |
| 28 | 4.99 | 1.04 | 946 | 135 |
| 29 | 6.62 × 10 | 1.79 | 1143 | 226 |
Appendix 3: test of chemical symbol representation abilities
School:_____ Class:_____ Name:_____ Student No.:This test has multiple choice questions and non-multiple choices questions. Please write your answers on the answer sheet. After the test, please hand in your test paper and the answer sheet.
Relative atomic mass of some elements: H-1, C-12, O-16, S-32, Ti-48, Fe-56.
Part I: multiple choice questions
Directions: there are seventeen questions in this section. For each question, there is only one correct choice. Please choose the one that you think is the best and write on your answer sheet.1. In the following groups, which one consists of all metal elements? (![[thin space (1/6-em)]](https://www.rsc.org/images/entities/char_2009.gif) )
)
A. Mg, Br, Fe
B. B, Si, Al
C. Hg, Au, Ag
D. Zn, Ba, Ne
2. Which one of the following statements represents the same substance in name, common name and chemical formula? (![[thin space (1/6-em)]](https://www.rsc.org/images/entities/char_2009.gif) )
)
A. Copper sulfate crystal, Blue vitriol, CuSO4
B. Potassium hydroxide, Caustic soda, KOH
C. Calcium hydroxide, Quicklime, Ca(OH)2
D. Sodium bicarbonate, Baking soda, NaHCO3
3. Which group in the following is listed in the order of acid, base and salt? (![[thin space (1/6-em)]](https://www.rsc.org/images/entities/char_2009.gif) )
)
A. H2SO4, Na2CO3, NaCl
B. NaHSO3, CaO, Na2SO4
C. HCl, Cu2(OH)2CO3, Na2CO3
D. CH3COOH, Ca(OH)2, NaCl
4. Which chemical equation written according to the given requirement is correct? (![[thin space (1/6-em)]](https://www.rsc.org/images/entities/char_2009.gif) )
)
B. Use magnesium carbonate to treat hyperacidity: MgCO3 + 2HCl = MgCl2 + H2O + CO2↑
C. Test whether the mixed gas contains carbon dioxide: CO2 + 2NaOH = Na2CO3 + H2O
D. Use hydrochloric acid to remove rust: FeO + 2HCl = FeCl2 + H2O
5. Which one of the following reactions belongs to metathesis reactions? (![[thin space (1/6-em)]](https://www.rsc.org/images/entities/char_2009.gif) )
)
A. NH4Cl + NaOH = NaCl + NH3↑ + H2O
6. It is known that 16O and 18O are two oxygen isotopes. Which of the following statements is TRUE? (![[thin space (1/6-em)]](https://www.rsc.org/images/entities/char_2009.gif) )
)
A. The 16O and 18O have different nuclear charge numbers
B. The 16O and 18O have different electron configurations
C. The same number of 16O2 and 18O2 molecules have the same number of oxygen atoms
D. The 16O and 18O have different numbers of neutrons
7. The figure below shows a molecular model of a substance. Which of the following cannot be inferred from this molecular structure? (![[thin space (1/6-em)]](https://www.rsc.org/images/entities/char_2009.gif) )
)
A. The constituent elements of this substance
B. The color and the smell of this substance
C. The chemical formula of this substance
D. The category of this substance
8. Among the structure diagrams as follows, which particle is the most reactive with sodium? (![[thin space (1/6-em)]](https://www.rsc.org/images/entities/char_2009.gif) )
)
9. The structure diagrams of the two particles X and Y are shown below. Which is the chemical formula of the compound formed by X and Y? (![[thin space (1/6-em)]](https://www.rsc.org/images/entities/char_2009.gif) )
)
10. Here are four groups below, and each group has two compounds. Which group has the same element with different chemical valences? (![[thin space (1/6-em)]](https://www.rsc.org/images/entities/char_2009.gif) )
)
A. KHSO4, SO3
B. KMnO4, CaMnO4
C. (NH4)2CO3, NH3
D. NaClO3, HClO3
11. Which of the following reactions corresponds to the microstructure change as shown. (![[thin space (1/6-em)]](https://www.rsc.org/images/entities/char_2009.gif) )
)
B. 2HI + Cl2 = 2HCl + I2
D. 2HCl + CuO = CuCl2 + H2O
12. Under a certain condition, two substances are fully reacted in a sealed container, and then cooled down to room temperature, finally we can get a pure substance in the sealed container. Which of the following options can fulfill the requirement above? (![[thin space (1/6-em)]](https://www.rsc.org/images/entities/char_2009.gif) )
)
A. H2 and O2 with the mass ratio of 1![[thin space (1/6-em)]](https://www.rsc.org/images/entities/char_2009.gif) :
:![[thin space (1/6-em)]](https://www.rsc.org/images/entities/char_2009.gif) 9
9
B. C and O2 with the mass ratio of 3![[thin space (1/6-em)]](https://www.rsc.org/images/entities/char_2009.gif) :
:![[thin space (1/6-em)]](https://www.rsc.org/images/entities/char_2009.gif) 4
4
C. C2H4 and O2 with the mass ratio of 1![[thin space (1/6-em)]](https://www.rsc.org/images/entities/char_2009.gif) :
:![[thin space (1/6-em)]](https://www.rsc.org/images/entities/char_2009.gif) 4
4
D. CO and O2 with the mass ratio of 7![[thin space (1/6-em)]](https://www.rsc.org/images/entities/char_2009.gif) :
:![[thin space (1/6-em)]](https://www.rsc.org/images/entities/char_2009.gif) 4
4
13. Which one of the following ionization equations is correct? (![[thin space (1/6-em)]](https://www.rsc.org/images/entities/char_2009.gif) )
)
A. NaHCO3 = Na+ + H+ + CO32−
B. HClO− = H+ + ClO−
C. NH3·H2O ⇌ NH4+ + OH−
D. H3PO4 ⇌ 3H+ + PO43−
14. There are two chemical reactions in the following options. Which can use the same ionic equation? (![[thin space (1/6-em)]](https://www.rsc.org/images/entities/char_2009.gif) )
)
A. HCl + Na2CO3; HCl + NaHCO3
B. KOH + CH3COONH4; Ba(OH)2 + NH4Cl
C. Ca(OH)2 + HCl; Ba(OH)2 + H2SO4
D. BaCl2 + Na2SO4; Ba(OH)2 + CuSO4
15. In the presence of a selected catalyst, nitrogen and hydrogen can synthesize ammonia under the condition of high temperature and high pressure. N2, H2 and NH3 are, respectively, represented by “ ”. Please observe the following figures. Which order is in line with the ammonia synthesis process at the surface of the catalyst? (
![[thin space (1/6-em)]](https://www.rsc.org/images/entities/char_2009.gif) )
)
16. MFe2Ox is a new nanomaterial (3 < x < 4), where M is a two-valence metallic element. At room temperature, MFe2Ox can transform the industrial waste gas SO2 into S, and the valence of M is constant in the reaction. The conversion process is shown below:
It is known that the valence of Fe is 3 in MFe2Oy, which of the following statements is correct? (![[thin space (1/6-em)]](https://www.rsc.org/images/entities/char_2009.gif) )
)
A. SO2 is a catalyst in the reaction
B. MFe2Ox undergoes a reduction reaction
C. y > x
D. SO2 decomposes in the reaction
17. At room temperature, when a small amount of FeSO4 solution is added to H2O2 solution, two reactions occur as follows: 2Fe2+ + H2O2 + 2H+ = 2Fe3+ + 2H2O, 2Fe3+ + H2O2 = 2Fe2+ + O2↑ + 2H+. Which of the following statements is correct? (![[thin space (1/6-em)]](https://www.rsc.org/images/entities/char_2009.gif) )
)
A. H2O2 gains the electron more easily than Fe3+, and loses the electron more difficultly than Fe2+.
B. During the decomposition of H2O2, the pH of the solution decreases.
C. FeSO4 is the catalyst of this decomposition reaction.
D. H2O2 can be oxidized, because the valence of the oxygen is −1 and can increase; it also can be reduced, because the valence of the hydrogen is +1 and can decrease.
Part II: non-multiple choices
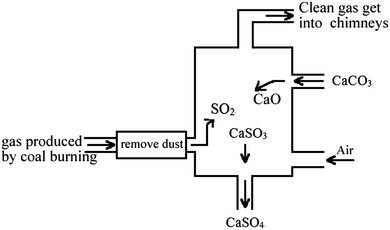
Directions: there are three comprehensive questions in this part. Please write down your answers on the answer sheet according to the given requirements.18. The figure below shows a schematic diagram of a device that describes the treatment of waste gas from a coal-fired power plant. Please write down all the chemical reactions that take place in the figure.
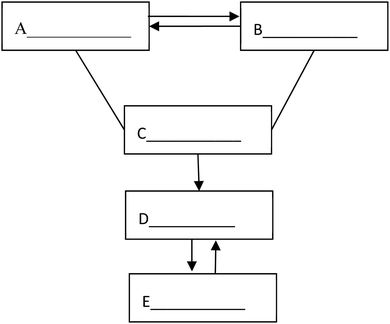
19. The following figure shows the relationship between the five different types of substances: elementary substance, oxide, acid, alkali and salt. “—” (line) means that the two substances connected can react, and “→” (arrow) means that a substance can be converted into another one. Please fill in the blanks with the chemical formula of specific substances of the five categories.
20. Experimental designs or thinking processes are usually represented by process charts and chemical symbols in chemistry. The following process chart shows us an experiment procedure, which introduces how to separate Au and Cu from some mixed metal powder.
Supposed that there is some waste liquid from the processing of the photographic films, which contains lots of Ag+, Zn2+ and Fe2+. And you want to recover silver (main product) and ferrous sulfate crystals (by-product) from the waste liquid, draw a process chart and use chemical symbols to describe your experimental design.
Acknowledgements
This paper is the result of work on the project funded by MOE Key Research Institute of Humanities and Social Sciences, Key Subject Construction Project of East China Normal University.References
- Anderson L. W. and Krathwohl D. R. (ed.), (2001), A taxonomy for learning, teaching, and assessing: a revision of bloom's taxonomy of educational outcomes, New York, NY, Longman.
- Biggs J. B., (1999), Teaching for quality learning at university: what the student does, Buckingham: The Society for Research into Higher Education and Open University Press.
- Biggs J. B., (2003), Teaching for quality learning at university, Maidenhead: Open University Press.
- Biggs J. B. and Collis K. F., (1982), Evaluating the quality of learning: the SOLO taxonomy (Structure of the Observed Learning Outcome), New York, Academic Press.
- Bloom B. S., (1956), Taxonomy of educational objectives: the classification of educational goals, David Mckay Company, Inc., New York.
- Chan D. W., (2010), Developing the impossible figures task to assess visual-spatial talents among Chinese students: a Rasch measurement model analysis, Gifted Child Quart., 54(1), 59–71.
- Chick H. L., (1998), Cognition in the formal modes: research mathematics and the SOLO taxonomy, Math. Educ. Res. J., 10(2), 4–26.
- Dori Y. J. and Hameiri M., (2003), Multidimensional analysis system for quantitative chemistry problems: symbol, macro, micro, and process aspects, J. Res. Sci. Teach., 40(3), 278–302.
- Duncan P., Bode R., Lai S. and Perera S., (2003), Rasch analysis of a new stroke-specific outcome scale: the stroke impact scale, Arch. Phys. Med. Rehab., 84, 950–963.
- Gilbert J. K. and Treagust D. F. (ed.), (2009), Multiple representations in chemical education.
- Gkitzia V., Salta K. and Tzougraki C., (2011), Development and application of suitable criteria for the evaluation of chemical representations in school textbooks, Chem. Educ. Res. Pract., 12, 5–14.
- Hambleton R. K., (2000), Emergence of item response modeling in instrument development and data analysis, Med. Care, 38(9), 60–65.
- Hazel E., Prosser M. and Trigwell K., (2002), Variation in learning orchestration in university biology courses, Int. J. Sci. Educ., 24(7), 737–751.
- Hoffmann R. and Laszlo P., (1991), Representation in chemistry, Angew. Chem., Int. Ed., 30, 1–16.
- Jaber L. Z. and BouJaoude S., (2012), A macro–micro–symbolic teaching to promote relational understanding of chemical reactions, Int. J. Sci. Educ., 34(7), 973–998.
- Jimoyiannis A., (2011), Using SOLO taxonomy to explore students' mental models of the programming variable and the assignment statement, Themes Sci. Technol. Educ., 4(2), 53–74.
- Johnstone A. H., (1982), Macro- and micro-chemistry, Sch. Sci. Rev., 64, 377–379.
- Johnstone A. H., (1991), Why is science difficult to learn? Things are seldom what they seem, Journal of computer assisted learning, 7(2), 75–83.
- Johnstone A. H., (2000), Teaching of chemistry – logical or psychological? Chem. Educ.: Res. Pract. Eur., 1, 9–15.
- Kahveci A., (2010), Quantitative analysis of science and chemistry textbooks for indicators of reform: a complementary perspective, Int. J. Sci. Educ., 32(11), 1495–1519.
- Keig P. F. and Rubba P. A., (1993), Translation of representations of the structure of matter and its relationship to reasoning, gender, spatial reasoning, and specific prior knowledge, J. Res. Sci. Teach., 30(8), 883–903.
- Kozma R. B. and Russell J., (1997), Multimedia and understanding: expert and novice responses to different representations of chemical phenomena, J. Res. Sci. Teach., 34(9), 949–968.
- Lang W. S. and Wilkerson J. R., (2008), Measuring teacher disposition with different item structures: an application of the Rasch model to a complex accreditation requirement. Online Submission.
- Lin, Y. I., Son, J. Y. and Rudd, J. A., (2016), Asymmetric translation between multiple representations in chemistry, Int. J. Sci. Educ., 38(4), 644–662.
- Linacre J. M., (2006), A user's guide to WINSTEPS/MINISTEP: Rasch-model computer programs, Chicago, IL: Winsteps.com.
- Linacre J. M., (2011), A user's guide to WINSTEPS/MINISTEP: Rasch-model computer programs, Chicago, IL: Winsteps.com.
- Liu X. F., (2007), Elementary to high school students’ growth over an academic year in understanding concepts of matter, J. Chem. Educ., 84(11), 1853–1856.
- Liu X. F., (2010), Using and developing measurement instruments in science education: a Rasch modeling approach, Charlotte, NC: Information Age.
- Mathewson J. H., (2005), The visual core of science: definitions and applications to education, Int. J. Sci. Educ., 27, 529–548.
- Milenkovic D. D., Segedinac M. D. and Hrin T. N., (2014), Increasing high school students' chemistry performance and reducing cognitive load through an instructional strategy based on the interaction of multiple levels of knowledge representation, Chem. Educ., 91, 1409–1416.
- Mok M. M. C., Cheong C. Y., Moore P. J. and Kennedy K. J., (2006), The development and validation of the self-directed learning scales (SLS), J. Appl. Meas., 4, 418–449.
- National Research Council, (2005), How students learn: science in the classroom, Washington, The National Academy Press.
- Niaz M., (1995), Cognitive conflict as a teaching strategy in solving chemistry problems: a dialectic-constructivist perspective, J. Res. Sci. Teach., 32, 959–970.
- Padiotis I. and Mikropoulos T. A., (2010), Using SOLO to evaluate an educational virtual environment in a technology education setting, Educ. Technol. Soc., 13(3), 233–245.
- Philipson S. N. and Tse A. K., (2007), Discovering patterns of achievement in Hong Kong students: an application of the Rasch measurement model, High Ability Students, 18(2), 173–190.
- Randall J., (2010), Using confirmatory factor analysis and the Rasch model to assess measurement invariance in a high stakes reading assessment, Appl. Meas. Educ., 23, 286–306.
- Sim J. H. and Daniel E. G. S., (2014), Representational competence in chemistry: a comparison between students with different levels of understanding of basic chemical concepts and chemical representations, Cogent Education, 1, 991180.
- Smith E. V., (2002), Detecting and evaluating the impact of multidimensionality using item fit statistics and principal component analyses of residuals, J. Appl. Meas., 3(2), 205–231.
- Sondergeld T. A. and Johnson C. C., (2014), Using Rasch measurement for the development and use of affective assessments in Science Education Research, Sci. Educ., 98(4), 581–613.
- Su K. D., (2016), Strengthening strategic applications of problem-solving skills for Taiwan students' Chemistry understanding, J. Balt. Sci. Educ., 15(6), 662–679.
- Taber K. S., (2013), Revisiting the chemistry triplet: drawing upon the nature of chemical knowledge and the psychology of learning to inform chemistry education, Chem. Educ. Res. Pract., 14(2), 156–168.
- Talanquer V., (2011), Macro, submicro, and symbolic: the many faces of the chemistry ‘triplet’, Int. J. Sci. Educ., 33(2), 179–195.
- Treagust D., Chittleborough G. and Mamiala T., (2003), The role of submicroscopic and symbolic representations in chemical explanations, Int. J. Sci. Educ., 25(11), 1353–1368.
- Wei S. L., (2011), Using Rasch modeling to develop computer modeling-based instruments for measuring middle school students' conceptual understanding of structure of matter, Published Doctoral Dissertation, Shanghai, East China Normal University, in Chinese.
- Wei S. L., Liu X. F., Wang Z. H. and Wang X. Q., (2012), Using Rasch measurement to develop a computer modeling-based instrument to assess students' conceptual understanding of matter, J. Chem. Educ., 89, 335–345.
- Wilson M., (2005), Constructing measures: an item response modeling approach, Mahwah, New Jersey, Lawrence Erlbaum Associates, p. 228.
- Wilson M. and Draney K., (2002), A technique for setting standards and maintaining them over time, in Nishisato S., Baba Y., Bozdogan H. and Kanefugi K. (ed.), Measurement and multivariate analysis (Proceedings of the international conference on measurement and multivariate analysis, Banff, Canada, May 12–14, 2000, pp. 325–332), Tokyo, Springer-Verlag.
- Wright B. D., (1997), A history of social science measurement, Educ. Meas.: Issues Pract., 16(4), 33–45.
- Wright B. D. and Stone M. H., (1979), Best test design: Rasch measurement, Chicago, MESA Press.
- Wu H. K. and Shah P., (2004), Exploring visuospatial thinking in chemistry learning, Sci. Educ., 88, 465–492.
| This journal is © The Royal Society of Chemistry 2017 |

