
Energetics of cellulose and cyclodextrin glycosidic bond cleavage†
Cheng
Zhu
,
Christoph
Krumm
,
Gregory G.
Facas
,
Matthew
Neurock
and
Paul J.
Dauenhauer
 *
*
Department of Chemical Engineering and Materials Science, University of Minnesota, 421 Washington Ave. SE, 484 Amundson Hall, Minneapolis, MN 55455, USA. E-mail: hauer@umn.edu
First published on 6th January 2017
Abstract
Thermochemical conversion of lignocellulosic materials for production of biofuels and renewable chemicals utilizes high temperature to thermally decompose long-chain cellulose to volatile organic compounds. Cellulose undergoes two distinct kinetic regimes of intra-chain scission: low-temperature glycosidic bond cleavage (T < 467 °C) associated with a low apparent activation energy and high-temperature glycosidic bond cleavage (T > 467 °C) associated with a high apparent activation energy. In this work, the initial breakdown kinetics of cellulose were examined from 385 °C to 505 °C using a millisecond, thin-film reactor called PHASR (pulse-heated analysis of solid/surface reactions). Using the cellulose surrogate, α-cyclodextrin, the energetics of each kinetic regime were characterized by measuring the conversion between 20 ms and 2.0 seconds. The low temperature kinetic regime exhibited glycosidic bond cleavage (Ea,1 = 23.2 ± 1.9 kcal mol−1, k0,1 = 2.0 × 10⁷ s−1), while the high temperature kinetic regime (Ea,2 = 53.7 ± 1.1 kcal mol−1, k0,2 = 2.4 × 10¹⁶ s−1) was consistent with four reaction mechanisms including concerted transglycosylation. Apparent energetics were compared with computed literature values.
1. Introduction
Thermochemical conversion of lignocellulosic biomass to renewable transportation fuels occurs at high temperatures (300–800 °C) to decompose large biopolymers (20![[thin space (1/6-em)]](https://www.rsc.org/images/entities/char_2009.gif) 000 to 400000 a.m.u.) into smaller molecules with higher stability and energy content.1 Gasification above 800 °C produces one-carbon synthesis gas products, while pyrolysis targets C2–C6 organic compounds which condense to a moderately stable liquid referred to as ‘bio-oil’.2,3 While existing thermochemical processes are potentially economical,4,5 widespread implementation requires detailed design based on detailed understanding of the molecular reactions of biomass.6
000 to 400000 a.m.u.) into smaller molecules with higher stability and energy content.1 Gasification above 800 °C produces one-carbon synthesis gas products, while pyrolysis targets C2–C6 organic compounds which condense to a moderately stable liquid referred to as ‘bio-oil’.2,3 While existing thermochemical processes are potentially economical,4,5 widespread implementation requires detailed design based on detailed understanding of the molecular reactions of biomass.6
Cellulose is the primary component of lignocellulose, comprising over 50% of common biomass feedstocks considered for renewable energy applications. Cellulose is a linear homopolymer of glucose monomers formed by condensation polymerization; β-(1-4) glycosidic bonds connect monomers forming long chains which crystallize into dense sheets.7 Thermal fragmentation above 300 °C produces aerosols8 and hundreds of volatile organic compounds including anhydrosugars, furans, pyrans, permanent gases, and light oxygenates such as glycolaldehyde or 2,3-butanedione.9,10 At lower temperatures (<400 °C), increased char formation is observed,11 while cellulose rapidly liquefies and evaporates near 500 °C where optimum yield of volatile organic compounds is obtained.12–15
While numerous kinetic models have been proposed to characterize cellulose decomposition, the specific chemical reaction mechanisms to form volatile components remain unknown. Global kinetic models comprised of lumped species organized by phase (e.g. solid char, intermediate ‘active’ cellulose) characterize the overall conversion of cellulose, but a broad range of fitted kinetic parameters (activation energies, Ea, of 10 to 63 kcal mol−1) indicate that lumped models are too simple to capture the complexity of cellulose chemistry above 400 °C.16 More detailed molecular models have been proposed based on the formation of glucose via hydrolysis as a key intermediate for formation of light oxygenates, furans, pyrans and permanent gases.17–20 However, glucose has been shown to produce a substantially different distribution of products relative to cellulose,21 and glucose has not yet been observed as a reactive intermediate in cellulose decomposition. Moreover, development of molecular models of cellulose has utilized calculated activation energies and fitted model parameters. Due to the complexity of the chemistry and extent of unknown parameters, model comparison with cellulose product yields provides insufficient temporal detail for model development and validation.
Insight into the chemistry of cellulose decomposition has been gained from comparison of the pyrolysis product yields of cellodextrins. Pyrolysis of films of cellulose (10–20 μm thick) are sufficiently thin to undergo reaction without heat or mass transport limitations; organic vapors produced under thin film conditions are thus indicative only of the intrinsic cellulose chemistry.22 By thin-film pyrolysis of feedstocks which differ only by the linkage type (i.e. cellobiose and maltobiose, cellohexaose and maltohexaose), it is apparent that identical products are obtained from either feedstock; polysaccharides undergo the same mechanisms with either α-(1-4) or β-(1-4) glycosidic bonds.22 Another important insight was the observation that the pyrolysis product yields of cellulose and α-cyclodextrin, a six-monomer ring polysaccharide, were identical within experimental error.22 Thus, it is expected that the key cellulose pyrolysis reactions are initiated inside the chain and not at the polymer chain end (of which there are few in cellulose and zero in cyclodextrins).
Recent introduction of a new kinetics technique for characterization of time-resolved evolution of volatile organic products from cellulose at temperatures above 400 °C has revealed the existence of two kinetic regimes of cellulose glycosidic bond cleavage.23 Referred to as PHASR for “Pulse-Heated Analysis of Solid Reactions”, this method rapidly heats thin films of cellulose (>106 K min−1), maintains the cellulose film at a prescribed temperature (e.g. 460 °C), and then rapidly quenches. By this method, the products of cellulose pyrolysis including unreacted cellulose residue and volatile organic products are quantified for the prescribed reaction time, and the rate of biopolymer conversion and rate of formation of volatile organic compounds at high temperature materials is determined.
As shown previously and depicted in Fig. 1, PHASR kinetics of cellulose and its surrogate, α-cyclodextrin, indicate that cellulose conversion exhibits a distinct shift in the rate of conversion at 467 °C, a temperature referred to as the “Reactive Melting Point”, or TRM.23 Below TRM, initiation by glycosidic bond cleavage is slow, and the rate of volatile product (e.g. furans) formation was shown to match the rate of biopolymer conversion. When intra-chain scission is slow, formation of products such as furans was shown to occur predominately by end-chain mechanisms. In contrast, above TRM cellulose undergoes rapid intra-chain cleavage such that small, intermediate species are rapidly formed. Decomposition of the polymer forms a liquid intermediate phase faster than it can decompose and evaporate, thus resulting in multi-step sequential kinetics to form volatile products.
 | ||
| Fig. 1 Scheme of cellulose glycosidic bond cleavage near the reactive melting point, TRM.23 Cellulose glycosidic bond cleavage is proposed to occur by two competing mechanisms. Below TRM (467 °C), slow intra-chain cleavage produces cellulose fragments which decompose via chain-end mechanisms to volatile products and char. Above TRM, rapid intra-chain cleavage rapidly produces small-molecule intermediates which react to volatile products. | ||
In this work, the PHASR technique is utilized to measure the precise kinetics and associated energetics of glycosidic bond cleavage above and below the reactive melting point of cellulose. Initial experiments validate the use of α-cyclodextrin as a kinetic surrogate of cellulose. Quantification of the conversion of α-cyclodextrin with time (20 ms to 2.0 s) for a range of temperatures (385–505 °C) enables fitting of first-order kinetic models, elucidation of reaction rate coefficients and determination of the apparent activation energy and associated pre-exponential factors for both kinetic regimes of cellulose cleavage.
2. Experimental methods
2.1 PHASR reactor
Precise temperature control of reacting cellulose and α-cyclodextrin films was achieved with the PHASR method, by which reactant samples were subjected to rapid thermal pulses for prescribed temperatures and time intervals. The PHASR reactor incorporated millisecond heating and cooling of samples with analytical integration for identification and quantification of gas and volatile products. The reactor housing, shown in Fig. 2A, combined an upper heating section with integrated electrical leads and optical temperature measurement and a lower cooling section with a microstructured heat exchanger for cooling. | ||
| Fig. 2 PHASR reactor diagram and method. A. Exploded diagram of the PHASR (pulse-heated analysis of solid reactions) system. Cellulose film samples on a heating element are attached to electrical leads within a helium-flow chamber; gas/vapor effluent flows into a gas chromatograph. A lower chamber contains continuously flowing silicon-based coolant. B. Gas flow chamber contains curved metal contacts connecting copper electrical leads and the heating element. Multiple layers of heating element, indium foil, aluminum nitride and a copper micro-channel cooling block transport heat between the gas and liquid chambers. Optical pyrometer in yellow measures the temperature at 1000 Hz. C. Top-down view of the heating element. D. Millisecond-duration pulses enable prescribed reaction times followed by rapid quenching to produce product vapors and quenched intermediate samples. E. Liquid chromatography of quenched intermediate samples of α-cyclodextrin reacted at 445 °C for sequential pulse lengths (20 ms to 2000 ms). | ||
The top and bottom sections of the PHASR reactor were custom machined from 316 stainless steel with micro-welded fittings for electrical feedthroughs (MPF Products Inc. PN: A1016-1-W) and the pyrometer (Swagelok UltraTorr, PN: SS-4-UT-A-4). The two reactor halves closed together with a custom-cut polytetrafluoroethylene (PTFE) gasket to form the reaction chamber, through which helium carrier gas flowed into the top portion of the reactor via an NPT fitting (Swagelok PN: SS-100-1-1) and out through a welded fitting (Vici Valco PN: ZLTA41). The bottom section of the PHASR reactor incorporated a custom micro-machined heat exchanger (MicroCooling Concepts, PN: SA-5A), through which high velocity heat transfer fluid (Dow Chemical, Syltherm-800) was pumped. The PHASR reactor was heated via five cartridge heaters (Omega, P/N: 00034) and a custom nozzle heater (Nexthermal) for complete transfer of volatile products to the gas chromatograph.
Inside the PHASR reaction chamber, shown in Fig. 2B and C, the electrical leads were connected to custom-machined and bent copper contacts, which pressed down onto the heating element to provide electrical contact. The custom cut heating elements were in thermal contact with the micro-machined heat exchanger across an aluminum nitride layer (Stellar Industries, PN: ALN 2.0′′ × 2.0′′ × 0.010′′), which electrically insulated the heating element from the reactor, and an optional indium foil layer (Indium Corporation, PN: Ribbonin-10101), which reduced cooling times by enabling improved thermal contact. During a thermal pulse, the indium foil melted (TM ∼ 250 °C) to form a molten interface between the heating element and the aluminum nitride layer, improving heat transfer. After a pulse, the indium layer re-solidified for easy sample removal.
Millisecond temperature control of reactant samples via electrical resistive heating was achieved using an integrated resistive heating power supply and 2000 Hz PID controller (Amada-Miyachi HF2 with IT-1140-T transformer) and an infrared optical pyrometer (Impac PN: IGA-50-LO with sapphire light pipe PN: LP2-18.5 mm), which measured the sample temperature via optical emission spectroscopy at 1000 Hz for feedback to the controller. The 0–20 mA output from the pyrometer was converted to a 0–10 V signal for feedback to the PID controlled using a signal converter (Phoenix Contact PN: 2811284). The pyrometer light pipe was inserted into the Swagelok UltraTorr fitting on the PHASR reactor to directly measure the sample temperature. Custom manufactured electrical leads connected the resistive heating transformer to the PHASR reactor using a bus-bar interconnect (Tyco Electronics PN: 6648234-1) which attached to the electrical feedthroughs.
The resistive heating power supply was operated in ‘dual-pulse’ mode; a first pulse with preset current and duration heated the sample above 250 °C, and a second pulse incorporated the PID feedback temperature to complete sample heating and held the sample at reaction temperature for a preset duration. At the completion of a pulse, the power supply turned off and the cooling system quenched the sample.
To achieve rapid cooling of PHASR samples, the Syltherm heat transfer fluid was circulated through the micro-machined heat exchanger. The silicon-based coolant was selected for its high thermal stability, ensuring rapid cooling after a pulse. Coolant temperature was held at 3 °C, and flow was maintained using a refrigerated circulating bath (Thermo-Fisher PN: Isotemp 4100, R20). During a thermal pulse, the overall coolant velocity was increased using an in-line booster pump (McMaster-Carr PN: ShurFlo 4272 K21). All components of the cooling loop were connected via 3/8′′ copper tubing.
The PHASR reactor was integrated with an Agilent 7890A gas chromatograph (GC) with Agilent 220 Ion Trap mass spectrometer (MS). The reactor was spliced between the helium electronic pressure controller (EPC) and the inlet. The outlet of the PHASR reactor fed directly into the Agilent split/splitless inlet via 1/16′′ stainless steel wide-bore tubing. Gas and volatile products that evolved from the reacting films were transferred to the GC, which contained a dual-column, dual-detector configuration with cryogenic focusing. First, products were transferred to an Agilent DB-5 column (320 μm × 30 m, 1.5 μm stationary phase), through which permanent gases (CO, CO2) rapidly eluted onto a second gas separation column (Agilent Plot-Q, 320 μm × 30 m, 20 μm stationary phase) via a GC-integrated switching valve (Vici Valco, 4 port). After gases were transferred to the secondary column, a valve switch sent all remaining eluents to a splitter, which split flow to a flame ionization detector (FID) for quantification and MS for identification. Permanent gases eluting from the Plot-Q column were quantified using thermal conductivity detector. Separation of gas and volatile products was performed using a 90 minutes GC method, which ramped from −30 °C to 260 °C.
To perform a PHASR reaction, a heating element containing a sample was loaded into the reactor, and the two reactor halves were sealed together. Cartridge heaters were pre-heated while the GC method was activated to begin helium flow through the reactor and cool the oven to cryogenic temperatures. Upon initiation of a PHASR reaction, current was applied to the resistive heating element to heat the sample to the desired reaction temperature in under 30 ms, after which sample temperature was maintained at the desired reaction temperature via PID feedback control for 0–2000 ms. At the completion of a PHASR pulse, the power supply turned off and the sample was rapidly quenched in under 150 ms via the high velocity coolant. Completion of the thermal pulse triggered the start of the GC/MS method, from which gas and volatile products evolving from the reactant sample during the thermal pulse were identified and quantified. PHASR pulses of increasing length were performed to quantify the evolution of products and the consumption of reactants, as depicted in Fig. 2D.
2.2 Cyclodextrin film preparation
PHASR samples were prepared via solvent deposition and drying on steel heating elements. PHASR heating elements were cleaned using a butane torch until they turned blue, after which they were allowed to sit for 24 hours. A 1.0 wt% solution of α-cyclodextrin in water was prepared and 5.0 μl pipetted onto the center of the heating element, corresponding to 50 μg of sample. Samples were then placed in a vacuum at 25 in Hg and held at 40 °C for 3 hours. In order to generate 100 μg samples, two solvent deposition and drying procedures were performed in series. This film preparation method generated a uniform, circular film 3 mm in diameter and 20 microns in thickness.2.3 Product analysis
Quantification of remaining α-cyclodextrin reactant after a pulse was performed via solvent extraction and liquid chromatography with light scattering detection. Heating elements containing partially reacted samples were removed from the PHASR reactor and cut into a small circle that contained only the sample film. The cut heating element was placed into a 1.5 ml PTFE filter vial (Whatman PN: UN203NPEPP). 300 μl of HPLC grade water was pipetted into each vial containing a heating element and vials were sonicated for five minutes to ensure complete dissolution of α-cyclodextrin. After sonication, the remaining metal heating element was removed from the vial and the filter plunger was depressed to remove any remaining particulate. 100 μl of filtered samples were injected into a high performance liquid chromatograph (HPLC, Shimadzu Prominence) with a carbohydrate separation column (Agilent Na Hi-Plex, PN: PL1171-6140) light scattering detector (ELSD-LTII) and water mobile phase. Quantification of the α-cyclodextrin peak from the ELSD for PHASR pulses of increasing length yielded the consumption of reactant with time, shown as a series of stacked chromatograms in Fig. 2E.3. Results
The conducted experiments evaluated the conversion of cyclodextrin for a range of temperatures (385–505 °C) and reaction times (20 ms to 2000 ms). As shown in Fig. 3, the PHASR reactor was designed to permit experimental evaluation of solid reactions with variable pulse length and temperature. The depicted thermal pulses demonstrate the potential variation of 20 ms pulses at 385 °C in blue to 2000 ms pulses at 505 °C in purple. All other combinations of reaction time and temperature were achievable and utilized in the conducted experiments.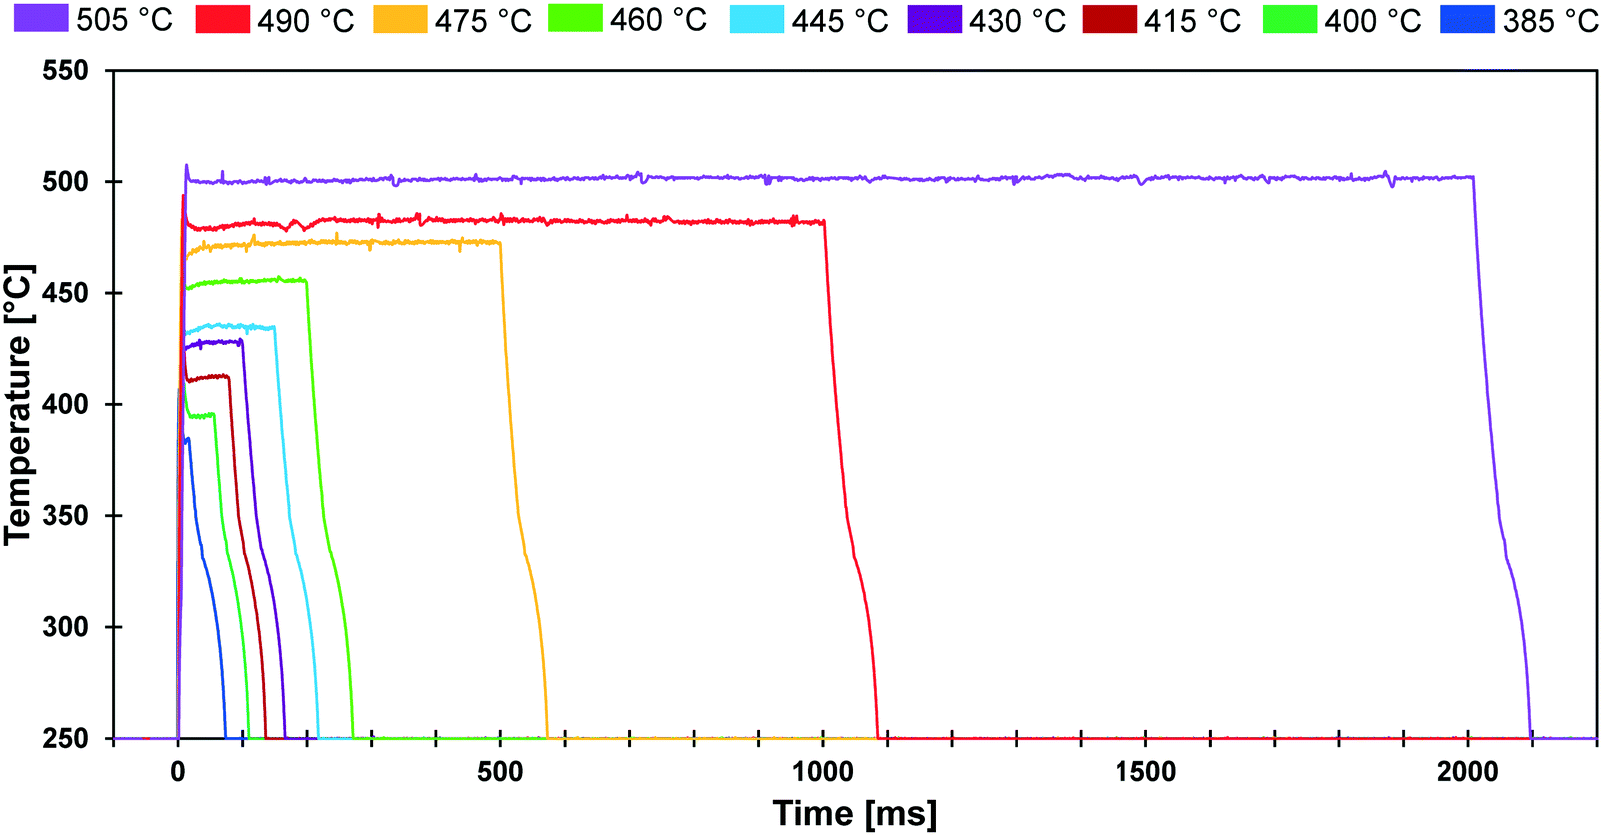 | ||
| Fig. 3 PHASR reactor pulse temperatures. Film samples of α-cyclodextrin were exposed to thermal pulses varying from 20 ms to 2000 ms at temperatures varying from 385 °C to 505 °C. | ||
3.1 Kinetic surrogate – cyclodextrin
Prior experiments with thin films of cellulose and α-, β-, or γ-cyclodextrin demonstrated that these cyclic carbohydrates produced the same yield of pyrolysis products at complete conversion.9 In a new set of experiments, α-cyclodextrin was evaluated as a kinetic surrogate of cellulose by comparing the rate of formation (μg-product μg-cellulose−1 per second) of pyrolysis products from both α-cyclodextrin and cellulose. Fig. 4 depicts the rate of formation at five temperatures (400, 425, 450, 475, 500 °C) of eight compounds: carbon dioxide, 2,5-dimethylfuran, 1,2-cyclopentanedione, furfural, 2,3-butanedione, 2(5H)-furanone, levoglucosenone, and 1,4:3,6-dianhydro-α-D-glucopyranose. By comparison of the product formation rates on individual parity plots, it is evident that both feedstocks (cellulose and cyclodextrin) exhibit identical product formation rates within experimental error. By this analysis, cyclodextrin can be utilized as a kinetic surrogate for the experimental characterization of cellulose decomposition. | ||
| Fig. 4 Product formation rate parity from α-cyclodextrin and cellulose at 400–500 °C. The rate of formation (μg-product μg-cellulose−1 per second) of volatile products indicates that α-cyclodextrin is a small-molecule surrogate of cellulose. Error bars represent a 90% confidence interval in reaction rate. | ||
3.2 Cyclodextrin conversion kinetics
The conversion of cyclodextrin was measured for pulses of 20–2000 ms and temperatures of 385–505 °C as depicted in Fig. 5A and B. Each time–temperature combination represented as a single data point in Fig. 5A was comprised of at least three independent experimental trials; error bars associated with each point represent a 90% confidence interval. From the appearance of the data it is evident that conversion of cyclodextrin exhibits first order kinetics – the rate of cyclodextrin conversion was proportional to the remaining quantity of cyclodextrin. For each temperature, a first order kinetic model was fit to the experimental data and found to pass through the majority of experimental confidence intervals for each temperature. From this large experimental data set, it was evident that cyclodextrin exhibits a broad range in conversion rates over the considered temperatures. At 385 °C, cyclodextrin only achieved ∼50% conversion after 2000 ms. In contrast, conversion of cyclodextrin was greater than 90% within 100 ms at 505 °C. | ||
| Fig. 5 PHASR kinetics of α-cyclodextrin. A. Conversion of α-cyclodextrin at temperatures 385 to 505 °C. B. Conversion of α-cyclodextrin at temperatures 385 to 505 °C with a log time scale. Error bars represent a 90% confidence interval in all data points. | ||
The selected experimental reaction times (i.e. durations of 20 ms to 2000 ms) were evenly spaced when the cyclodextrin conversion data are viewed on a logarithmic reaction time scale as depicted in Fig. 5B. By this presentation of the data, the relative rate of conversion of cyclodextrin can be visually observed. For lower temperatures (385–460 °C), the first-order kinetic models (blue, dark green, maroon, purple, light blue, and light green lines) are close together. However, the first-order kinetic models above 460 °C (orange, red and purple lines) are much further apart, indicating that the rate of cyclodextrin conversion significantly increased above about 460 °C.
3.3 Kinetic parameters and energetics
The kinetic transition observed in the cyclodextrin conversion data of Fig. 5B was further characterized by determining the first-order model kinetic parameter, k [=] s−1, for data sets at each reaction temperature. As shown in Fig. 6, the logarithm of conversion of cyclodextrin relative to time is linear for first-order systems consistent with the data at each temperature (385–505 °C) in panels 6A–6I. For each temperature, the first order kinetic parameter, k, was obtained with a least squares fit indicated by the solid line; a 90% confidence interval of k is indicated by shading. Comparison of the parameter range with the experimental data scale bars indicates good agreement in uncertainty. | ||
| Fig. 6 Conversion of α-cyclodextrin with time fit to first-order kinetics. Data points represent the conversion of cyclodextrin; error bars represent a 90% confidence interval. Lines represent a first-order rate expression for conversion of cyclodextrin with reaction rate coefficient, k, obtained from a least squares fit; shaded regions represent a 90% confidence interval in the value of k. A. 385 °C, B. 400 °C, C. 415 °C, D. 430 °C, E. 445 °C, F. 460 °C, G. 475 °C, H. 490 °C, I. 505 °C. | ||
The rate coefficients of Fig. 6 are presented in Fig. 7 in the Arrhenius form to reveal a distinct transition at 467 °C. Below this transition, the first order kinetic parameters indicated in red exhibit a low activation energy (Ea,1 = 23.2 ± 1.9 kcal mol−1) and low pre-exponential factor (k0,1 = 2.0 × 10⁷ s−1). Above the transition, the first order kinetic are consistent with a high apparent activation energy (Ea,2 = 53.7 ± 1.1 kcal mol−1) and high pre-exponential factor (k0,1 = 2.4 × 10¹⁶ s−1). The two linear kinetic regimes are within the 90% confidence intervals of the nine experimentally-derived kinetic parameters.
 | ||
| Fig. 7 First order rate coefficient, k, for α-cyclodextrin conversion with inverse temperature. The conversion of α-cyclodextrin exhibits a distinct change in kinetic regimes at 467 °C, indicative of a change in the mechanism of glycosidic bond cleavage. Error in the apparent activation energy represents a 90% confidence interval. | ||
4. Discussion
The transition observed at 467 °C was previously reported by the differential measurement of initial rates of cyclodextrin conversion.23 This methodology relied on single data points at each temperature in the interpretation of apparent activation energy at high and low temperature kinetic regimes. In the current work, the measurement of a time-resolved conversion of cyclodextrin allowed the determination of the first-order kinetic parameter, k, at each temperature based on several experimental data points (12–27 measurements). Increased data sampling greatly increased the accuracy of measuring the apparent activation energy, particularly at high temperature (475–505 °C) where the cyclodextrin reaction was completed in only 100–200 milliseconds. Determination of the kinetic parameters for isothermal conditions including the pre-exponential factor for both kinetic regimes permits the first molecular interpretation of the kinetics of glycosidic bond cleavage.4.1 Molecular interpretations of cleavage kinetics
The conversion of cyclodextrin was measured experimentally by determining the quantity of cyclodextrin remaining after the selected thermal pulse duration (reaction time); intermediate and product species were not quantified in these experiments. Conversion can therefore be interpreted as any reaction necessary to initiate the decomposition of cyclodextrin. It follows by interpretation of the two kinetic regimes observed in Fig. 7 that there exist at least two mechanisms of glycosidic bond cleavage. A slow mechanism consistent with a low apparent activation energy (Ea = 23.2 ± 1.9 kcal mol−1) is the primary cellulose initiation reaction below the reactive melting point. However, a high activation energy mechanism (Ea = 53.7 ± 1.1 kcal mol−1) overtakes this slow mechanism as temperature increases (at the reactive melting point) and dominates at higher temperatures. It is also possible that more than one initiation reaction mechanism occurs in each of the two initiation kinetic regimes.The measured kinetic parameters within each regime permit comparison with computed mechanisms of glycosidic bond cleavage. As listed in Table 1, potential mechanisms of glycosidic bond cleavage have been organized within three categories: (i) transglycosylation: reactions #1 to #28, (ii) glycolysis: reactions #29 to #53, and (iii) hydrolysis: reactions #54 to #60. Transglycosylation was defined as the breaking of the β-1,4 glycosidic bond between glucan monomers combined with the concurrent formation of the bridging C1–C6 ether bond in levoglucosan. Glycolysis included glycosidic bond cleavage mechanisms that do not form levoglucosan, and hydrolysis combines all catalyzed and uncatalyzed mechanisms that utilize water to break the β-1,4 glycosidic bond into two hydroxyl functional groups.
| Reactant material | Glycosidic bond cleavage products | Mechanism | Reaction steps | ΔH, enthalpy of activation or BDE or ZPE (apparent) | E a, Gibbs free energy apparent activation energy | Ref. | |||
|---|---|---|---|---|---|---|---|---|---|
| [kcal mol−1]a | [kJ mol−1]a | E a [kcal mol−1]a | [kJ mol−1]a | ||||||
| a Reported quantities in bold. Unbolded quantities calculated via unit conversion. b Numerical values in parenthesis denote barriers associated with elementary steps. c Apparent energies calculated by the energetic span model. | |||||||||
| Transglycosylation | |||||||||
| 1 | Cellotetraose | LGA + nonreducing end | Heterolytic | Two | 36 | 150.6 | 30 | ||
| 2 | Cellohexaose/cellohexaosan | LGA + nonreducing end/LGA | Concerted | One | 38.2–47.2 | 159.8–197.5 | 25 | ||
| 3 | Cellobiose | LGA + nonreducing end | Concerted | One | 47.1 | 197.1 | 25 | ||
| 4 | Methyl β-D-glucoside | LGA + methanol | Concerted | One | 47.7 (36.4)b | 199.6 | 31 | ||
| 5 | Cellobiose | LGA + nonreducing end | Concerted | One | 48.4 | 202.35 | 24 | ||
| 6 | Methyl β-D-glucoside | LGA + methanol | Concerted | One | 49 | 205.0 | 30 | ||
| 7 | Cellobiose | LGA + glycoaldehyde/ethenediol | Concerted | One | 52.1 | 218.0 | 26 | ||
| 8 | Cellobiose | LGA + nonreducing end | H+ catalyzed | Two | 53.0 | 221.59 | 24 | ||
| 9 | Methyl-cellobiose | LGA + nonreducing end | Concerted | One | 53.5 | 223.8 | 29 | ||
| 10 | Glycol β-D-glucoside | LGA + glycoaldehyde/ethenediol | Concerted | One | 53.6 | 224.21 | 24 | ||
| 11 | Methyl-cellobiose | LGA + nonreducing end | Concerted | One | 53.9 | 225.5 | 29 | ||
| 12 | Methyl-cellobiose | LGA + nonreducing end | Concerted | One | 55.2 | 231.0 | 29 | ||
| 13 | Cellohexaose/cellohexaosan | LGA + nonreducing end/LGA | Concerted | One | 56.1–61.9 | 234.7–259.0 | 25 | ||
| 14 | Methyl-cellobiosan | LGA + LGA | Concerted | One | 56.3 | 235.6 | 29 | ||
| 15 | Cellobiose | LGA + nonreducing end | Concerted | One | 35.1–44.9 | 146.9–187.9 | 57.1–64.6 | 25 | |
| 16 | Methyl-cellobiosan | LGA + LGA | Concerted | One | 58.5 | 244.8 | 29 | ||
| 17 | Methyl-cellobiosan | LGA + LGA | Concerted | One | 60.7 | 254.0 | 29 | ||
| 18 | Methyl β-D-glucoside | LGA + methanol | Concerted | One | 61.4 (52.5)b | 256.9 | 31 | ||
| 19 | Methyl β-D-glucoside | LGA + methanol | Homolytic | Multi-step | 91.8 | 384.1 | 65.4 | 273.6 | 31 |
| 20 | Cellotetraose | LGA + nonreducing end | Concerted | One | 69 | 288.7 | 30 | ||
| 21 | Cellohexaose/cellohexaosan | LGA + nonreducing end/LGA | Concerted | One | 73.8–80.7 | 308.8–337.7 | 25 | ||
| 22 | Cellobiose | LGA/formaldehyde + nonreducing end | Homolytic | Four | 79.1 | 331 | 27 | ||
| 23 | Methyl β-D-glucoside | LGA + methanol | Homolytic | One | 91.3 | 382.0 | 84.6 | 354.0 | 31 |
| 24 | Pyran + nonreducing end | LGA + nonreducing end | Concerted | One | 89 | 372.4 | 30 | ||
| 25 | Cellotetraose | LGA + nonreducing end | Concerted | One | 126 | 527.2 | 30 | ||
| 26 | Cellobiose | LGA + nonreducing end | Heterolytic | Multi-step | 157.5 | 659 | 27 | ||
| 27 | Methyl β-D-glucoside | LGA + methanol | Heterolytic | Multi-step | 189.5 | 792.9 | 31 | ||
| 28 | Cellobiose | LGA + nonreducing end | Heterolytic | Multi-step | 221.1 | 925 | 27 | ||
| Glycolysis (glycosidic cleavage) | |||||||||
| 29 | Cellotetraose | Reducing end + pyran | Heterolytic | Two | 31 | 129.7 | 30 | ||
| 30 | Cellotetraose | Nonreducing end + C3 + C3 | Concerted | One | 33 | 138.1 | 30 | ||
| 31 | Cellotetraose | Nonreducing end + pyran | Concerted | One | 35 | 146.4 | 30 | ||
| 32 | Cellotetraose | Nonreducing end + pyran | Heterolytic | Two | 37 | 154.8 | 30 | ||
| 33 | Cellotetraose | Nonreducing end + pyran | Heterolytic | Two | 43 | 179.9 | 30 | ||
| 34 | Cellotetraose | Nonreducing end + furan | Concerted | Two | 49 | 205.0 | 30 | ||
| 35 | Cellotetraose | Reducing end + C2 + C4 | Concerted | One | 50 | 209.2 | 30 | ||
| 36 | Cellobiose | Nonreducing end + pyran | Hydrogen transfer | Two | 51 | 213.4 | 30 | ||
| 37 | Cellobiose | Pyran + glucose | Concerted | Two | 51.3 | 214.6 | 28 | ||
| 38 | Cellobiose | Pyran + glucose | Water-catalyzed | Two | 56.1 | 234.7 | 28 | ||
| 39 | Cellobiose | Glucose + other | Concerted | One | 57.6 | 241.09 | 24 | ||
| 40 | Cellotetraose | Nonreducing end + pyran | Concerted | One | 59 | 246.9 | 30 | ||
| 41 | Cellobiose | Pyran + glucose | Ring opening | Two | 59.1 | 247.3 | 28 | ||
| 42 | Cellobiose | Glucose + pyran + formaldehyde | Concerted | One | 63.3 | 264.82 | 24 | ||
| 43 | Cellobiose | Glucose + pyran | Concerted | One | 64.6 | 270.31 | 24 | ||
| 44 | Cellobiose | Pyran + glucose | Concerted | Two | 65.3 | 273.2 | 28 | ||
| 45 | Cellobiose | Pyran + glucose | Concerted | One | 66.8 | 279.5 | 28 | ||
| 46 | Cellobiose | Glucose + pyran | Concerted | One | 69.5 | 290.77 | 24 | ||
| 47 | Cellobiose | Glucose + furan | Concerted | One | 76.7 | 320.89 | 24 | ||
| 48 | Methyl-Cellobiose | Cleaved ionic glucosides | Heterolytic | Multi | 78.6 | 328.9 | 29 | ||
| 49 | Methyl-Cellobiose | Cleaved ionic glucosides | Heterolytic | Multi | 90.3 | 377.8 | 29 | ||
| 50 | Methyl-Cellobiose | Cleaved radical glucosides | Homolytic | Multi | 94.5 | 395.4 | 29 | ||
| 51 | Methyl-Cellobiose | Cleaved radical glucosides | Homolytic | Multi | 94.6 | 395.8 | 29 | ||
| 52 | Methyl-Cellobiose | Cleaved radical glucosides | Homolysis | Multi | 97.8 | 409.2 | 29 | ||
| 53 | Methyl-Cellobiose | Cleaved ionic glucosides | Heterolytic | Multi | 167.2 | 699.6 | 29 | ||
| Glycosidic hydrolysis | Catalyst | ||||||||
| 54 | Pyranose dimer | Acid catalyzed | Acetic acid | Two | 10.1 | 42.3 | 33 | ||
| 55 | Pyranose dimer | Acid catalyzed | Formic acid | Two | 21.4 | 89.5 | 33 | ||
| 56 | Cellobiose | Acid catalyzed | Water | Four | 21–24 | 88–100 | 34 | ||
| 57 | Pyranose dimer | Acid catalyzed | Water | Two | 32 | 133.9 | 33 | ||
| 58 | Pyranose dimer | Acid catalyzed | Propanoic acid | Two | 34.1 | 142.7 | 33 | ||
| 59 | Pyranose dimer | Acid catalyzed | Butanoic acid | Two | 40 | 167.4 | 33 | ||
| 60 | Cellobiose | Uncatalyzed | NAb | One | 71.8 | 300.4 | 24 | ||
Within the three classes of glycosidic bond cleavage, calculation of activation energies by density functional theory has included a range of single and multi-step mechanisms (concerted, heterolytic and homolytic) from a variety of surrogate molecules sufficiently small to permit calculation. Common calculation surrogates included cellobiose,24–28 methyl-cellobiose,29 cellotetraose,30 cellohexaose/cellohexaosan,25 and methyl β-D-glucoside.31 The resulting products of glycosidic bond cleavage were then determined by the considered mechanism; for example, concerted transglycosylation of cellobiose produced glucose (i.e. nonreducing chain end) and levoglucosan (LGA). For each mechanism the calculated apparent activation energy was tabulated as either the apparent Gibbs free energy of activation (in kJ mol−1 or kcal mol−1) or a second category that included the apparent activation enthalpy, bond dissociation energy or zero point corrected energy (ZPE). For multi-step mechanisms, the apparent activation energy was calculated using the greatest energetic span.32 While only the Gibbs free energy can be directly compared with experiment, the other categories were included for completeness.
 | ||
| Fig. 8 Mechanisms of glycosidic bond cleavage. A. Concerted transglycosylation, reactions #7, #9, #11, and #12. Reaction numbers are associated with Table 1. B. Multi-step ring contraction to furan precursors, reaction #34. C. Concerted glycolysis to pyrans, reaction #36. D. Concerted ring fragmentation, reaction #35. E. Acid-catalyzed hydrolysis, reaction #54, #55, and #56. F. Atom number identification. | ||
For the high temperature initiation regime (T > 467 °C), three other glycosidic bond cleavage mechanisms were calculated to have viable activation energies when compared with experiment. These include:
• As depicted in Fig. 8B, depolymerization and ring contraction to a furan precursor of 5-hydroxymethyl-furfural (HMF) occurs by a two-step heterolytic mechanism (reaction #34 in Table 1) with apparent activation energy of Ea = 49.0 kcal mol−1.
• A second mechanism occurs by single step glycolysis depicted in Fig. 8C. By this mechanism (reaction #36 in Table 1), the glycosidic oxygen abstracts the C2 hydrogen, thus breaking the glycosidic bond and forming a pyran ring with Ea = 51 kcal mol−1.
• A third mechanism occurs by ring fragmentation and simultaneous glycosidic bond fragmentation as depicted in Fig. 8D. By this mechanism (reaction #35 in Table 1), the glycosidic bond oxygen abstracts the C2 hydroxyl hydrogen leading to ring opening and the formation of a C2 and C4 product with apparent activation energy of Ea = 50 kcal mol−1.
None of the calculated hydrolysis mechanisms in Table 1 exhibited apparent activation energies sufficiently high to account for the high temperature cellulose initiation reaction.
4.2 General interpretation
The kinetic transition of cellulose initiation identified in Fig. 7 is the key phenomenon to understanding the chemistry dictating the overall rate of conversion and distribution of chemical products. In 1987, Jacques Lédé and co-workers published an interesting result that wood exhibits a ‘fusion temperature of 739 K’ for which woody materials were observed to behave like melting ice or paraffin.35 This temperature is almost precisely the same as the kinetic transition temperature identified by PHASR kinetics (TRM = 467 °C) consistent with a reactive melting phenomenon. As described in depth by Lédé, the evidence for liquid formation from cellulose at high temperature has been observed for decades13 and has been characterized through the use of photography.36–38A liquid intermediate observable only at higher temperatures (>467 °C) is consistent with a shift in global reaction mechanism described in the introduction (Fig. 1). At lower temperatures, slow initiation (Ea = 23 kcal mol−1) controls the overall rate, and cellulose pyrolysis can be described by a single step lumped model since subsequent reaction steps to volatile products are relatively fast as previously described.16,39 However, as temperature increases and the faster initiation reaction(s) (Ea = 53 kcal mol−1) occur above 467 °C, the rate of initiation overtakes the rate of volatile product formation resulting in a liquid intermediate. These high temperature conditions agree well with the ‘active cellulose’ model first proposed by Shafizadeh;40 by this comparison, ‘active cellulose’ can be identified as the liquid intermediate observed visually by photography.38
A third kinetic regime potentially exists at lower temperatures (<385 °C). Previous experiments examining the weight loss of cellulose with time at low temperatures (200–300 °C) have observed zero order rate dependence on cellulose mass.41 This kinetic behavior is consistent with the dominant chemistry being cellulose chain-end reactions to vapors; the number of chain ends remains constant throughout the reaction thus maintaining a constant overall rate of reaction. Product formation rates exhibiting zero order kinetics have previously been observed experimentally at 450 °C, indicating that chain-end chemistry must be controlling the rate of volatile product formation.23 The third kinetic regime would therefore exist at low temperatures where the chain-end product formation rate is faster than the low-temperature initiation mechanism (Ea = 23 kcal mol−1). Future experiments will pursue evidence for the existence of a third kinetic regime and the temperature at which it becomes kinetically dominant.
4.3 The limit of cellulose kinetics
The kinetic transition at 467 °C dramatically enhances the rate of cellulose conversion as temperature increases. As depicted in Fig. 7, the high temperature initiation mechanism is more than twice as fast as the low-temperature initiation mechanism at 505 °C. At this temperature, the first order rate coefficient (k ∼ 20 s−1) for cellulose initiation is sufficiently fast that cyclodextrin conversion is completed in only 50–100 milliseconds, as shown in Fig. 5. The implications of such a high rate of cellulose reaction was predicted by Lédé and co-workers;35 by comparison of heat transfer rates into solid particles with reaction rate, it was determined that reaction above about 800 K (527 °C) is so fast as to be unattainable with any reasonable heating rate. This conclusion is supported by the measured rates of cyclodextrin conversion; extrapolation of the high temperature initiation mechanism in Fig. 7 to 800 K would result in a first order rate coefficient of (k ∼ 50 s−1) and completion of the cyclodextrin reaction in only 20–30 milliseconds. For this reason, kinetic characterization of cellulose above 800 K is too fast for any existing experimental method to characterize at isothermal conditions.5. Conclusions
Time-resolved cellulose pyrolysis was characterized from 385 °C to 505 °C using a millisecond, thin-film reactor called PHASR (pulse-heated analysis of solid reactions). Comparison of the product formation kinetics between cellulose and α-cyclodextrin demonstrated that α-cyclodextrin was an excellent kinetic surrogate for cellulose. Conversion of cyclodextrin was measured for the full range of temperatures, which indicated first-order rate dependence on cyclodextrin for all conditions. The apparent activation energy of cyclodextrin conversion was determined by fitting a first-order rate coefficient. Two kinetic regimes of cyclodextrin were observed. The low temperature kinetic regime exhibited glycosidic bond cleavage (Ea,1 = 23.2 ± 1.9 kcal mol−1, k0,1 = 2.0 × 10⁷ s−1) and is potentially consistent with cellulose hydrolysis. The energetics of the high temperature regime (Ea,2 = 53.7 ± 1.1 kcal mol−1, k0,2 = 2.4 × 10¹⁶ s−1) were compared with computed chemical reaction mechanisms and found to be comparable to four mechanisms: (i) transglycosylation to levoglucosan, (ii) glycolysis to a furan precursor, (iii) glycolysis to a pyran precursor, and (iv) glycolysis leading to ring fragmentation. However, the measured initiation kinetics provide insufficient information to conclude any specific chemical mechanism for glycosidic bond initiation.Acknowledgements
We acknowledge financial support from the U.S. National Science Foundation, CBET – Process Systems, Reaction Engineering and Molecular Thermodynamics under Award Number 1534930.References
- H. B. Goyal, D. Seal and R. C. Saxena, Bio-fuels from thermochemical conversion of renewable resources: A review, Renewable Sustainable Energy Rev., 2008, 12(2), 504–517 CrossRef CAS.
- C. Di Blasi, Modeling chemical and physical processes of wood and biomass pyrolysis, Prog. Energy Combust. Sci., 2008, 34, 47–90 CrossRef CAS.
- S. Kersten and M. Garcia-Perez, Recent developments in fast pyrolysis of lingo-cellulosic materials, Curr. Opin. Biotechnol., 2013, 24(3), 414–420 CrossRef CAS PubMed.
- M. W. Wright, D. E. Daugaard, J. A. Satrio and R. C. Brown, Techno-economic analysis of biomass fast pyrolysis to transportation fuels, Fuel, 2010, 89(1), S2–S10 CrossRef CAS.
- T. R. Brown, R. Thilakaratne, R. C. Brown and G. Hu, Techno-economic analysis of biomass to transportation fuels and electricity via fast pyrolysis and hydroprocessing, Fuel, 2013, 106, 463–469 CrossRef CAS.
- M. S. Mettler, D. G. Vlachos and P. J. Dauenhauer, Top ten fundamental challenges of biomass pyrolysis, Energy Environ. Sci., 2012, 5, 7797–7809 CAS.
- V. Agarwal, P. J. Dauenhauer, G. W. Huber and S. M. Auerbach, Ab Initio Dynamics of Cellulose Pyrolysis: Nascent Decomposition Pathways at 327 °C and 600 °C, J. Am. Chem. Soc., 2012, 134(36), 14958–14972 CrossRef CAS PubMed.
- A. R. Teixeira, K. G. Mooney, J. S. Kruger, C. L. Williams, W. J. Suszynski, L. D. Schmidt, D. P. Schmidt and P. J. Dauenhauer, Aerosol Generation by Reactive Boiling Ejection of Molten Cellulose, Energy Environ. Sci., 2011, 4, 4306 CAS.
- M. S. Mettler, S. H. Mushrif, A. D. Paulsen, A. D. Javadekar, D. G. Vlachos and P. J. Dauenhauer, Revealing pyrolysis chemistry for biofuels production: Conversion of cellulose to furans and small oxygenates, Energy Environ. Sci., 2012, 5, 5414 CAS.
- M. Garcia-Perez, A. Chaala, H. Pakdel, D. Kretschmer and C. Roy, Characterization of bio-oils in chemical families, Biomass Bioenergy, 2007, 31(4), 222–242 CrossRef CAS.
- M. J. Antal and M. Gronli, The art, science, and technology of charcoal production, Ind. Eng. Chem. Res., 2003, 42, 1619–1640 CrossRef CAS.
- P. J. Dauenhauer, J. L. Colby, C. M. Balonek, W. J. Suszynski and L. D. Schmidt, Reactive boiling of cellulose for integrated catalysis through a liquid intermediate, Green Chem., 2009, 11, 1555 RSC.
- J. Lédé, Cellulose pyrolysis kinetics: An historical review on the existence and role of intermediate active cellulose, J. Anal. Appl. Pyrolysis, 2012, 94, 17–32 CrossRef.
- A. R. Teixeira, C. Krumm, K. P. Vinter, A. D. Paulsen, C. Zhu, S. Maduskar, K. E. Joseph, K. Greco, M. Stelatto, E. Davis, B. Vincent, R. Hermann, W. Suszynski, L. D. Schmidt, W. Fan, J. P. Rothstein and P. J. Dauenhauer, Reactive liftoff of crystalline cellulose particles, Sci. Rep., 2015, 5, 11238 CrossRef PubMed.
- C. Krumm, S. Maduskar, A. D. Paulsen, A. Anderson, N. Barberio, J. Damen, C. Beach, S. Kumar and P. J. Dauenhauer, Micro-Ratcheted Surfaces for a Heat Engine Biomass Conveyor, Energy Environ. Sci., 2016, 9, 1645–1649 CAS.
- A. K. Burnham, X. Zhou and L. J. Broadbelt, Critical Review of the Global Chemical Kinetics of Cellulose Thermal Decomposition, Energy Fuels, 2015, 29, 2906–2918 CrossRef CAS.
- R. Vinu and L. J. Broadbelt, A mechanistic model of fast pyrolysis of glucose-based carbohydrates to predict bio-oil composition, Energy Environ. Sci., 2012, 5, 9808–9826 CAS.
- H. B. Mayes, M. W. Nolte, G. T. Beckham, B. H. Shanks and L. J. Broadbelt, The Alpha–Bet(a) of Glucose Pyrolysis: Computational and Experimental Investigations of 5-Hydroxymethylfurfural and Levoglucosan Formation Reveal Implications for Cellulose Pyrolysis, ACS Sustainable Chem. Eng., 2014, 2, 1461–1473 CrossRef CAS.
- X. Zhou, M. W. Nolte, H. B. Mayes, B. H. Shanks and L. J. Broadbelt, Experimental and Mechanistic Modeling of Fast Pyrolysis of Neat Glucose-Based Carbohydrates. 1. Experiments and Development of a Detailed Mechanistic Model, Ind. Eng. Chem. Res., 2014, 53, 13274–13289 CrossRef CAS.
- H. B. Mayes and L. J. Broadbelt, Unraveling the Reactions that Unravel Cellulose, J. Phys. Chem. A, 2012, 116(26), 7098–7106 CrossRef CAS PubMed.
- M. S. Mettler, A. D. Paulsen, D. G. Vlachos and P. J. Dauenhauer, The chain length effect in pyrolysis: Bridging the gap between glucose and cellulose, Green Chem., 2012, 14, 1284–1288 RSC.
- M. S. Mettler, S. H. Mushrif, A. D. Paulsen, A. D. Javadekar, D. G. Vlachos and P. J. Dauenhauer, Revealing pyrolysis chemistry for biofuels production: Conversion of cellulose to furans and small oxygenates, Energy Environ. Sci., 2012, 5, 5414 CAS.
- C. Krumm, J. Pfaendtner and P. J. Dauenhauer, Millisecond pulsed films unify the mechanisms of cellulose fragmentation, Chem. Mater., 2016, 28(9), 3108–3114 CrossRef CAS.
- Y. Zhang, C. Liu and X. Chen, Unveiling the initial pyrolytic mechanisms of cellulose by DFT study, J. Anal. Appl. Pyrolysis, 2015, 113, 621–629 CrossRef CAS.
- T. Hosoya and S. Sakaki, Levoglucosan formation from crystalline cellulose: Importance of a hydrogen bonding network in the reaction, ChemSusChem, 2013, 6, 2356 CrossRef CAS PubMed.
- J. C. Degenstein, P. Murria, M. Easton, H. Sheng, M. Hurt, A. R. Dow, J. Gao, J. J. Nash, R. Agrawal, W. N. Delgass, F. H. Ribeiro and H. I. Kenttamaa, Fast pyrolysis of 13C-labeled cellobioses: Gaining insights into the mechanisms of fast pyrolysis of carbohydrates, J. Org. Chem., 2015, 80, 1909–1914 CrossRef CAS PubMed.
- X. Zhang, J. Li, W. Yang and W. Blasiak, Formation mechanism of levoglucosan and formaldehyde during cellulose pyrolysis, Energy Fuels, 2011, 25, 3739–3746 CrossRef CAS.
- R. S. Assary and L. A. Curtiss, Thermochemistry and reaction barriers for the formation of levoglucosenone from cellobiose, ChemCatChem, 2012, 4, 200–205 CrossRef CAS.
- H. B. Mayes and L. J. Broadbelt, Unraveling the reactions that unravel cellulose, J. Phys. Chem. A, 2012, 116, 7098–7106 CrossRef CAS PubMed.
- V. Agarwal, P. J. Dauenhauer, G. W. Huber and S. M. Auerbach, Ab initio dynamics of cellulose pyrolysis: Nascent decomposition pathways at 327 and 600 C, J. Am. Chem. Soc., 2012, 134(36), 14958–14972 CrossRef CAS PubMed.
- T. Hosoya, Y. Nakao, H. Sato, H. Kawamoto and S. Sakaki, Thermal degradation of methyl β-D-glucoside. A theoretical study of plausible reaction mechanisms, J. Org. Chem., 2009, 74, 6891–6894 CrossRef CAS PubMed.
- S. Kozuch and S. Shaik, How to conceptualize catalytic cycles? The energetic span model, Acc. Chem. Res., 2011, 44(2), 101–110 CrossRef CAS PubMed.
- K. L. Fleming and J. Pfaendtner, Characterizing the Catalyzed Hydrolysis of β-1,4 Glycosidic Bonds Using Density Functional Theory, J. Phys. Chem. A, 2013, 117, 14200–14208 CrossRef CAS PubMed.
- C. Loerbroks, A. Heimermann and W. Thiel, J. Comput. Chem., 2015, 36, 1114–1123 CrossRef CAS PubMed.
- J. Lédé, H. Z. Li and J. Villermaux, Fusion-like behavior of wood pyrolysis, J. Anal. Appl. Pyrolysis, 1987, 10, 291–308 CrossRef.
- J. Piskorz, P. Majerski, D. Radlein, A. Vladars-Usas and D. S. Scott, Flash Pyrolysis of Cellulose for Production of Anhydro-Sugars, J. Anal. Appl. Pyrolysis, 2000, 56, 145–166 CrossRef CAS.
- O. Boutin, M. Ferrer and J. Lede, Radiant flash pyrolysis of cellulose – Evidence for the formation of short life time intermediate liquid species, J. Anal. Appl. Pyrolysis, 1998, 47, 13–31 CrossRef CAS.
- P. J. Dauenhauer, J. L. Colby, C. M. Balonek, W. J. Suszynski and L. D. Schmidt, Reactive boiling of cellulose for integrated catalysis through an intermediate liquid, Green Chem., 2009, 11, 1555–1561 RSC.
- C. Di Blasi, Modeling chemical and physical processes of wood and biomass pyrolysis, Prog. Energy Combust. Sci., 2008, 34, 47–90 CrossRef CAS.
- A. G. W. Bradbury, Y. Sakai and F. Shafizadeh, A kinetic model for pyrolysis of cellulose, J. Appl. Polym. Sci., 1979, 23, 3271–3280 CrossRef CAS.
- A. E. Lipska and W. J. Parker, Kinetics of the pyrolysis of cellulose in the temperature rage 250–300 °C, J. Appl. Polym. Sci., 1966, 10, 1439–1453 CrossRef CAS.
Footnote |
| † Electronic supplementary information (ESI) available. See DOI: 10.1039/c6re00176a |
| This journal is © The Royal Society of Chemistry 2017 |