 Open Access Article
Creative Commons Attribution 3.0 Unported Licence
Shape-controlled CoFe2O4 nanoparticles as an excellent material for humidity sensing
Yogendra Kumara,
Alfa Sharma a and
Parasharam M. Shirage
 *ab
*ab
aDiscipline of Metallurgy Engineering and Materials Science, Indian Institute of Technology Indore, Simrol, Indore-453552, India. E-mail: paras.shirage@gmail.com; pmshirage@iiti.ac.in
bDiscipline of Physics, Indian Institute of Technology Indore, Simrol, Indore-453552, India
First published on 8th December 2017
Abstract
The humidity sensing performance of cobalt ferrite nanoparticles (CoFe2O4 NPs) with controlled morphology obtained via a solution route is reported in this work. The humidity sensing properties of the presented CoFe2O4 NPs ferrite sensor were investigated by exposing it to a broad humidity range of 8–97% at room temperature. CoFe2O4 NPs with spherical, cubic, and hexagonal shapes have been successfully achieved by tuning the growth conditions like reaction time and amount of solvent. These CoFe2O4 NPs exhibit morphology-dependent chemi-resistive humidity sensing behaviors. The highest humidity sensitivity value of ∼590 along with response/recovery value of 25/2.6 s at room temperature was obtained for CoFe2O4 hexagonal (CF-H) shape as compared to CoFe2O4 spherical (CF-S) and CoFe2O4 cubic (CF-C) shapes. Freundlich adsorption isotherm model was well fitted with the experimental results which turned up in support of a plausible humidity sensing mechanism. The morphology-dependent CoFe2O4 nanostructures exhibit promising sensing capabilities which ensure them as a potential candidate for magnetic recording media and next-generation humidity sensors.
1. Introduction
Humidity is a physio-chemical phenomenon that affects numerous cases leading to deterioration by environmental exposure. Owing to this, and the many areas affected by humidity, there is a need to retain control of humidity. This means that humidity sensors have been of great interest to researchers in recent years. Humidity sensors play a pivotal role in determining the quality of products, precision of instruments, and human life by suitable regulation of humidity for various human comforts.1,2 Ferrites are currently one of the most investigated nanomaterials due to their characteristics for improvised multifunctional application. In this regard, to obtain effective sensors, the properties can be tuned by changing the material characteristics such as composition, crystallite size, porosity, and shape. Rezlescu et al. discussed humidity sensing properties of MgFe2O4 ferrite with substitution and addition of different cations.3 Similarly, Seki et al. reported ferrites as humidity sensitive by gaining precise insight into the electrical and magnetic characteristics of the materials.4 A mixed Ni–Co ferrite and the effect of applied calcination temperature on the humidity sensing properties were reported by Virlan et al.5 The humidity sensing of soft ferrites like mixed Cu–Zn system has also been observed where formulation of highly sensitive ferrites by doping was discussed as an alternative to the conventional metal oxide-based humidity sensors.6 Muthurani et al. reported the humidity sensing properties of Cu–, Co– and mixed Cu–Co ferrites where CuFe2O4 showed better results than others at room temperature.7 Among the ferrite family, CoFe2O4 nanoparticles (NPs) have received significant attention due to their inherent magnetic, electrical, and mechanical properties along with high chemical stability.8,9 Cobalt ferrite NPs are a suitable candidate for various technological applications, such as biosensors,10 gas sensors,11–13 stress sensors,14 magnetic recording media,8 magneto-optical devices,9 magnetic resonance imaging,15 catalysis,16 biomedical applications,15 etc. No detailed information is available on humidity sensing of cobalt ferrite NPs. Cobalt ferrite has cubic spinel structure, which is mainly interesting for sensing behavior due to its chemical composition and structure, where the presence of more than one cation site modulates the performance due to the variation of chemical nature and oxidation states of cations.11 Humidity sensors based on metal oxide materials have advantages such as being economical for mass production, and convenient for use in a wide operating range. The ability of a metal oxide to detect the presence of humidity depends on the interaction between water molecules and the surface of the metal oxide, i.e., the reactivity of its surface. The reactivity of the surface depends on the cation distribution and morphology, which mainly depend on the synthesis technique.Various preparation techniques including hydrothermal method, sol–gel method, co-precipitation method, ball milling, and self-combustion were developed to produce cobalt ferrite nanostructures.11,17–20 Apart from these techniques, solution-based routes are less time consuming and comprehensive to prepare well-dispersed nanostructures with desirable morphology. However, there remain some issues regarding the structure tunability, stability and reproducibility of the prepared nanostructures. Therefore, there is an immediate requirement to find a facile solution route that can directly provide structural tunability of the desired material for diverse applications.
In this study a facile bottom-up solution approach is utilized to obtain nanostructures of CoFe2O4. Here we highlight three important aspects of the study. First is the direct visualization of different nanostructures of CoFe2O4, i.e. spheres, cubes and hexagons, that attracted our attention to study their morphological properties. Secondly, efforts have been made to study their effects on humidity sensing in detail for the first time. Finally, emphasis has been given to correlate the experimental findings with the available theoretical sensing models, for instance the Freundlich adsorption isotherm model that relates to a plausible sensing mechanism.
2. Experimental details
2.1. Materials
Cobalt(II) acetylacetonate, iron(III) acetylacetonate, oleic acid and benzyl ether were purchased from Sigma-Aldrich and were used as received without any further purification. Here, cobalt(II) acetylacetonate and iron(III) acetylacetonate were used as the precursors. Additionally, oleic acid was utilized as a surfactant and benzyl ether as the solvent.2.2. Synthesis of CoFe2O4 nanostructures
2.3. Characterization
Powder X-ray diffraction (XRD) analyses of CF-S, CF-C and CF-H NPs were carried out using an X-ray diffractometer (Bruker D8 Advance) with Cu Kα radiation (λ = 1.540 Å) in the 2θ range from 25° to 70° with a step of 0.30° per minute. The morphologies of as-prepared CF-S, CF-C, and CF-H NPs were determined using high-resolution transmission electron microscopy (HRTEM) with a Tecnai G2 F30 operating at 300 kV. The humidity sensing measurement was done by using a Keithley 2401 source meter and a PC interfaced with LABVIEW.2.4. Device fabrication and humidity sensing
ITO-coated glass substrates (1 cm × 1 cm) were used for device fabrication. A channel was made on the substrate so that the two sides of the channel will act as source and drain. A channel length of 10 mm and width of 1 mm were maintained. A paste of each of the different CoFe2O4 NPs individually was then drop-cast into the channel for a series of devices. The devices were dried in a furnace at 50 °C for 30 min and then used for further sensing experiments. The sensing experiment was constructed with saturated aqueous solutions of KOH, MgCl2·6H2O, K2CO3, Mg(NO3)2, NaNO3, NaCl, KCl, and K2SO4 in closed conical flasks with a controlled environment with relative humidity (RH) of 8, 33, 43, 52, 63, 75, 86 and 97%, respectively,21–24 and the RH levels were monitored by a standard hygrometer. The entire experiment was carried out at room temperature.3. Results and discussion
3.1. Crystal structure analysis
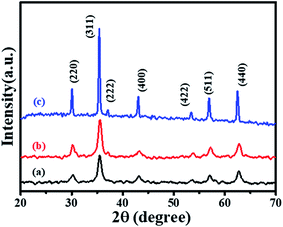
XRD patterns were recorded to determine the phase purity and crystal structure of the as-synthesized CF-S, CF-C, and CF-H NPs, as shown in Fig. 1. The XRD patterns of CF-S, CF-C, and CF-H NPs present diffraction peaks which were indexed to a cubic spinel structure of CoFe2O4 NPs, in good agreement with previous studies.25,26 CF-H NPs show intense diffraction peaks as compared to the CF-S and CF-C NPs. The difference in the intensities of the diffraction peaks may suggest a variation of morphology and particle size. Eom et al. reported a similar morphology-dependent behavior of diffraction patterns as obtained here.26 In order to get more insight into the crystallite size and morphology of the as-synthesized CF NPs, the crystallite size was calculated (from XRD patterns) and HRTEM measurements were conducted.The crystallite sizes of the CF-S, CF-S, and CF-H NPs were calculated from XRD patterns by using the Debye–Scherrer formula27–30 which can be expressed as:
 | (1) |
The calculated crystallite sizes of CF-S, CF-C, and CF-H NPs were 22.2, 23.1 and 27.9 nm, respectively. A higher crystallite size of CF-H was observed than that of CF-S and CF-C, which is well expected from the high diffraction peak intensity for CF-H.
Further, the lattice parameters were determined from eqn (2) and (3).3,29 The formulas can be expressed as:
 | (2) |
nλ = 2d![[thin space (1/6-em)]](https://www.rsc.org/images/entities/char_2009.gif) sin sin![[thin space (1/6-em)]](https://www.rsc.org/images/entities/char_2009.gif) θ θ
| (3) |
3.2. Morphology study
The competition between the growth rates of different crystallographic facets determines the final shape of NPs. Surfactants and capping/reducing agents can alter the surface energies of these crystallographic planes and control the growth rates of different crystallographic facets.31 In addition, several studies have been reported that involved controlling the nucleation and growth dynamics by altering the temperature, heating rate, surfactant and precursor concentration resulting in the formation of different sized and shaped NPs.26 As mentioned in the Experimental section, in our study, oleic acid was used as a surfactant whereas benzyl ether was used as a solvent. By changing only the reaction time and solvent amount, the shape of the NPs was tuned from spherical (CF-S) to cubic (CF-C) followed by hexagonal (CF-H). Fig. 2(a–c) displays TEM images of CF-S, CF-C and CF-H NPs. The insets of Fig. 2(a–c) present the corresponding particle size distributions of the as-prepared materials. Initially, CF-S NPs (Fig. 2(a)) were formed with an average size of 23.5 nm at 20 min refluxing time. After that, when the refluxing time was increased to 40 min, the shape of CF-S was transformed to CF-C (Fig. 2(b)). Finally, when the refluxing time was increased to 90 min, the shape of CF-C was further transformed to CF-H. In the present study, the transformation of the CF NPs from sphere to hexagon may be attributed to the relationship between the change in solvent amount and reaction time. CF-S NPs were obtained when we used 2.5 mL of oleic acid and 40 mL of benzyl ether for 20 min refluxing at 280 °C, due to isotropic growth in all possible directions. Decreasing the amount of benzyl ether and increasing the reaction time to 40 min increases the growth at a faster rate along the 〈111〉 direction with respect to isotropic growth which results in the formation of CF-C NPs. Again, on further reducing the solvent amount to 20 mL and increasing the reaction time to 90 min, the growth along 〈111〉 direction gets saturated and the surface along {100} direction enhances to form the hexagonal structure (CF-H NPs). Thus, in CF-H, both {111} and {100} surfaces were developed.26,32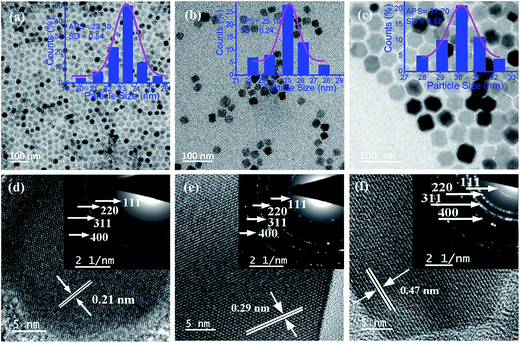 | ||
| Fig. 2 TEM images of (a) CF-S, (b) CF-C and (c) CF-H NPs (insets show size distribution histograms) and HRTEM images of (d) CF-S, (e) CF-C and (f) CF-H NPs (insets show the SAED patterns). | ||
HRTEM images of single CF-S, CF-C, and CF-H NPs are shown in Fig. 2(d–f). The spacing between two fringes was measured to be 0.21 nm, 0.29 nm, and 0.47 nm corresponding to the interplanar spacing of (400), (220), and (111) planes of CoFe2O4 NPs (insets show the selected area electron diffraction (SAED) patterns). From the SAED and HRTEM analysis, we found that all of the CF-S, CF-C and CF-H NPs possess spinel crystalline structure which is in agreement with the obtained XRD results.32
From the above discussed results, we found that the amount of surfactant/solvent and reaction time play crucial role for the transformation of CF-S to CF-C, and then to CF-H NPs. A schematic illustration of the proposed formation of different shapes of CoFe2O4 NPs is provided in Fig. 3.
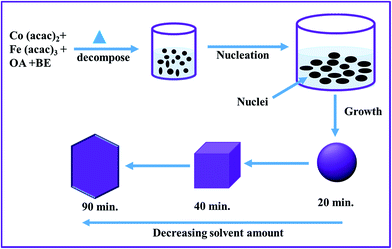 | ||
| Fig. 3 Schematic illustration of the formation of the various morphologies of CoFe2O4 NPs through tuning the solvent amount (OA, oleic acid; BE, benzyl ether). | ||
Furthermore, to investigate the effect of reaction time on the morphology of CoFe2O4 NPs, the refluxing time of the reaction was maintained for 30, 60 and 90 min. Fig. 4 shows TEM images of NPs obtained at different refluxing time while keeping other reaction conditions constant, i.e., precursor concentration, ratio of reducing agent and solvent amount. Monodisperse nearly sphere-like shapes of CoFe2O4 NPs with average size of 24.22 nm, 29.94 nm, 33.68 nm were observed for the 30, 60 and 90 min reaction refluxing times, respectively. Larger particle size was observed for the longer refluxing time whereas the shape of the NPs remains almost the same. These results suggest that very similar shape (sphere) of NPs with different size may be achieved by varying the refluxing time, by keeping other reaction conditions as such. Gao et al.32 and Lu et al.33 reported that the size of the NPs increased with prolonging reaction time while the shape of the NPs remains very similar, i.e., sphere, cube, and star, for different precursors and reducing/surfactant concentrations.
 | ||
| Fig. 4 TEM images of the as-synthesized CoFe2O4 NPs with nearly sphere-like shapes and different sizes of (a) 24.22 nm, (b) 29.94 nm, and (c) 33.68 nm for different refluxing times. | ||
3.3. Humidity sensing
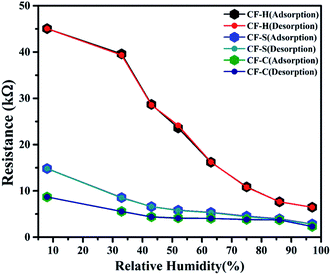
In the present study, we investigated the influence of different morphologies of CoFe2O4 NPs on humidity sensing. In this context, comparisons for all three sensors with spherical (CF-S), cubic (CF-C), and hexagonal (CF-H) cobalt ferrite NPs are shown in Fig. 5(a & b). The measurements were conducted by exposing all the sensors to 8% to 97% RH environment.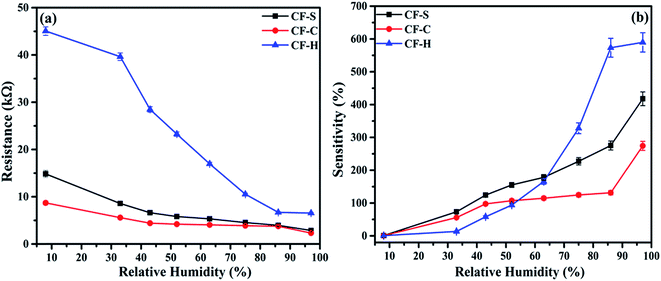 | ||
| Fig. 5 Plots of (a) resistance and (b) sensitivity vs. relative humidity for CoFe2O4-based RH sensors. | ||
The sensitivity of the sensors shows a significant increase with increase in humidity. The sensitivity of humidity sensors was calculated using the equation
 | (4) |
A hysteresis study has practical utility for any electronic device application where minimizing the hysteresis error is crucial. To calculate the hysteresis of the CF-H, CF-S, and CF-C NPs sensor devices, the resistances of the devices were measured at various RH levels. Hysteresis is defined as the drift in resistance of the sensors on increasing RH from 8% to 97% and back from 97% to 8%. The hysteresis of the humidity sensors based on different morphologies is shown in Fig. 6. The hysteresis indicates the different rates of adsorption and desorption of water vapor during the sensing process.
The hysteresis error (He) values were determined from eqn (5) at different levels of RH for CF-S, CF-C, and CF-H NPs and can be given as:
 | (5) |
Response/recovery transient study of any sensing material provides a measure of the operational ability of a device. The response time (Tres) was the time taken to achieve 90% change in the total resistance by switching the sensors ON from 8% to 97% RH and recovery time was calculated when sensors moved from 97% to 8% RH. Fig. 7(a–c) presents the response/recovery time of CF-S, CF-C and CF-H which has values of 50.4/3.54 s, 49/3.0 s and 25/2.6 s respectively generally for one cycle of adsorption and desorption. The repeatability behavior of all the cobalt ferrite-based RH sensors was investigated for nearly 9–10 iterative cycles. It can be clearly observed that on transformation of spherical to hexagonal CoFe2O4 NPs, the response and recovery time of the sensor has been decreased to a great extent.
 | ||
| Fig. 7 Response/recovery characteristics of different CoFe2O4 morphology-based humidity sensors: (a) CF-S, (b) CF-C and (c) CF-H NPs based humidity sensors in 33% to 97% RH. | ||
Long-term stability is one of the important factors for estimating the operational reliability of a sensor device. The stability of resistance of CF-S, CF-C, and CF-H NPs based sensors was measured in different RH and monitored continuously for 7–8 weeks as shown in Fig. 8(a–c).
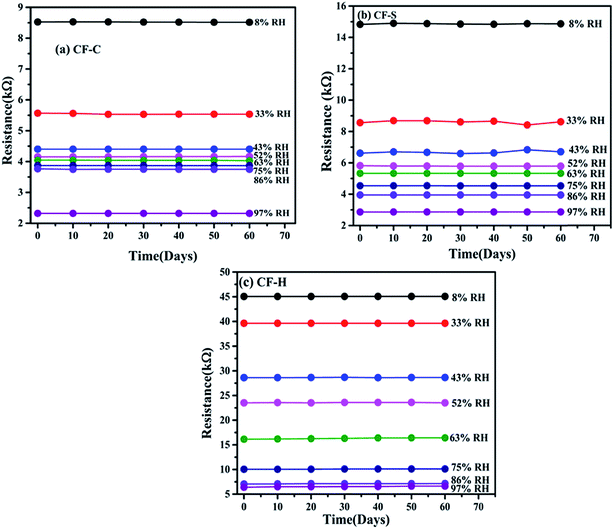 | ||
| Fig. 8 Long-term stability of (a) CF-C, (b) CF-S and (c) CF-H sensors from 8% to 97% RH at room temperature. | ||
3.4. Freundlich adsorption isotherm model
When a sensor is subjected to a humidity atmosphere different from ambient, a new adsorption–desorption equilibrium is observed via van der Waals forces and hydrogen bonding between adsorbed water molecules and surface-active groups.38 Considering that ferrites have a number of water adsorption sites in the form of multi-cation sites, the Freundlich adsorption isotherm model appeared to be more appropriate for explaining the surface behavior in the humidity sensing process. The relationship between S (relative deviation in resistance as a function of solute adsorbed on the adsorbent) and C (percent relative humidity as a function of water vapor concentration) can be expressed as S = k × Cα, where k and α are the proportionality and exponent constants and represent the adsorption capacity and adsorption strength.38–40The Freundlich adsorption model was applied to investigate the water adsorption–desorption behavior of CF-S, CF-C, and CF-H NPs based humidity sensors. Relative deviation in resistance (ΔRH) is also an important factor describing the resistance variation of a humidity sensor, which is expressed as
| ΔRH (%) = (RLH − RH)/RLH × 100 | (6) |
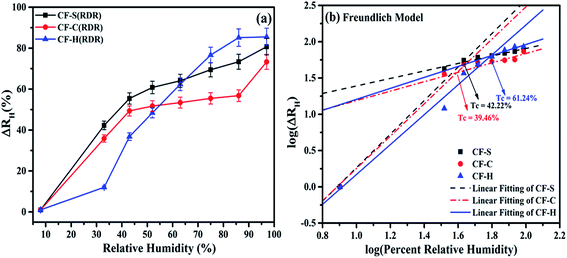 | ||
| Fig. 9 (a) Relative deviation in resistance (ΔRH) as a function of applied relative humidity. (b) log–log plot of ΔRH vs. percent relative humidity for CF-S, CF-C, and CF-H. | ||
| Sample | RH range (%) | k | α | R2 |
|---|---|---|---|---|
| CF-S | 08–52 | 1.11 ± 0.35 | 2.31 ± 0.24 | 0.96 |
| CF-S | 52–97 | 7.48 ± 0.10 | 0.52 ± 0.05 | 0.96 |
| CF-C | 08–52 | 3.47 ± 0.57 | 2.23 ± 0.22 | 0.96 |
| CF-C | 52–97 | 9.40 ± 0.33 | 0.65 ± 0.30 | 0.94 |
| CF-H | 08–52 | 2.82 ± 0.33 | 2.06 ± 0.208 | 0.96 |
| CF-H | 52–97 | 7.76 ± 0.30 | 0.75 ± 0.18 | 0.95 |
A better correlation between the experimental and fitted results from the Freundlich model observed in Fig. 9(b) provides a better insight into a plausible sensing mechanism of metal oxide semiconductor-based humidity sensors. The widely accepted humidity sensing mechanism suggests the role of electrons as a key player to control the sensing behavior for a low-humidity environment as protons (H+) cannot move freely in immobile chemisorbed and initially physisorbed water layers over the sensor surface. On exposure to a high-humidity environment, the H+ started freely moving in the high level of physisorbed water layers dominating the protonic conduction over the electronic conduction through the Grotthuss chain reaction over the surface. Besides this, the previously adsorbed and ionized oxygen species (O− and O2−) on the sensor surface affect the mechanism of water molecule adsorption and desorption. The above discussed Freundlich adsorption isotherm model describes this more clearly where experimental evidence points to RH-dependent conduction process taking place.
4. Conclusion
CoFe2O4 NPs with different morphologies were synthesized by using a facile and economical solution route. XRD shows that the NPs have pure spinel phase structure. TEM images indicate that particle sizes of CF-S, CF-C, and CF-H are 23.5 nm, 25 nm, and 30 nm, respectively. The morphologies of the NPs were very well controlled by varying the surfactant to solvent ratio and reaction time. The humidity sensing properties of the CoFe2O4 NPs was examined by exposing them to a broad humidity range of 8–97% at room temperature. Humidity sensitivity improved considerably along with response/recovery value of 25 s/2.6 s for CF-H. This is the first detailed report on humidity sensing by CoFe2O4. Possible fitting with the Freundlich model was attempted and provides better insight into the adsorption–desorption mechanism over the surface of CF-S, CF-C, and CF-H NPs based sensors. The morphology-dependent humidity sensing performance of cobalt ferrite NPs indicates that they are most suitable for room temperature-based next-generation high-performance humidity sensors.Conflicts of interest
There are no conflicts to declare.Acknowledgements
This work was supported by the Department of Science and Technology, India by the award of the prestigious ‘Ramanujan Fellowship’ (SR/S2/RJN-121/2012) to PMS. The authors also acknowledge CSIR research grant no. 03(1349)/16/EMR-II and support from SIC, IIT Indore for providing the XRD and FT-IR characterization facility. The authors are grateful to Professor Pradeep Mathur, director IIT Indore. Y. K. and A. S. acknowledge MHRD fellowship for doctoral research.References
- X. Song, Q. Qi, T. Zhang and C. Wang, Sens. Actuators, B, 2009, 138, 368–373 CrossRef CAS.
- K. Sager, G. Gerlach and A. Schroth, Sens. Actuators, B, 1994, 18, 85–88 CrossRef CAS.
- N. Rezlescu, E. Rezlescu, P. D. Popa and F. Tudorache, J. Optoelectron. Adv. Mater., 2005, 7, 907–910 CAS.
- K. Seki, J. I. Shida and K. Murakami, IEEE Trans. Instrum. Meas., 1998, 37, 468–470 CrossRef.
- C. Virlan, F. Tudorache and A. Pui, Int. J. Appl. Ceram. Technol., 2017, 1–9, DOI:10.1111/ijac.12706.
- A. Vaingankar, S. Kulkarni and M. Sagare, J. Phys. IV, 1997, 7, 155–156 CrossRef.
- S. Muthurani, M. Balaji, S. Gautam, K. H. Chae, J. H. Song, D. P. Padiyan and K. Asokan, J. Nanosci. Nanotechnol., 2011, 11, 5850–5855 CrossRef CAS PubMed.
- S. E. Shirsath, X. Liu, Y. Yasukawa, S. Li and A. Morisako, Sci. Rep., 2016, 6, 30074 CrossRef CAS PubMed.
- F. Choueikani, F. Royer, D. Jamon, A. Siblini, J. J. Rousseau and S. Neveu, Appl. Phys. Lett., 2009, 94, 051113 CrossRef.
- D. M. Bruls, et al., Lab Chip, 2009, 9, 3504–3510 RSC.
- (a) X. F. Chu, D. Jiang, Y. Guo and C. Zheng, Sens. Actuators, B, 2006, 120, 177 CrossRef CAS; (b) A. Sutka and K. A. Gross, Sens. Actuators, B, 2016, 222, 95–105 CrossRef CAS.
- M. S. Khandekar, N. L. Tarwal, I. S. Mulla and S. S. Suryavanshi, Ceram. Int., 2014, 40, 447–452 CrossRef CAS.
- S. Tao, F. Gao, X. Q. Liu and O. T. Sorensen, Mater. Sci. Eng., B, 2000, 77, 172–176 CrossRef.
- J. A. Paulsen, A. P. Ring, C. C. H. Lo, J. E. Snyder and D. C. Jiles, J. Appl. Phys., 2005, 97, 044502 CrossRef.
- O. Veiseh, J. W. Gunn and M. Zhang, Adv. Drug Delivery Rev., 2010, 62, 284–304 CrossRef CAS PubMed.
- S. Shylesh, V. Schünemann and W. R. Thiel, Angew. Chem., Int. Ed., 2010, 49, 3428–3459 CrossRef CAS PubMed.
- J. G. Lee, J. Y. Park and C. S. Kim, J. Mater. Sci., 1998, 33, 3965–3968 CrossRef CAS.
- X. Li, G. Chen, Y. P. Lock and C. Kutal, J. Mater. Sci. Lett., 2002, 21, 1881 CrossRef CAS.
- P. N. Vasambekar, C. B. Kolekar and A. S. Vaingankar, J. Mater. Sci.: Mater. Electron., 1999, 10, 667 CrossRef CAS.
- C. Cannas, A. Falqui, A. Musinu, D. Peddis and G. Piccaluga, J. Nanopart. Res., 2006, 8, 255–267 CrossRef CAS.
- A. M. Dumitrescu, G. Lisa, A. R. Iordan, F. Tudorache, I. Petrila, A. I. Borhan, M. N. Palamaru, C. Mihailescu, L. Leontie and C. Munteanu, Mater. Chem. Phys., 2015, 156, 170–179 CrossRef CAS.
- V. Jeseentharani, M. George, B. Jeyaraj, A. Dayalan and K. S. Nagaraja, J. Exp. Nanosci., 2013, 8, 358–370 CrossRef CAS.
- L. Greenspan, J. Res. Natl. Bur. Stand., Sect. A, 1977, 81, 89–96 CrossRef.
- D. R. Lide, CRC Handbook of Chemistry and Physics, CRC Press, Boca Raton, FL, 90th edn, 2010 Search PubMed.
- Y. Kumar and P. M. Shirage, J. Mater. Sci., 2017, 52, 4840–4851 CrossRef CAS.
- Y. Eom, M. Abbas, H. Y. Noh and C. G. Kim, RSC Adv., 2016, 6, 15861–15867 RSC.
- A. K. Rana, Y. Kumar, N. Saxena, R. Das, S. Sen and P. M. Shirage, AIP Adv., 2015, 5, 097118 CrossRef.
- Y. Kumar, A. K. Rana, P. Bhojane, M. Pusty, V. Bagwe, S. Sen and P. M. Shirage, Mater. Res. Express, 2015, 2, 105017 CrossRef.
- R. Das, A. Kumar, Y. Kumar, S. Sen and P. M. Shirage, RSC Adv., 2015, 5, 60365 RSC.
- A. K. Rana, R. Das, Y. Kumar, S. Sen and P. M. Shirage, Appl. Surf. Sci., 2016, 379, 23–32 CrossRef CAS.
- H. Khurshid, L. Wanfeng, S. Chandra, M. H. Phan, G. C. Hadjipanayis, P. Mukherjee and H. Srikanth, Nanoscale, 2013, 5, 7942–7952 RSC.
- G. Gao, X. Liu, R. Shi, K. Zhou, Y. Shi, R. Ma, E. T. Muromachi and G. Qiu, Cryst. Growth Des., 2010, 10, 2888–2894 CAS.
- L. T. Lu, N. T. Dung, L. D. Tung, C. T. Thanh, O. K. Quy, N. V. Chuc, S. Maenosono and T. K. Thanh, Nanoscale, 2015, 7, 19596–19610 RSC.
- A. S. Pawbake, R. Waykar, D. J. Late and S. R. Jadkar, ACS Appl. Mater. Interfaces, 2016, 5, 3359–3365 Search PubMed.
- P. K. Kannan, D. J. Late, H. Morgan and C. S. Rout, Nanoscale, 2015, 7, 13293–13312 RSC.
- J. Herran, I. Fernandez, E. Ochoteco, G. Cabanero and H. Grande, Sens. Actuators, B, 2014, 198, 239–242 CrossRef CAS.
- V. K. Tomer, N. Thangaraj, S. Gahlot and K. Kailasam, Nanoscale, 2016, 8, 19794–19803 RSC.
- C. D. Hatch, J. S. Wiese, C. C. Crane, K. J. Harris, H. G. Kloss and J. Baltrusaitis, Langmuir, 2012, 28, 1790–1803 CrossRef CAS PubMed.
- A. Sharma, P. Bhojane, A. K. Rana, Y. Kumar and P. M. Shirage, Scr. Mater., 2017, 128, 65–68 CrossRef CAS.
- C. H. Xu, S. Q. Shi and C. Surya, Sensors, 2008, 9, 9903–9924 Search PubMed.
| This journal is © The Royal Society of Chemistry 2017 |

