 Open Access Article
Electro-kinetic remediation of chromium-contaminated soil by a three-dimensional electrode coupled with a permeable reactive barrier
Fengjiao Xue†
a,
Yujie Yan†a,
Ming Xia†a,
Faheem Muhammad†a,
Lin Yu†ab,
Feng Xu†d,
YanChyuan Shiau*c,
Dongwei Li *a and
Binquan Jiao*ab
aState Key Laboratory of Coal Mine Disaster Dynamics and Control, Chongqing University, Chongqing 400044, China. E-mail: litonwei@cqu.edu.cn; j.binquan@cqu.edu.cn
bCity College of Science and Technology, Chongqing University, Chongqing, 400044, China
cDept. of Construction Management, Chung Hua University, No. 707, Wufu Rd., Sec. 2, Hsinchu 30012, Taiwan. E-mail: ycshiau@chu.edu.tw
dChongqing Solid Waste Management Center, Chongqing 401147, China
First published on 30th November 2017
Abstract
Improper disposal of chromium (Cr) and its compounds, especially hexavalent chromium (Cr(VI)), results in soil and ground water pollution and is consequently harmful to human health. In this study, three-dimensional electro-kinetic remediation of Cr-contaminated soil is investigated by coupling a two-dimensional electrode with a permeable reactive barrier (PRB) with a graphite electrode as the third electrode. Mixed zero-valent iron and zeolite are used as filling materials in the PRB. Moreover, three experimental conditions, i.e. two-dimensional electro-kinetic remediation with and without PRB and three-dimensional electro-kinetic remediation with PRB, are investigated herein. The results are evaluated based on the removal rate and leaching efficiency both in the pre- and post-experiments. Upon comparing the three conditions, the results show that three-dimensional electro-kinetic remediation with PRB has a better effect on both leaching efficiency and removal rate of contaminated soil. Single and multifactor experiments were designed to explore the optimum conditions on the basis of three-dimensional remediation. Graphite particles with a 5% dosage, resulted from the single-factor experiments, are used in the multi-factor experiments. The results show that the best remediation efficiencies are achieved after 12 d using 0.05 mol L−1 citric acid and a voltage gradient of 1.5 V cm−1 in three-dimensional electro-kinetic remediation coupled with PRB.
1 Introduction
Soil is a natural resource and an important component of the ecological environment. In recent years, with the development of industrialization, soil contamination has reached at an alarming level worldwide.1,2 In China, about 1/5 (2 × 10⁷ h m2) of the cultivated soil area is contaminated by heavy metals such as chromium (Cr), arsenic (As), and lead (Pb). Among these heavy metals, Cr and its compounds are commonly used in metallurgy, electroplating, tanning, and pigment industries. Therefore, during the production and processing of Cr salts, large amounts of wastewater and residues are generated. The improper treatment of Cr residues causes air pollution.3 Furthermore, hexavalent chromium is highly soluble and causes soil pollution as a result of runoff and infiltration during rainfall. These metals not only deteriorate the soil quality but also affect crops during water uptake and are ultimately a hazard to the human health. Therefore, the remediation of Cr-contaminated soil is a major concern.Electro-kinetic remediation has been an effective technique to remediate heavy metals from contaminated soil in recent years. It is highly economic as compared to other technologies and has the following characteristics: less labour-intensiveness, simple maintenance, and quick response without the production of secondary pollution. Therefore, more studies have been conducted on electro-kinetic remediation using two-dimensional electrodes across the world, and some European countries have successfully applied it in the field.4–7 Herein, a new chemical treatment technology called three-dimensional electrode is introduced. It is based on a two-dimensional electrode that is filled with granular materials. These granular materials act as a third electrode/working electrode and have a greater specific surface area as compared to the two-dimensional electrode. Thus, electrochemical reactions are carried on the higher surface area working electrode, which effectively increases the mass transfer effect, current efficiency, and space-time yield.8–10 Recently, three-dimensional electrodes have been widely used for the treatment of wastewater. Chu et al. used them for the removal of COD and colour from wastewater and regarded them as the best technique.11 In another study, Paidar et al. also achieved good results using the abovementioned electrodes for the removal of copper and zinc ions from synthetic solutions.12 However, their scope is limited for the treatment of contaminated soils.
Electro-kinetic remediation has good results at the laboratory scale as compared to those in field studies. Herein, the electro-kinetic remediation technique coupled with PRB technology is used. Permeable reactive barrier technology is an in situ remediation technique that involves the use of tools to dig out soil and then fill a reactive medium to treat the soil and groundwater.13,14 Currently, the PRB technology is often used with zero-valent iron as the medium to treat contaminated soil and groundwater, and it has been proven as an effective technique to treat several contaminants. The reliability of this technique was proven by Natale et al. where they used an activated carbon PRB for the removal of cadmium from a contaminated shallow aquifer.15 Similarly, Erto et al. also used an activated carbon PRB for the in situ treatment of aquifers contaminated by chlorinated organic compounds and obtained excellent results.16 On the other hand, Liu et al. achieved good results using natural pyrite as a reactive medium for the treatment of Cr(VI)-contaminated groundwater.17 Zero-valent iron is used because of its economic value, abundant sources, and high reducibility. It can transform free heavy metal ions (Cr(VI)) into less mobile ions (Cr(III)) or form precipitates.18,19 Zeolite has good adsorption and ion exchange function; thus, it is often used as a filling material and adsorbent.20 Basically, electro-kinetic remediation involves the migration and precipitation of ions in the presence of an electric field. During migration, ions come in contact with the PRB and are reduced by zero-valent iron for example Cr(VI) into Cr(III). Moreover, Cr ions are adsorbed by the absorber (zeolite); this will improve the electro-kinetic remediation effect. Therefore, herein, a mixture of zero-valent iron and zeolite is used as the reactive material in the PRB.
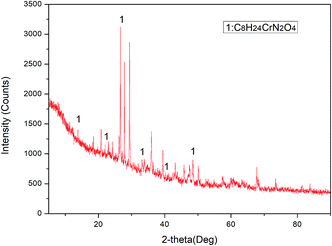
The main objective of the current study was to explore the effect of a three-dimensional electrode coupled with a PRB on the treatment of Cr-contaminated sites. In this study, we have discussed (a) the comparison between three-dimensional and two-dimensional electro-kinetic remediation of Cr-contaminated soil; (b) the enhanced utility of a self-made PRB containing a reducer and absorber; and (c) the optimal experimental parameters of three-dimensional electro-kinetic remediation. The leaching toxicity and heavy metal contents before and after electro-kinetic remediation were measured to evaluate the experimental results. X-ray diffraction (XRD) and morphological analysis (Tessier) were used to further analyse the characteristics of the soil samples and explore the removal mechanism of heavy metals.
2 Materials and methods
2.1 Materials
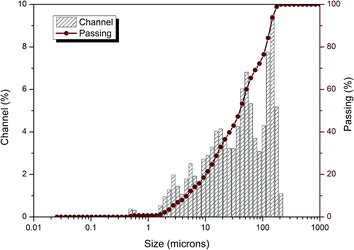
Soil samples were obtained from Minfeng Chemical Industry, Wellhead Industrial Park, Chongqing City, which was chosen because of the excess of Cr ions in its soil. Samples were obtained from 4 points randomly and sealed in plastic bags, and the sampling depth was about 0–15 cm. Afterwards, the samples were dried at 105 °C for 12 h, ground for 6 h in a roller ball grinder, and sieved through a 200-mesh. Herein, leaching toxicity tests were carried out on the soil samples, and the leachate with the maximum concentration of Cr was selected for further experiments. In addition, the PRB medium contained a filter fabric that was filled with zero-valent iron and zeolite as the reactive medium on an equal mass basis.2.2 Physical and chemical analysis
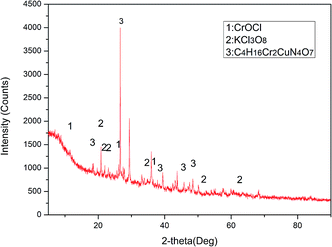
| O | Ca | Si | Cr | Fe | Al |
|---|---|---|---|---|---|
| 48.8788 | 12.2459 | 11.8837 | 9.4001 | 7.5956 | 7.3101 |
| Mg | S | K | Na | Ti | Ni |
|---|---|---|---|---|---|
| 5.7814 | 1.3629 | 0.6121 | 0.3473 | 0.3001 | 0.0580 |
| V | Sr | P | Zn | Co | Zr |
|---|---|---|---|---|---|
| 0.0573 | 0.0437 | 0.0404 | 0.0363 | 0.0362 | 0.0101 |
2.3 Experimental device
The electro-kinetic remediation experiments were conducted in a rectangular glass reactor with the dimensions of 10 cm × 7 cm × 8 cm (Fig. 3). Activated carbon and graphite worked as the third electrode/particle electrode in the three-dimensional electrode reactor.22,23 In the current study, graphite particles were used as the third electrode. On the other hand, graphite and stainless-steel plates were used as the anode and cathode electrodes, respectively, and power was supplied via an aluminium wire. The experimental sample was Cr-contaminated soil with a 50% moisture content. Potassium chloride (0.1 mol L−1) was used as the electrolytic solution in the anode and cathode regions. In the three-dimensional electro-kinetic remediation coupled with PRB, a 150 g uniform mixture of Cr-contaminated soil and graphite particles were placed in the sample reaction region (Fig. 3(b)) according to its capacity. The sample was evenly divided into three regions, as shown in Fig. 3, T1 (near the anode region), T2 (middle area), and T3 (near the cathode region). According to the literature and experimental conditions, the PRB grid was placed between the T1 and T2 regions, as shown in Fig. 3(b).24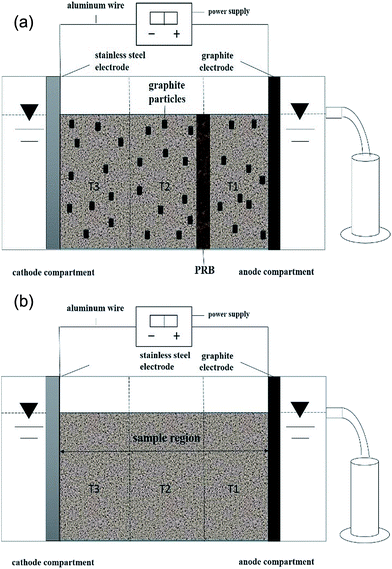 | ||
| Fig. 3 Electro-kinetic remediation experimental set-up. (a) Two-dimensional electrolytic cell and (b) three-dimensional electrolytic cell coupled with PRB. | ||
2.4 Design of experiment
| Group | Dosing ratio | Voltage gradient | Repair time |
|---|---|---|---|
| A1 | 0% | 1.5 V cm−1 | 5 d |
| A2 | 5% | 1.5 V cm−1 | 5 d |
| A3 | 10% | 1.5 V cm−1 | 5 d |
| A4 | 15% | 1.5 V cm−1 | 5 d |
| A5 | 20% | 1.5 V cm−1 | 5 d |
| Factor | Levels | ||
|---|---|---|---|
| 1 | 2 | 3 | |
| Citric acid (CA) | 0 mol L−1 | 0.05 mol L−1 | 0.1 mol L−1 |
| Voltage gradient (VG) | 1 V cm−1 | 1.5 V cm−1 | 2 V cm−1 |
| Repair time (RT) | 4 d | 8 d | 12 d |
| Group | Citric acid | Voltage gradient | Repair time |
|---|---|---|---|
| A1 | 1 | 1 | 1 |
| A2 | 1 | 3 | 2 |
| A3 | 1 | 2 | 3 |
| A4 | 2 | 1 | 2 |
| A5 | 2 | 2 | 1 |
| A6 | 2 | 3 | 3 |
| A7 | 3 | 1 | 3 |
| A8 | 3 | 2 | 2 |
| A9 | 3 | 3 | 1 |
2.5 Calculation of results
To investigate the effectiveness of this technique, Cr leaching toxicity and Cr contents were determined both pre- and post-experiment. Then, the post-experiment results were compared with the pre-experiment results. Chromium removal rate and leaching efficiency were determined using the following formula:where y is the heavy metal removal rate or leaching efficiency of Cr. U0 is the content or leaching efficiency in the original soil sample, and U represents the contents or leaching efficiency after electro-kinetic remediation.
3 Results and discussion
3.1 Macro phenomena
Similar experimental phenomena were observed under all experimental conditions. In the B and C experimental conditions, more bubbling and a darker yellow colour were observed at the anode region than those under the A experimental condition. The intensity of these phenomena is more prominent under the C experimental condition. The phenomena generated in the three experimental conditions and brief explanations are as follows.(a) A bubbling phenomenon due to a hydrolysis reaction is observed at the cathode and anode electrodes upon connection with the power source. The following reactions take place as the power is supplied:
Anodic reaction:
Cathodic reaction:
| 2H2O + 2e− → 2OH− + H2↑ |
(b) The electrolytic solution changes to yellow brown in the anode region and becomes darker with time; this phenomenon is because of migration of Cr(VI) from the cathode to the anode tank.
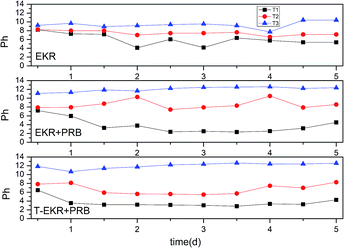
(c) During the experiment, the soil within the sample area gradually became compacted and hardened as precipitation occurred due to the presence of OH− ions in the alkaline environment at the cathode area.
3.2 Three experimental conditions
| Group | Region | Removal rate of Cr(VI) | Average | Removal rate of total Cr | Average | Leaching efficiency | Average |
|---|---|---|---|---|---|---|---|
| A-EKR | T1 | 11.57% | 23.51% | 21.94% | 21.54% | 41.79% | 53.92% |
| T2 | 16.23% | 20.75% | 50.09% | ||||
| T3 | 42.72% | 21.94% | 69.87% | ||||
| B-EKR + PRB | T1 | 25.35% | 40.53% | 21.20% | 20.16% | 62.21% | 72.21% |
| T2 | 42.86% | 14.95% | 72.42% | ||||
| T3 | 53.37% | 24.32% | 81.99% | ||||
| C-T-EKR + PRB | T1 | 25.76% | 42.99% | 20.32% | 21.76% | 67.79% | 75.66% |
| T2 | 44.45% | 21.74% | 75.05% | ||||
| T3 | 58.75% | 23.22% | 84.13% |
3.3 Single-factor experiment
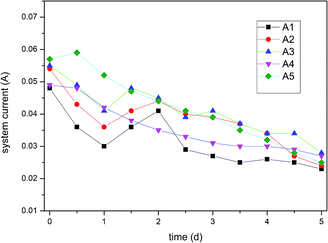
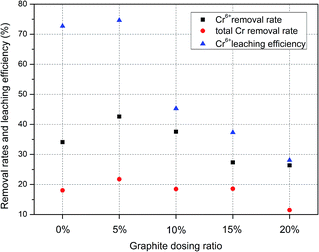
The highest removal rates and leaching efficiency of Cr are observed at the graphite particle dosage of 5%. This means at this level, the Cr(VI) and total Cr contents are lowest in the contaminated soil. In contrast, a higher concentration of graphite (20%) causes the worst experimental result. This is because excess graphite particles may cause blockage of the ion migration paths;
This results in high resistance, affects current, and ultimately hinders ions movement. Therefore, a high dosing ratio is not proportional to a good remediation effect, and it is concluded that a 5% dosage ratio is optimum for the remediation of Cr-contaminated soil.
3.4 Multi-factor experiment
| Group | CA | VG | RT | Removal rate of Cr(VI) |
|---|---|---|---|---|
| A1 | 1 | 1 | 1 | 18.06% |
| A2 | 1 | 3 | 2 | 36.70% |
| A3 | 1 | 2 | 3 | 46.26% |
| A4 | 2 | 1 | 2 | 45.10% |
| A5 | 2 | 2 | 1 | 43.34% |
| A6 | 2 | 3 | 3 | 49.59% |
| A7 | 3 | 1 | 3 | 43.01% |
| A8 | 3 | 2 | 2 | 50.31% |
| A9 | 3 | 3 | 1 | 44.24% |
| kj1 | 33.67 | 35.39 | 35.21 | |
| kj2 | 46.01 | 46.64 | 44.04 | |
| kj3 | 45.85 | 43.51 | 46.29 | |
| Optimal levels | CA2 | VG2 | RT3 | |
| R | 12.34 | 11.25 | 11.07 | |
| Main sequence | CA > VG > RT | |||
| Group | CA | VG | RT | Removal rate of total Cr |
|---|---|---|---|---|
| A1 | 1 | 1 | 1 | 12.77% |
| A2 | 1 | 3 | 2 | 20.36% |
| A3 | 1 | 2 | 3 | 21.53% |
| A4 | 2 | 1 | 2 | 17.66% |
| A5 | 2 | 2 | 1 | 15.99% |
| A6 | 2 | 3 | 3 | 23.81% |
| A7 | 3 | 1 | 3 | 19.41% |
| A8 | 3 | 2 | 2 | 8.64% |
| A9 | 3 | 3 | 1 | 6.94% |
| kj1 | 18.22 | 16.61 | 11.90 | |
| kj2 | 19.15 | 15.39 | 15.55 | |
| kj3 | 11.66 | 17.04 | 21.58 | |
| Optimal levels | CA2 | VG3 | RT3 | |
| R | 7.49 | 1.65 | 9.68 | |
| Main sequence | RT > CA > VG | |||
| Group | CA | VG | RT | Leaching efficiency |
|---|---|---|---|---|
| A1 | 1 | 1 | 1 | 26.84% |
| A2 | 1 | 3 | 2 | 27.72% |
| A3 | 1 | 2 | 3 | 66.04% |
| A4 | 2 | 1 | 2 | 61.83% |
| A5 | 2 | 2 | 1 | 62.79% |
| A6 | 2 | 3 | 3 | 74.04% |
| A7 | 3 | 1 | 3 | 57.42% |
| A8 | 3 | 2 | 2 | 70.06% |
| A9 | 3 | 3 | 1 | 66.09% |
| kj1 | 40.20 | 48.70 | 51.90 | |
| kj2 | 66.22 | 66.30 | 53.20 | |
| kj3 | 64.52 | 55.95 | 65.83 | |
| Optimal levels | CA2 | VG2 | RT3 | |
| R | 26.02 | 17.60 | 13.93 | |
| Main sequence | CA > VG > RT | |||
3.5 Removal mechanisms of Cr
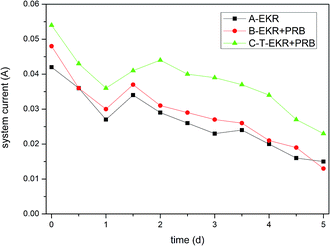
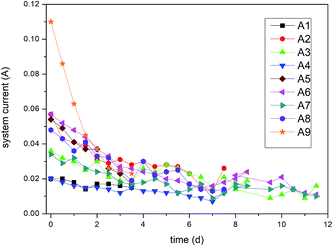
From the abovementioned analysis, macro-phenomena (e.g. bubbling and precipitation), system current, and pH value were observed at regular intervals. The experimental results were analysed using the removal rates and leaching efficiency. The removal mechanisms contain the following steps: (a) the remediation is mainly focused on acid-extractable Cr. (b) Acid-extractable Cr(VI) is reduced by PRB medium and reduced Cr(III) forms complexes with Fe. (c) Moreover, the addition of a certain amount of graphite particles enhances the reaction efficiency, and more extractable Cr(VI) is reduced. (d) Higher precipitation of Cr [Cr(OH)3] is experienced in the cathode region because of high pH. Hence, the remediation of total Cr is not ideal in this region. (e) In the acidification-enhanced experiments, the addition of organic acids not only plays an important role in neutralizing the pH of the cathode region but also accelerates the release of ions.28,29 Our results are supported by Yang Jiewen,30 who have also concluded that iron oxide and organic acids play a vital role in reducing the toxicity of Cr(VI) and can be used for the remediation of Cr from soils.
4 Conclusion
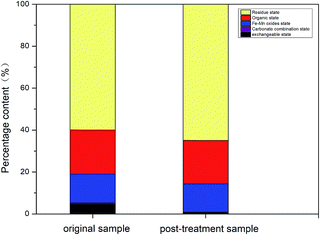
The soil used in the experiments had higher Cr contents as compared to residential land secondary standards (GB15618-2008), and its leaching toxicity also exceeded the standard value of the solid waste leaching toxicity (GB5085.3-2007). The following conclusions were made from this study: (1) three electro-kinetic experiments were carried out to determine their effectiveness for Cr remediation. The coupling experiments using the PRB (EKR + PRB, T-EKR + PRB) had better results than the traditional two-dimensional electro-kinetic remediation. In contrast, the maximum efficiency was observed in the three-dimensional electro-kinetic experiment coupled with the PRB (T-EKR + PRB); (2) the graphite particle dosage ratio of 5% had a more reliable effect as compared to the higher dosages, which had inhibitory effects on the remediation process; (3) in the multi-factor orthogonal experiments, Cr(VI) and total Cr remediation were greatly influenced by acidification pre-treatment and repair time, respectively, based on the analysis of individual factors. Moreover, the orthogonal multi-factor experiment results showed that the best results were achieved using citric acid at a concentration of 0.05 mol L−1, voltage gradient of 1.5 V cm−1, and repair time of 12 d in the T-EKR + PRB system; and (4) finally, three-dimensional electro-kinetic remediation coupled with PRB had a good influence on exchangeable and acid extractable-Cr rather than that on organic and residual Cr. Thus, this technique can be recommended for the remediation of Cr-contaminated soils.Conflicts of interest
There are no conflicts to declare.References
- Z. Yao, J. Li, H. Xie and C. Yu, Procedia Environ. Sci., 2012, 16, 722–729 CrossRef CAS.
- T. Yang, L. Meng, S. Han, J. Hou, S. Wang and X. Wang, RSC Adv., 2017, 7, 34687–34693 RSC.
- Z. Wanliang, Z. Manli, C. Hongying, L. Anping, Y. Dongxia and Z. Xuemei, Procedia Environ. Sci., 2016, 31, 247–254 CrossRef.
- D. Li, D. Sun, S. Hu, J. Hu and X. Yuan, Chemosphere, 2016, 144, 1823–1830 CrossRef CAS PubMed.
- T. Huang, D. Li, L. Kexiang and Y. Zhang, Sci. Rep., 2015, 5, 15412 CrossRef CAS PubMed.
- A. T. Yeung and Y. Y. Gu, J. Hazard. Mater., 2011, 195, 11–29 CrossRef CAS PubMed.
- X. Huang, T. Huang, S. Li, F. Muhammad, G. Xu, Z. Zhao, L. Yu, Y. Yan, D. Li and B. Jiao, Ceram. Int., 2016, 42, 9538–9549 CrossRef CAS.
- D. Li, Y.-Y. Niu, M. Fan, D.-L. Xu and P. Xu, Sep. Purif. Technol., 2013, 120, 52–58 CrossRef CAS.
- K. Grace Pavithra, P. Senthil Kumar, F. Carolin Christopher and A. Saravanan, J. Phys. Chem. Solids, 2017, 110, 379–385 CrossRef.
- Y. Zhang, T. Huang, X. Huang, M. Faheem, L. Yu, B. Jiao, G. Yin, Y. Shiau and D. Li, RSC Adv., 2017, 7, 27846–27852 RSC.
- H. Q. Chu, Z. Wang and Y. Liu, J. Environ. Chem. Eng., 2016, 4, 1810–1817 CrossRef CAS.
- M. Paidar, K. Bouzek, M. Laurich and J. Thonstad, Water Environ. Res., 2000, 72, 618–625 CrossRef CAS.
- P. Oprčkal, A. Mladenovič, J. Vidmar, A. Mauko Pranjić, R. Milačič and J. Ščančar, Chem. Eng. J., 2017, 321, 20–30 CrossRef.
- H. Pullin, R. A. Crane, D. J. Morgan and T. B. Scott, J. Environ. Chem. Eng., 2017, 5, 1166–1173 CrossRef CAS.
- F. Di Natale, M. Di Natale, R. Greco, A. Lancia, C. Laudante and D. Musmarra, J. Hazard. Mater., 2008, 160, 428–434 CrossRef CAS PubMed.
- A. Erto, I. Bortone, A. Di Nardo, M. Di Natale and D. Musmarra, J. Environ. Manage., 2014, 140, 111–119 CrossRef CAS PubMed.
- Y. Y. Liu, H. Y. Mou, L. Q. Chen, Z. A. Mirza and L. Liu, J. Hazard. Mater., 2015, 298, 83–90 CrossRef CAS PubMed.
- A. Galdames, A. Mendoza, M. Orueta, I. S. de Soto García, M. Sánchez, I. Virto and J. L. Vilas, Resource-Efficient Technologies, 2017, 3, 166–176 CrossRef.
- Y. Li, T. Li and Z. Jin, J. Environ. Sci., 2011, 23, 1211–1218 CrossRef CAS.
- M. M. Arimi, Prog. Nat. Sci.: Mater. Int., 2017, 27, 275–282 CrossRef CAS.
- R. Chen, Y. Li, R. Xiang and S. Li, Constr. Build. Mater., 2016, 123, 120–126 CrossRef CAS.
- B. Shen, X.-h. Wen and X. Huang, Chem. Eng. J., 2017, 327, 597–607 CrossRef CAS.
- H. I. Gomes, C. Dias-Ferreira and A. B. Ribeiro, Chemosphere, 2012, 87, 1077–1090 CrossRef CAS PubMed.
- J. Zhang, C. Zhang, G. Wei, Y. Li, X. Liang, W. Chu, H. He, D. Huang, J. Zhu and R. Zhu, J. Colloid Interface Sci., 2017, 500, 20–29 CrossRef CAS PubMed.
- M. Szabó, J. Kalmár, T. Ditrói, G. Bellér, G. Lente, N. Simic and I. Fábián, Inorg. Chim. Acta, 2017 DOI:10.1016/j.ica.2017.05.038.
- D. Pei, C. Xiao, Q. Hu and J. Tang, Procedia Environ. Sci., 2016, 31, 725–734 CrossRef.
- N. D. Mu'azu, M. H. Essa and S. Lukman, J. King Saud Univ., Eng. Sci., 2016 DOI:10.1016/j.jksues.2016.12.002.
- R. Fu, D. Wen, X. Xia, W. Zhang and Y. Gu, Chem. Eng. J., 2017, 316, 601–608 CrossRef CAS.
- G. Li, X. Yang, L. Liang and S. Guo, Arabian J. Chem., 2017, 10, S539–S545 CrossRef CAS.
- J. Yang, L. Zhong and L. Liu, J. Environ. Chem. Eng., 2017, 5, 2564–3256 CrossRef CAS.
Footnote |
| † These authors contributed equally to the work. |
| This journal is © The Royal Society of Chemistry 2017 |

