 Open Access Article
Creative Commons Attribution 3.0 Unported Licence
Synthesis and characterization of green tea (Camellia sinensis (L.) Kuntze) extract and its major components-based nanoflowers: a new strategy to enhance antimicrobial activity
Ayşe Baldemira,
N. Buse Köseb,
Nilay Ildızc,
Selen İlgüna,
Sadi Yusufbeyoğlub,
Vedat Yilmazd and
Ismail Ocsoy *d
*d
aErciyes University, Faculty of Pharmacy, Department of Pharmaceutical Botany, 38039, Melikgazi, Kayseri, Turkey
bErciyes University, Faculty of Pharmacy, 38039, Melikgazi, Kayseri, Turkey
cErciyes University, Faculty of Pharmacy, Department of Pharmaceutical Microbiology, 38039, Melikgazi, Kayseri, Turkey
dErciyes University, Faculty of Pharmacy, Department of Analytical Chemistry, 38039, Melikgazi, Kayseri, Turkey. E-mail: ismailocsoy66@gmail.com
First published on 14th September 2017
Abstract
In this study, for the first time, a novel organic–inorganic nanobio-antimicrobial agent called “nanoflowers” (Nfs) from Camellia sinensis (L.) Kuntze extracts and its main components were produced and the increase in the antimicrobial activity of the Nfs was elucidated. While the green tea (GT) extract (obtained in ethanol and water) and its main components (caffeine, catechin) were involved as organic components in the formation of the Nfs, copper(II) ions (Cu2+) were the inorganic component. The structures of the Nfs were examined with several techniques such as Scanning Electron Microscopy (SEM), Fourier transform infrared spectrometry (FT-IR) and Energy-Dispersive X-ray (EDX) spectroscopy. The structural examination demonstrated that the presence of Cu–O and Cu–N bonds in Nfs can be an indication of the Nfs formation. Antimicrobial activities of the free GT extracts, caffeine (cf), catechin (ct) and their Nfs were systematically studied against Staphylococcus aureus (ATCC 25923), Escherichia coli (ATCC 25922) and Candida albicans (ATCC 90028) with broth microdilution and short time-kill assay. The peroxidase-mimicking activity depending on a Fenton-like reaction mechanism of the Nfs was measured against guaiacol in the presence of H2O2. In addition, total phenol contents of free GT extracts and their Nfs were calculated by Folin Ciocalteu method. Our results demonstrated that plant extract based Nfs technology is promising and may find potential applications in various scientific and technical fields.
1. Introduction
Green tea (Camellia sinensis (L.) Kuntze) has various pharmacological properties due to it containing alkaloids (caffeine) and catechin derivatives.1–3 Green tea (GT) is widely used in cosmetic preparations owing to its antioxidant photoprotection,4 aging and antiwrinkle,5 skin whitening,6 skin infection (antimicrobial),7 hair growth,8 and antidandruff,9 properties. Research is ongoing to improve or discover the potential benefits of GT in biomedicine.10Various plant extracts and their active components are often used as reducing and capping agents for metallic nanomaterials synthesis. Plant extracts have several advantages in nanomaterials synthesis owing to the following: (1) they are very cheap; (2) they are readily available; (3) there is no risk of contamination and (4) no expertise, intensive labor and complicated instrumentation are required for extract preparation. In this context, several works reported that plant extract directed, antibiotics incorporated nanomaterials and/or nanoclusters show high antimicrobial activities against different microorganisms.11–18
Herein, we reported a systematic study for fabrication of plant extract based hierarchical organic–inorganic nanoflower with newly reported elegant approach. Recently, Zare and co-workers discovered an encouraging breakthrough in formation of enzyme and copper phosphate (Cu3(PO4)2) incorporated flower shaped hybrid nanostructures called “nanoflower” with much enhanced catalytic activities compared to free and conventional immobilized enzymes.19 The main success of obtaining highly enhanced catalytic activities are attributed to flower shape, high surface area and the increase in local concentration of enzyme in nanoflower (Nf). Addition to that concept, Li and coworkers used natural amino acids as organic component and using copper ions (Cu2+) as inorganic component to produce a novel nanoflower.20 They claim that Cu2+ preferably react with amide groups and carboxyl groups of amino acids for formation of nanoflowers.
In present study, we report the self-assembly of the GT extracts with coordination of metal ion for the formation of hybrid nanostructures called as Nf and show their peroxidase like and antimicrobial activity. GT extracts/its main components and copper(II) ions (Cu2+) acted as the organic component and the inorganic component, respectively in the Nfs. The Nfs were characterized with several techniques including SEM, FT-IR and EDX. The presence of Cu2+ in Nfs promoted them to show peroxidase-mimicking activity depending on Fenton-like reaction mechanism against guaiacol used as a model substrate. In addition to that, antimicrobial activities of the free GT extracts, some standards molecules, caffeine (cf), catechin (ct) and their Nfs were evaluated. We claim that plant extract incorporated Nfs may expand their uses as promising antimicrobial and catalytic agents in a variety of technical and scientific fields.
2. Experimental section
2.1. Chemicals and reagents
Caffeine, (+)-catechin, copper sulfate pentahydrate, methanol, phosphoric acid, NaCl, KCl, Na2HPO4, KH2PO4, HCl, NaOH and coomassie brilliant blue G-250 were purchased from Sigma-Aldrich.2.2. Preparation of GT extracts
Organically produced GT was purchased from province Trabzon of Turkey. Two different extract are prepared from GT. In water extract (CW), 20 g of GT is macerated at 40 °C with using magnetic stirring for 1 day. Then, the extract was filtered through Whatman filter paper No. 1 (pore size 25 μm) and evaporated to dryness in vacuo at 40 °C. In ethanolic extract (CE), 20 g of GT was extracted with ethanol at room temperature for three days. At the end of the day, the extract is filtered and the solvent is added again. Then, filtrates were combined and to dryness in vacuum at 40 °C. The dried extract was stored in refrigerator at −20 °C for studies.2.3. Synthesis of GT extracts based-Cu2+ hybrid nanoflower
The hybrid nanostructures were synthesized following modified reported method.19–28 Both GT extracts, cf and ct with concentrations of 0.1 and 0.5 mg mL−1 were separately added into the mixture containing 50 mL of 10 mM PBS (pH 7.4) and 0.8 mM Cu2+ ion. The each mixture was vortexed for 30 s, and then was incubated at 4 °C for 3 days without disturbing. The precipitates occurred at the bottom of reaction tubes were collected and washed with water using centrifugation at 10![[thin space (1/6-em)]](https://www.rsc.org/images/entities/char_2009.gif) 000 rpm for 15 min. The washing process was repeated 3 times and the final products were dried at 50 °C for further characterization and use.
000 rpm for 15 min. The washing process was repeated 3 times and the final products were dried at 50 °C for further characterization and use.
2.4. Characterization of GT extracts, catechin and caffeine based-Cu2+ hybrid nanoflower
The Nfs were characterized using Scanning Electron Microscopy (SEM, ZEISS EVO LS10), Fourier transform infrared spectroscopy (FTIR, Perkin Elmer 400 FT-IR Spectrometer Spotlight 400 Imaging System) and energy dispersive X-ray (ZEISS EVO LS10) analysis. UV-vis spectra were collected with HITACHI UV-vis spectrophotometer.2.5. Catalytic activity of GT extracts based-Cu2+ hybrid nanoflower
The catalytic activity of identical amount Nfs of GT obtained from ethanol (GTe-Nf) and water (GTw-Nf) extraction techniques were tested towards guaiacol using spectroscopic method. A typical activity measurement protocol (pH 6.8, 0.1 M KH2PO4, 25 °C) was used. The both GTe-Nf and GTw-Nf were separately dissolved in 1 mL of PBS and it was followed by addition of 1 mL of 22.5 mM hydrogen peroxide (H2O2) and 1 mL of 45 mM guaiacol. After incubation of the each resulting mixture, the changes in absorbance values based on oxidation of guaiacol were also recorded at 470 nm using a UV-vis spectrophotometer.2.6. Evaluation of antimicrobial activity of free GT extracts, catechin, caffeine and their Nfs
Minimum bactericidal concentration (MBC), minimum fungicidal concentration (MFC) and minimum inhibitory concentration (MIC) assays were studied according to Clinical laboratory standards.29,30 Candida albicans ATCC 90023, Staphylococcus aureus ATCC 25923 and Escherichia coli ATCC 25922 were used as standard microorganisms. The concentrations of microorganisms were 1 × 10⁸ CFU mL−1 for bacteria, 1 × 10⁶ CFU mL−1 for yeast at 0.5 McFarland standard turbidity. MIC values were measured by preparing serial dilutions from standard concentration of extracts (12.5–200 μg mL−1) and nanoflowers (1.25–20 μg mL−1) by using Mueller Hinton broth (MHB) for bacteria and RPMI medium for fungus. Mueller Hinton agar (MHA) plates were used to measure MBC after 18 hours for bacteria. The MBC is defined as the minimum concentration at which there is a 3 log reduction in the CFU. The data were recorded as survival rates (CFU mL−1), based on 100% survival for the untreated control. All MIC and MBC values were reported based on three experimental repeats indicating reproducibility of the obtained results. The minimum fungicidal concentration (MFC) of each sample required to kill 99% of the yeast cells was determined by spreading of 10 μL portions from each well with no growth on Sabouraud Dextrose Agar (SDA) plates. Following incubation for 24 hours, the plates were observed for growth and the MFCs were calculated. Also short time killing method used to confirmed 100% reduction of viable microorganism population using by Live/Dead fluorescence staining according to Guo et al. (2017).31 The short time killing method was done with LIVE/DEAD® BacLight™ Bacterial Viability Kit (LIVE/DEAD L-13152, Invitrogen™, Molecular Probes Inc., USA). The samples were stained using this kit, containing separate vials of the two component dyes (SYTO 9 and propidium iodide) for staining of the microorganisms and examined with Nicon Eclipse Ti-S fluorescence microscope.2.7. Total phenolic contents of GT extracts and Nfs
Total phenols were estimated as gallic acid equivalents (GAE), expressed as mg gallic acid per g extract.32 500 μL undiluted Folin–Ciocalteu reagent was added to 100 mL flask containing 6.0 mL H2O and 100 μL sample. Then after 1 min, 1.5 mL of 20% (w/v) Na2CO3 and 10.0 mL H2O were placed into the resulting mixture. It was allowed to leave 2 h incubation at 25 °C, the absorbance was recorded at 760 nm and compared to a gallic acid calibration curve. The data were presented as the average of triplicate analyses.3. Results and discussion
Formation of GT extracts (extracted in ethanol and water) and standard molecules (caffeine, cf and catechin, ct) incorporated nanoflowers (Nfs) were carried out in phosphate buffered saline (PBS, pH 7.4) at room temperature with 72 h incubation. We explained the mechanism underlying peroxidise like and antimicrobial activities of the Nfs. We demonstrated effect of concentration extracts and standard molecules, cf and ct on the formation of Nfs. Interestingly, the morphology of GT extracts obtained in ethanol and ct-Nfs and GT extract obtained in water and cf highly resemble each other.3.1. Characterization of GT extracts-Cu2+ hybrid nanoflower
In typical nanoflower synthesis procedure, Cu2+ ions react with amine groups of organic molecules (amino acid, peptide, protein and enzyme) and flower like formation was completed in PBS buffer. Herein, we claim that Cu2+ ions show coordination chemistry with amide groups and/or carboxyl and diol groups of the extracts and standard molecules acted as organic components in PBS and induce the formation of Nfs.The NFs were completed with three successive steps, such as nucleation, growth process and completion of formation. (1) In nucleation step, primary copper phosphate nanocomplexes were occurred from Cu2+ and phosphate ions, then they predominantly bind to amide groups and/or carboxyl and diol groups of organic components to form seed, (2) in the growth step, the primary nanocrystals continue to react with the organic molecules, then petal like structures were appeared and (3) the Nfs were completely formed by sticking of petals in the last step.
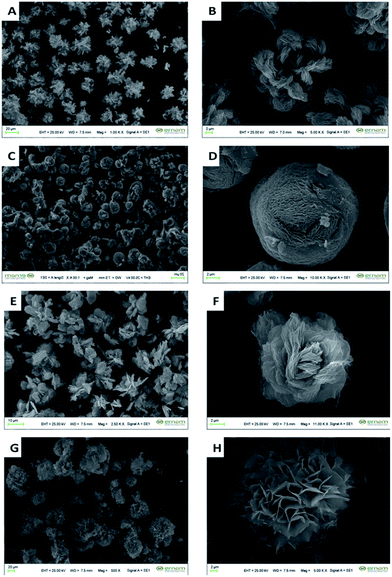
SEM images in Fig. 1A–H shows that the GTe-Nf, GTw-Nf, ct-Nf and cf-Nf have spherical morphologies with narrow size distribution. The diameters of the Nf are ∼5.5 μm. It is worth to mention that the morphology of GTe-Nf (Fig. 1A) and ct-Nf (Fig. 1C) are very similar each other, while morphology of the GTw-Nf (Fig. 1B) and cf-Nf (Fig. 1D) are not exactly similar. We speculate that the major content of the extract obtained in ethanol can be ct, which is less soluble in water compared to cf. Furthermore, GTw-Nf are quite compact due to the contribution of both the hydrophobic and hydrophilic component obtained in water extraction. The cf-Nfs gives blooming structures, which can be due to water solubility of cf.
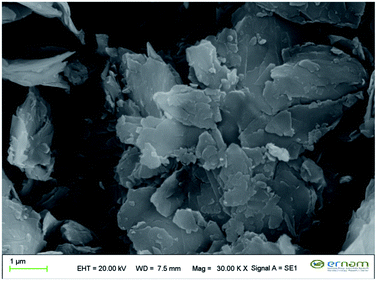
Fig. 2 provided SEM image of (Cu3PO4)3 crystal. It seems that only debris of no (Cu3PO4)3 crystal was observed but no Nfs was formed. The Nfs are formed when caffeine and catechin standard molecules or plant extracts as organic parts and copper ions as inorganic parts are present in the PBS.
GTe-Nf, green tea ethanol extract nanoflower; GTw-Nf, green tea water extract nanoflower; ct-Nf, catechin nanoflower; cf-Nf, caffeine nanoflower.
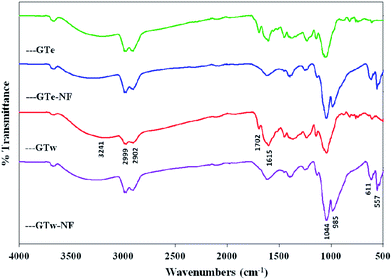
The FT-IR spectra of GTe, GTe-Nf, GTw and GTw-Nf materials are illustrated in Fig. 3, respectively. As expected, both the extracts (GTe and GTw) and extracts-Nfs (GTe-Nf and GTw-Nf) exhibited similar spectral profiles. The following characteristics bands in the extracts were obtained by FT-IR: 3241 cm−1 (–OH stretching), 2902 cm−1 and 2988 cm−1 (C–H aliphatic), 1702 cm−1 (carbonyl), 1615 cm−1 (–NH bending). The new absorption bands at 557 cm−1, 611 cm−1, 985 cm−1 and 1044 cm−1 were appeared in the extract-Nfs which are attributed to P–O and P![[double bond, length as m-dash]](https://www.rsc.org/images/entities/char_e001.gif) O vibrations, indicating the existence of phosphate groups (PO43−).21 This also confirmed the successful preparation of the extracts-Cu2+ hybrid nanoflowers using copper(II) sulphate and GT extracts in the presence of PBS buffer.
O vibrations, indicating the existence of phosphate groups (PO43−).21 This also confirmed the successful preparation of the extracts-Cu2+ hybrid nanoflowers using copper(II) sulphate and GT extracts in the presence of PBS buffer.
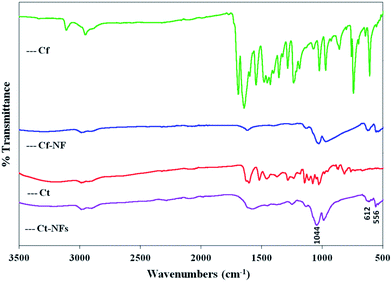
Similarly, the FT-IR spectra of cf, cf-Nf, ct and ct-Nfs are depicted in Fig. 4. The presence of three peaks at 556 cm−1, 611 cm−1 and 1044 cm−1 was assigned to phosphate groups from copper(II) phosphate crystals.
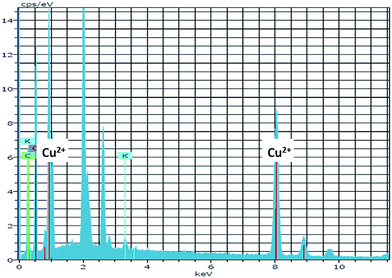
The NFs were elementally analyzed using EDX. Fig. 5 justifies that the NFs contain copper atoms in the skeleton of the NFs.
3.2. Catalytic activity of GT-Nfs
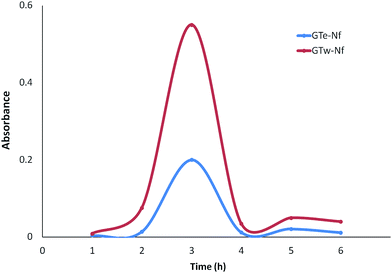
The catalytic activities of GT-Nfs were measured against guaiacol in the presence of the H2O2. The absorbance changes of the product were spectrophotometrically recorded at 470 nm (Fig. 6). The more catalytic activity was exhibited via the Nfs which have plenty of negatively charged groups and Cu2+ ions. The negatively charged groups may oxidize the substrate by producing Cu+ ions in the Nfs depending on the Fenton like reaction.16,333.3. Determination of antimicrobial activity
Comprehensive studies have been conducted to discover metal nanoparticles as useful as a potential antibacterial agent.34,35 Furthermore, the electrostatic attraction between negatively charged bacterial cells and positively charged nanoparticles is crucial for the activity of nanoparticles as bactericidal materials. This interaction not only inhibits bacterial growth but also induces reactive oxygen species (ROS) which lead to cell death.36–39In this study, GTe extract was more effective according to GTw extract. When Nfs was compared with extracts, Nfs were found effective at 10 fold less concentration. It is interesting that GTe-Nf was very potent on C. albicans at 20 μg mL−1 bactericidal concentration. While cf was not effective against microorganisms, ct and ct-Nf was effective against C. albicans (Fig. 7A and B).
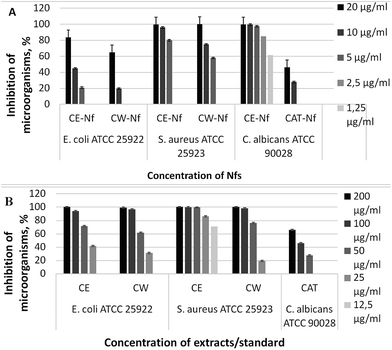 | ||
| Fig. 7 MBC, MFC, MIC values of GT extracts, catechin, (A) and their Nfs (B) by broth microdilution method (cf and cf-Nfs were not affected on all tested microorganisms). | ||
Additionally, our first assumption is that the negatively and positively charged groups abundantly found in the plant extracts may enhance reaction between the Nfs and microorganisms to inactivate them. The second assumption is the action of the Nfs as Fenton like agent for production of Cu+ ions and various radicals, which cause membrane damage and death of target microorganisms through oxidative stress.
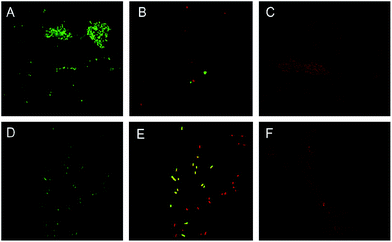
The mode of action of catechin was explained by Saito et al. (2013)40 as C. albicans dimorphism by suppressing Cek1 phosphorylation and cAMP synthesis. Also Fazal and Rauf (2015) found that C. sinensis has exhibited antifungal activity against C. albicans. GTe extract was more sensitive against Gram positive bacteria (S. aureus) than Gram negative (E. coli).41 The earlier workers have been reported that Gram positive pathogenic bacteria are more susceptible to tea catechins as compared to the Gram negative bacteria probably due to differences in cell wall composition of this groups.42–44 According to LIVE/DEAD BacLight staining results, the total counts of E. coli and S. aureus bacterial cells were completely inhibited with GTe-Nf and GTw-Nf (Fig. 8).
3.4. Evaluation of total phenolic contents
The total phenol contents of the GT extracts and their Nfs are shown in the Table 1. The total amount of phenol in the Nfs decreased compared to free extracts. This decrease showed that formed of nano hybrid structures which supported the binding of Cu2+ to functional groups.| Extracts | Total phenol [mg GAE per g extract] |
|---|---|
| a GTw, green tea water extract; GTe, green tea ethanol extract; GTw-Nf, green tea water extract nanoflower; GTe-Nf, green tea ethanol extract nanoflower. | |
| GTw | 334.19 ± 6.00 |
| GTe | 405.86 ± 2.33 |
| GTw-Nf | 23.62 ± 1.11 |
| GTe-Nf | 11.32 ± 3.87 |
4. Conclusions
In conclusion, we successfully produced C. sinensis extracts incorporated Cu2+ ions nanoflowers (Nfs) and demonstrated their high antimicrobial and catalytic activities. We studied the formation of Nfs as function of the extracts and Cu2+ concentrations. The GT polyphenols vehiculated in cosmetic formulations show good skin penetration and retention. The improvement in especially hair and skin preparations and enhancement in the performance of cosmetic products suggest that GT-Nfs are promising botanical ingredients in cosmetic formulations and also are produced a cheaper, eco-friendly and more effective way.Conflicts of interest
There are no conflicts to declare.Acknowledgements
The authors would like to thank TUBITAK [2209-A] for providing financial support. This work was supported by the Scientific Research Projects Coordination Unit of Erciyes University [Project number: TSA-2017-7157]. This study was partially presented as an poster presentation at the IVEK 3rd International Convention of Pharmaceuticals and Pharmacies Congress in 29-29 April 2017, Istanbul, Turkey.References
- A. Perva-Uzunalić, M. Škerget, Ž. Knez, B. Weinreich, F. Otto and S. Grüner, Food Chem., 2006, 96, 597 CrossRef.
- E. W. Chan, E. Y. Soh, P. P. Tie and Y. P. Law, Pharmacogn. Res., 2011, 3, 266 CrossRef CAS PubMed.
- S. Pinnell, J. Am. Acad. Dermatol., 2003, 48, 1 CrossRef PubMed.
- X. Gao, L. Zhang, H. Wei and H. Chen, Clin. Dermatol., 2008, 26, 367 CrossRef PubMed.
- D. S. Kim, S. H. Park, S. B. Kwon, K. Li, S. W. Youn and K. C. Park, Arch. Pharmacal Res., 2004, 27, 334 CrossRef CAS.
- J. M. Song, K. H. Lee and B.-L. Seong, Antiviral Res., 2005, 68, 66 CrossRef CAS PubMed.
- N. Sueoka, M. Suganuma, E. Sueoka, S. Okabe, S. Matsuyama, K. Imai, K. Nakachi and H. Fujiki, MPB Research, 2001, 928, 274 CAS.
- K. Sandeep and S. Nisha, Int. J. Adv. Res. Biol. Sci., 2012, 1, 348 Search PubMed.
- M. D. Gianeti, D. G. Mercurio and P. M. Maia Campos, Dermatol. Ther., 2013, 26, 267 CrossRef PubMed.
- S. Ahmed, M. Ahmad, B. L. Swami and S. Ikram, J. Adv. Res., 2016, 7, 17 CrossRef CAS PubMed.
- D. MubarakAli, N. Thajuddin, K. Jeganathan and M. Gunasekaran, Colloids Surf., B, 2011, 85, 360 CrossRef CAS PubMed.
- F. Duman, I. Ocsoy and F. O. Kup, Mater. Sci. Eng., C, 2016, 60, 333 CrossRef CAS PubMed.
- A. Demirbas, B. A. Welt and I. Ocsoy, Mater. Lett., 2016, 179, 20 CrossRef CAS.
- I. Ocsoy, A. Demirbas, E. S. McLamore, B. Altinsoy, N. Ildiz and A. Baldemir, J. Mol. Liq., 2017, 238, 263–269 CrossRef CAS.
- I. Ocsoy, M. Temiz, C. Celik, B. Altinsoy, V. Yilmaz and F. Duman, J. Mol. Liq., 2017, 227, 147–152 CrossRef CAS.
- G. Şeker Karatoprak, G. Aydin, B. Altinsoy, C. Altinkaynak, M. Koşer and I. Ocsoy, Enzyme Microb. Technol., 2017, 97, 21–26 CrossRef PubMed.
- K. Zheng, M. I. Setyawati, D. T. Leong and J. Xie, ACS Nano, 2017, 11, 6904–6910 CrossRef CAS PubMed.
- K. Zheng, M. I. Setyawati, T.-P. Lim, D. T. Leong and J. Xie, ACS Nano, 2016, 10, 7934 CrossRef CAS PubMed.
- J. Ge, J. Lei and R. N. Zare, Nat. Nanotechnol., 2012, 7, 428 CrossRef CAS PubMed.
- Z. F. Wu, Z. Wang, Y. Zhang, Y. L. Ma, C. Y. He, H. Li, L. Chen, Q. S. Huo, L. Wang and Z. Q. Li, Sci. Rep., 2016, 1, 1–7 Search PubMed.
- N. Ildiz, A. Baldemir, C. Altinkaynak, N. Özdemir, V. Yilmaz and I. Ocsoy, Enzyme Microb. Technol., 2017, 102, 60 CrossRef CAS PubMed.
- C. Altinkaynak, I. Yilmaz, Z. Koksal, H. Özdemir, I. Ocsoy and N. Özdemir, Int. J. Biol. Macromol., 2016, 84, 402 CrossRef CAS PubMed.
- B. Somturk, I. Yilmaz, C. Altinkaynak, A. Karatepe, N. Ozdemir and I. Ocsoy, Enzyme Microb. Technol., 2016, 86, 134 CrossRef CAS PubMed.
- B. Somturk, M. Hancer, I. Ocsoy and N. Özdemir, Dalton Trans., 2015, 44, 13845–13852 RSC.
- E. Yilmaz, I. Ocsoy, N. Ozdemir and M. Soylak, Anal. Chim. Acta, 2016, 906, 110–117 CrossRef CAS PubMed.
- I. Ocsoy, E. Dogru and S. Usta, Enzyme Microb. Technol., 2015, 75–76, 25–29 CrossRef CAS PubMed.
- C. Altinkaynak, S. Tavlasoglu, N. Özdemir and I. Ocsoy, Enzyme Microb. Technol., 2016, 93–94, 105–112 CrossRef CAS PubMed.
- C. Altinkaynak, S. Tavlasoglu, R. Kalin, N. Sadeghian, H. Ozdemir, I. Ocsoy and N. Ozdemir, Chemosphere, 2017, 182, 122–128 CrossRef CAS PubMed.
- Clinical Laboratory Standard Institute (CLSI). Reference method for broth dilution antifungal susceptibility testing of yeasts; Approved Standards-Second Edition, in CLSI document M27-2A 2002, CLSI Pennsylvania, USA.
- Clinical Laboratory Standard Institute (CLSI). Reference method for broth dilution antifungal susceptibility testing of yeasts; Approved Standards-Second Edition, in CLSI document M07-A10, 2012 CLSI Pennsylvania, USA.
- Y. Guo, L. Wang, J. Lei, J. Xu and L. Han, Jundishapur J. Microbiol., 2017, 10, 3 Search PubMed.
- V. L. Singleton, R. Orthofer and R. M. Lamuela-Raventós, in Methods in Enzymology, ed. L. Packer, Academic Press, San Diego, CA, 1999, vol. 299, p. 152 Search PubMed.
- Z. F. Wu, Z. Wang, Y. Zhang, Y. L. Ma, C. Y. He, H. Li, L. Chen, Q. S. Huo, L. Wang and Z. Q. Li, Sci. Rep., 2016, 1, 7 Search PubMed.
- H. Zeng, G. Duan, Y. Li, S. Yang, X. Xu and W. Cai, Bull. Chem. React. Eng. Catal., 2010, 20, 561 CAS.
- R. Prasad and G. Rattan, Bull. Chem. React. Eng. Catal., 2010, 5, 7 CAS.
- P. K. Stoimenov, R. L. Klinger, G. L. Marchin and K. J. Klabunde, Langmuir, 2002, 18, 6679 CrossRef CAS.
- N. Jones, B. Ray, T. R. Koodali and A. C. Manna, FEMS Microbiol. Lett., 2008, 279, 71 CrossRef CAS PubMed.
- N. Padmavathy and R. R. Vijayaraghavan, Int. J. Inorg. Mater., 2001, 3, 643 CrossRef.
- H. Yang, C. Liu, D. Yang, H. Zhang and Z. Xi, J. Appl. Toxicol., 2009, 29, 69 CrossRef CAS PubMed.
- H. Saito, M. Tamura, K. Imai, T. Ishigami and K. Ochiai, Microb. Pathog., 2013, 56, 16 CrossRef CAS PubMed.
- H. Fazal and A. Rauf, Pak. J. Pharm. Sci., 2015, 28, 2091 Search PubMed.
- M. Friedman, P. R. Henika, C. E. Levin, R. E. Mandrell and N. Kozukue, J. Food Prot., 2006, 69, 354 CrossRef CAS PubMed.
- M. Toda, S. Okubo, R. Hiyoshi and T. Shimamura, Lett. Appl. Microbiol., 1989, 8, 123 CrossRef.
- M. Toda, S. Okubo, H. Ikigai and T. Shimamura, Jpn. J. Bacteriol., 1990, 45, 561 CrossRef CAS.
| This journal is © The Royal Society of Chemistry 2017 |

