DOI:
10.1039/C7RA06925A
(Review Article)
RSC Adv., 2017,
7, 44199-44224
Multiphase TiO2 nanostructures: a review of efficient synthesis, growth mechanism, probing capabilities, and applications in bio-safety and health
Received
21st June 2017
, Accepted 27th August 2017
First published on 12th September 2017
Abstract
This review article provides an exhaustive overview of the efficient synthesis, growth mechanism and research activities that mainly concern an assortment of multiphase TiO2 nanostructures and their structural, morphological, optical and biological properties co-relations. First, a systematic review is provided for the state-of-art and synthetic mechanisms utilized to generate these nanostructured systems. A range of remarkable photoactive characteristics with respect to the effects of the structural phases as well as morphogenesis are then briefly covered and organized into sections presenting the nanostructures' photo-luminescence and photo-catalysis properties. A plausible mechanism for their nano–bio interaction is also reviewed, and clearly shows their potential in bio-safety and health applications. These studies should inspire researchers involved in both fundamental and application based research to pursue further developments in multiphase TiO2 nanostructures.
 Avanish K. Srivastava | Dr Avanish Kumar Srivastava is a Scientist at CSIR – National Physical Laboratory, New Delhi and an adjunct faculty member of the Academy of Scientific and Innovative Research (AcSIR) at the NPL campus. He received his Master's degree in Physics from the Indian Institute of Technology Roorkee (1986), M.Tech. in Materials Science from the Indian Institute of Technology Kanpur (1988), and Ph.D. in Metallurgy from the Indian Institute of Science, Bangalore (1996). He works in the field of the processing, characterization, properties and possible applications of metals and alloys, composites, semiconductors and various nanostructures. His prolific research to understand the nucleation-growth mechanisms, phase transformations, microstructures and defects of materials is well known. Dr Srivastava has solved complex crystalline structures with the help of reciprocal space analysis employing electron microscopy. He has carried out collaborations with many institutions, including the Indian Institute of Science Bangalore, Banaras Hindu University Varanasi, Indian Institute of Technologies Delhi, Kanpur & Hyderabad, University of Paris & University of Reims France, Technical University Darmstadt Germany; Okayama University of Science Japan, University of Arkansas USA, Pohang University of Science and Technology South Korea, Department of Energy, Center for NanoEngineered Materials and Surfaces Milano Italy and Institute for Technical Physics and Materials Science, Hungarian Academy of Sciences Hungary and Argonne National Laboratory USA. He has more than 200 publications in reputed international journals and more than 200 papers and invited talks at different scientific meetings in India and abroad. He has edited a book on Oxide Nanostructures: Growth, Microstructure and Properties, published by PanStanford Singapore and printed by Taylor and Francis, USA. He is the recipient of many awards and positions, including: (i) DST-BOYSCAST fellowship of Government of India, (ii) Kwan Im Thong Travel Fellowship Singapore, (iii) INSA-KOSEF fellowship of the Governments of India & South Korea, (iv) Materials Research Society of India (MRSI) Medal-2011 and (v) Metallurgist of the Year Award – 2011 by the Ministry of Steel, Government of India. He is an elected Fellow of The Indian Institute of Metals and Electron Microscope Society of India. |
1. Introduction
Photoactive potential is defined as the capacity of a material to undergo any chemical or physical alteration when a number of photons fall on it. It is well known that when the size of materials or grains approaches the nanometre (nm) scale, many physical, chemical and biological characteristics are strongly influenced and differ significantly from those of bulk materials and from those of an isolated atom/ion/molecule.1–7 The possible fundamental causes for this are the following: (i) interatomic interactions, (ii) cations with valence states, (iii) anions with deficiencies, (iv) anisotropy and (v) high surface area-to-volume ratio.8 Semiconductor metal oxide nanomaterials (SMONs) are amongst the most widely studied oxide materials in recent years as they have the capability to generate photo-excited electrons and holes when photons of a wavelength equal to or greater than the band gap of the SMON fall on it.9 The noteworthy and significant physico-chemical characteristics of SMON can be attributed to their reduction in crystal size as well as their surface structure that would substantially increase the catalysis performance and the ability to tune the band gap by possible modifications of SMON, which is one of the most exciting research areas. In addition, the band gap of SMON can be easily tuned as per the requirement for inhibiting charge-carrier recombination, which is important for photoactive applications. In addition, nanometre-sized SMONs have attracted much interest as a component of electronic devices depending on their structural phases. The intriguing characteristics of several SMONs, together with their electronic and structural phases, that possess photoactive potential are listed in Table 1.
Table 1 Summary of different binary and ternary SMONs based on photoactive potential with their band gap, structural phase and melting pointa
| Metal oxides |
Band gap (eV) |
Structural phases |
Melting point (°C) |
Ref. |
| Symbols introduced: α → alpha, β → beta, γ → gamma, R → rutile, A → anatase and B → brookite. |
| Binary oxides |
| CuO: cupric oxide |
1.2 |
Monoclinic |
1326 |
10 and 157 |
| Fe2O3: iron(III) oxide |
1.7–2.7 |
Rhombohedral (α), cubic (γ) |
1566 |
11 and 12 |
| NiO: nickel oxide |
3.6–4.2 |
Cubic (rock salt) |
1955 |
13 |
| Sb2O3: antimony trioxide |
2.8–3.1 |
Cubic |
656 |
14 |
| Sb2O4: antimony tetroxide |
3.26 |
Orthorhombic (α), monoclinic (β) |
>930 |
15 |
| SnO2: tin dioxide |
3.5–3.9 |
Tetragonal (R) |
1630 |
11 |
| TiO2: titanium dioxide |
2.8–3.3 |
Tetragonal (R, A); orthorhombic (B) |
1843 |
16 |
| VO2: vanadium oxide |
0.5–0.7 |
Monoclinic, tetragonal |
1967 |
8 |
| WO3: tungsten trioxide |
2.5–3.7 |
Triclinic, tetragonal, monoclinic, orthorhombic |
1473 |
17 and 18 |
| ZnO: zinc oxide |
3.3–3.5 |
Hexagonal (wurtzite), cubic (zinc blend) |
1975 |
19–21 |
![[thin space (1/6-em)]](https://www.rsc.org/images/entities/char_2009.gif) |
| Ternary oxides |
| BiVO4: bismuth vanadate |
2.2–2.8 |
Tetragonal, monoclinic |
2700 |
22 |
| SrTiO3: strontium titanate |
3.2–3.4 |
Cubic |
2080 |
23 and 24 |
| ZnAl2O4: zinc aluminate |
4.1 |
Cubic |
NA |
25 |
| ZnFe2O4: zinc iron oxide |
1.9 |
Cubic |
NA |
25 and 26 |
| Zn2SnO4: zinc stannate |
3.6 |
Cubic |
570 |
25 |
| Zn2SiO4: zinc silicate |
5.5 |
Hexagonal |
1509 |
27–29 |
Amongst the various SMONs,10–29 TiO2-nanostructured systems (particularly nano-particles,23,30 -wires,31 -needles,32 -belts33 and -tubes34,35) are the most enthralling classes of SMON with a variety of physico-chemical properties. The dominant physicochemical properties of TiO2 nanostructures are classified in terms of their crystallinity, purity, structure, chemical composition, size- and/or shape-distribution, dimensionality and defect centres, which can be easily modified by changing the parameters during various synthetic methods. TiO2 nanostructures have been widely explored owing to their extensive applications across a myriad of areas, particularly in photocatalysis, including those for the decomposition of organic/inorganic dyes,16,23,36–40 hydrogen production from water,41–44 removal of pollutants and plastics from the environment,45–48 dye-sensitized solar cells,49 sensors,50 sunscreens,51–54 paints,55,56 rechargeable batteries,57–59 supercapacitors,60 food colouring,61–64 environmental remediation65–94 and biomedical fields.95,96 Over the past few decades, extensive research effort has been dedicated to the engineering of TiO2 nanostructures synthesized via chemical routes, such as sol–gel,97–107 hydrothermal,108–126 solvothermal,8 wet-chemical,6,8,23,127 thermolysis128,129 and electrodeposition techniques.130 TiO2 is effectively used in the aforementioned applications based on its various structural phases, morphologies, exceptional low-cost, non-toxicity, high abundance in nature and slow rate of charge-carrier recombination,131–139 and therefore is the main concern of this review article. Moreover, the excellent photoactive performances of multiphase TiO2 nanostructures mainly depend on the various synthesis routes. Due to the outburst of publications in this field, the authors do not claim that this dominantly multiphase TiO2 nanostructures review includes all of the published work, but rather an exposure of the efficient syntheses, probing capabilities, photoactive potential and application of these TiO2 nanostructures in biosafety and health. We apologize to the authors of the excellent work that, due to the large activity in this area, we have inadvertently left out.
Thus, in order to modify the structural, morphological, optical, antimicrobial, physico-chemical and photocatalytic properties of various multiphase-TiO2 nanostructures, by necessity, it is essential to develop and emphasize the design of cost-efficient, high yield and long charge-carrier lifetime materials with desirable controlled morphology as well as specific multifunctional properties based on basic chemistry and physics concepts/models.
2. Properties of multiphase TiO2 nanostructures
Titanium dioxide is an alkaline oxide of titanium (Ti) containing the elements Ti and oxygen (O) with the chemical formula TiO2 and is commonly referred to as titania. Moreover, TiO2 is one of the most abundant and nontoxic compounds on our planet and is a very appealing material for a variety of applications in catalysis, UV sunscreens, cosmetics, medical implants and self-cleaning and antifogging surfaces.97 TiO2 nanostructures are conventional wide band gap (Eg = 2.8–3.3 eV) semiconductor materials with tunable properties, which have attracted growing interest in recent decades from the scientific and engineering community.
2.1. Structural phases (multiphase TiO2)
Structurally, TiO2 nanomaterials are a kind of versatile polymorph material (a material with the same composition but a different crystal structure) and exist in both crystalline and noncrystalline or amorphous (a-TiO2) forms.141–143 Up to now, 14 structural phases of TiO2 have been identified in which 11 phases are crystalline and 3 are noncrystalline. The crystalline phases of TiO2 are rutile, anatase, brookite, TiO2-B (bronze), TiO2-R (ramsdellite), TiO2-H (hollandite), TiO2-II (columbite), TiO2-III (baddeleyite), TiO2-OI (fluorite), TiO2-OII (cotunnite) and TiO2-cubic,144 whereas the noncrystalline-TiO2 phases are a low-density a-TiO2 and two high-density a-TiO2 forms.142 Mesoporous a-TiO2 with a periodic ordering of the pores was first reported in 1995 via a modified sol–gel process applying an alkyl phosphate surfactant.144
To date, the structural characteristics, particularly the nature of phase formation as well as transformations in TiO2, have been inadequately established. The three main naturally existing polymorphs of TiO2 (especially rutile, anatase and brookite) are stable at ambient or low-pressure but differ in how they share the adjacent TiO6 octahedra coordination such that the overall stoichiometry remains TiO2. The relative stability of the TiO2 phases depends mainly on the particle size, with rutile-TiO2 being the thermodynamically most stable form in bulk TiO2. The anatase-TiO2 phase is the most stable phase of TiO2 at sizes below 14 nm. Moreover, brookite-TiO2 is the metastable form, which is not commonly observed in minerals and is difficult to synthesize in a pure form.140,145 Their densities vary in range from ∼4.24 (TiO2-rutile)146 to 3.89 (TiO2-anatase)146,147 and 4.12 (TiO2-brookite)148 g cm−3. Anatase- and brookite-TiO2 are regarded amongst the most widely studied phases with the thermodynamically stable rutile-TiO2 phase.149,150 However, based on the different arrangements of oxide anions (O2−) adjoining the titanium cations (Ti4+), these transition/multiphase TiO2 polymorphs can be divided into two main categories: (i) a tetragonal structure (in rutile- and anatase-TiO2), (ii) an orthorhombic structure (in brookite-TiO2).151 On the basis of the available literature reviews and the experimental Ti–O phase diagram, anatase-TiO2 is more stable than rutile152 at room temperature and atmospheric pressure, in contrast to the thermodynamic data, which indicates anatase-TiO2 is metastable with regard to rutile-TiO2.145 The rutile phase of TiO2 consists of TiO6 units with both edge as well as corner sharing, whereas the anatase phase of TiO2 contains TiO6 units only with edge sharing. Additionally, in the brookite phase of TiO2, the TiO6 units are connected through the edges of neighbouring units.153–156
In the rutile phase structure, two opposite edges of each octahedra are united forming a linear chain along the (001) direction. These linear chains are then linked to each other by sharing corner oxygen atoms. However, zigzag chains of octahedra are linked through sharing edges, as no corner sharing is observed in the crystal structure of anatase. Four edges are shared per octahedron in anatase. Interstitial spaces between octahedra are larger because of there being more edge sharing and thus this phase structure is less dense than rutile.145 The orthorhombic crystal structure of brookite is even more complex, wherein, it comprises an orthorhombic unit constructed by an octahedron of oxygen ions arranged about a single titanium ion. Three edges with adjoining octahedra are shared per octahedron. Moreover, the remarkable properties and excellent performance in various potential applications for the different polymorphs of multiphase TiO2 are outlined in Table 2. Fig. 1(a–d3) illustrate the various applications: (a), ball- and-stick models (b1–b3), Wulff structures (c1–c3) and polyhedron models (d1–d3) of different polymorph TiO2, in particular anatase-, brookite- and rutile-TiO2.142
Table 2 Polymorphs-TiO2 structure with their possible properties and applications
| Phase-TiO2 |
Properties |
Advanced applications |
| Anatase-TiO2 |
Brown to black, metastable polymorph, lustrous, lower absorption rate, hard, high density, larger band gap |
Gems, paints, papers, ceramics, photocatalysis |
| Brookite-TiO2 |
Dark brown to greenish black, brittle, very rare metastable polymorph, non-fluorescent |
Photocatalysis, photovoltaic devices, jewellery |
| Rutile-TiO2 |
Dark red, high refractive index, hard, chemical resistant, UV-ray absorbent, obtained at high temperature |
Paint, paper, plastic, food, sunscreens, photocatalysis, interference applications |
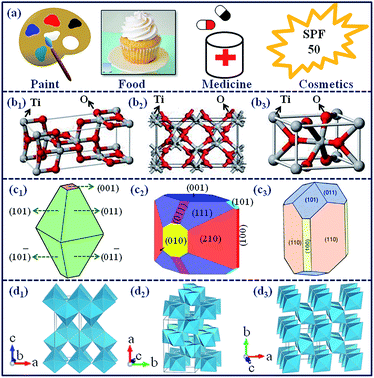 |
| | Fig. 1 (a) Various applications, (b1–b3) ball-and-stick models, (c1–c3) Wulff structures and (d1–d3) polyhedron models of different polymorphs TiO2 for (b1, c1, d1) anatase-TiO2, (b2, c2, d2) brookite-TiO2 and (b3, c3, d3) rutile-TiO2. The unit cells in polyhedron models are outlined using thin lines.142 By courtesy of https://www.google.co.in/search?q=wulff+structure+of+tio2%26tbm=isch%26tbo=u%26source=univ%26sa=X%26ved=0ahUKEwiYgZiDnYXUAhUFT48KHWRAfQQsAQIJg%26biw=1280%26bih=591#imgrc=X5z468XQyZyqOM: Reprinted with permission from ref. 142. Copyright 2014, American Chemical Society. | |
2.2. Morphogenesis characteristics (TiO2 nanostructures)
Accumulating all the available reviews from the early 2000s, a variety of nanostructured materials with fascinating morphologies have piqued the interests of material scientists because of their higher surface-to-volume ratio, which is beneficial to enhancing the efficiency of oxide surface reactions. Based on the orientation of nanocrystals, nanostructured materials or nanomaterials are divided into three main categories within a size range of 1–100 nm: (i) spherical (nano-particles,23 -spheres,158 -granules,159 -platelets,160 -pores161), (ii) elongated (nano-rods,162 -tubes,34,35 -wires,31 -fibres,98,163 -needles,164 -petals,165 -whiskers,166,167 -trees,55 -filaments168,169) and (iii) planar (nano-plates,170,171 -sheets,172 -films,173 -coatings174,175).
Spherical nanomaterials show a diverse range of applications, such as in electronics,176 photodynamic therapy,177,178 sensors,50 probes,179 catalysis23,180 and antimicrobial.51,181,182 Elongated nanomaterials, on the other hand, also demonstrate various potential applications, such as in display technologies,183,184 microelectromechanical systems (MEMS),185 optical sensors175 and biological areas, such as cancer therapeutics,186,187 sensing,188,189 imaging186,187 and drug delivery. Planar nanomaterials are utilized for packaging purposes, as anti-corrosives,190,191 -bacterial,192,193 -abrasion,191 -reflection,194,195 -graffiti coatings191 and in surgical procedures.196 such as wound dressing materials and in tissue engineering,197,198 such as cellular scaffolds.199 Amongst various morphogenesis, nano-particles,23,30 -fibres,98,163 -tubes,34,35 -rods162 and layers of multiphase-TiO2 are the most desired nanostructures for many industrial, scientific and technological applications (Fig. 2).
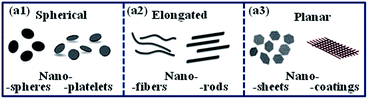 |
| | Fig. 2 Illustration showing the orientation of nanomaterials: (a1) spherical, (a2) elongated and (a3) planar.130 Reprinted with permission from ref. 130. Copyright 2015, The Royal Society of Chemistry. | |
2.3. Impact of multiphase TiO2 nanostructures on photoactive and biological responses
The photoactive potential states the capability of a substance to undergo any physical or chemical changes in response to illumination. Herein, the photoactive potential of multiphase TiO2 nanostructures stands for: (i) UV-Vis characteristics, (ii) photoluminescence and (iii) photocatalysis properties.
2.3.1. Influence on photoactive potential. Generally, ultraviolet-visible (UV-Vis or UV/Vis) spectroscopy is aimed at absorption or reflectance ranging from 190 nm (6.52 eV) to 800 nm (1.55 eV). When an atom or molecule absorbs UV or visible light, electrons are promoted from their ground state (bonding: σ-, and π- or non-bonding: n-electrons) to an excited state (anti-bonding: σ*- or π*-electrons).23,200 Atomic vibrations/rotations also have discrete energy levels, which are considered as being packed on top of each electronic level and appear in the form of a continuous absorption band.130 In the luminescence process, an energy source stimulates an electron within a material to rise from a ground state to an excited state, and the electron is then released to the ground energy state by liberating the energy in the form of light. In the photoluminescence process, photons are the primary energy source and can be used to analyse the PL spectra of nanomaterials. The separation of photogenerated electron–hole pairs (excitons) when UV rays are illuminated provides a platform for photodegradation by generating reactive oxygen species (ROS).201–205 A mechanism related to this photodegradation is depicted in Fig. 3.
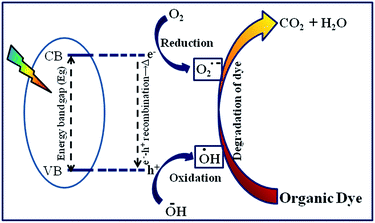 |
| | Fig. 3 Photocatalysis mechanism in multiphase TiO2 nanostructures. | |
Multiphase TiO2 nanostructures have been widely explored in terms of photocatalysis owing to their high surface area, high absorption capability and slow rate of charge-carrier recombination.23,180 The photocatalysis property is useful in many applications that provide a therapeutic action for human health by decontaminating water/air206,207 and also by degrading toxic organic/inorganic dyes.23,208 Thus, the ability to manipulate the surface property is an extremely vital factor to optimize multiphase TiO2 nanostructures for photo-related phenomena. However, the existing recent reviews scrutinized that the surface modification of multiphase TiO2 nanostructures can be achieved either by organic/inorganic surface coating or by adding dopants. However, surface coating on TiO2 nanostructures with numerous inorganic oxide materials, such as SiO2,209 Al2O3,210 ZrO2,211 WO3 (ref. 212) and MoO3 (ref. 213) can lose their intrinsic property, thus, organic surface coatings are preferred to circumvent this property. In addition, coating with an organic moiety can provide various functional groups, such as hydroxyl-, aldehydic- and carboxyl-groups, as well as the benefit from organic species being cheaper as well as generally more abundant in nature.214,215
2.3.2. Influence on bio-safety and human health. When nanostructures enter into the human body, they are distributed into various organs and thus interact with biological moieties, such as proteins and cells. They can either remain in the same structure or become altered.216 Nanomaterials may also get absorbed via inhalation,217 dermal exposure218,219 and could potentially cause some toxic characteristics220–225 in the human body. Thus, the pharmacokinetics of nanomaterials depends on various physico-chemical properties of both nanomaterials as well as biological systems, which are elaborated in detail herein.
2.3.2.1. Physico-chemical influences of the nanostructures. The driving forces for nano–bio interactions mainly include the physico-chemical properties of: (i) nanomaterials, such as the structural aspects (size and shape), surface properties (crystallinity, hydrophobicity, coating, stereochemical interactions) and chemical composition (atomic/molecular features, polymorphism); (ii) biological systems, such as the surface charge, conformation, H- and π-bonds and (iii) environmental prospects, such as the polarity, pH, viscosity, temperature and ionic strength, as shown in Scheme 1(a–c).226–228 The available exciting and existing reviews clearly demonstrate the interaction of multiphase TiO2 nanostructures with biological systems through various plausible mechanisms. It is an imperative task, therefore, to present a review to assist composing a novel mechanism emphasizing the effect of multiphase TiO2 nanostructures on human health using fundamental evidence.
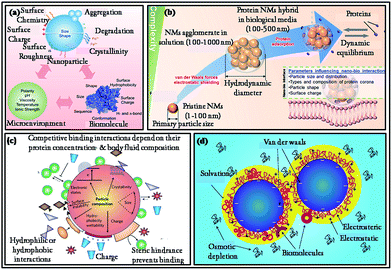 |
| | Scheme 1 Schematic representation of nano–bio interactions and: (a) factors influencing the nano–bio interactions,60 (b) physico-chemical properties of nanomaterials essential to establish nano–bio relations,239 (c) effects of the protein corona surrounding a nanoparticle; the corona constitutes a primary nano–bio interface that determines the fate of the nanoparticle and can cause deleterious effects on the interactive proteins,226 (d) interactions between nanoparticles. Traditional forces for colloidal fabrication (for example, electrostatic, VDW, covalent) and other important interactions (for example, solvation, solvophobic, biomolecular, depletion) that occur when particles are suspended in biological media and come into contact with cells.226 (a) is reprinted with permission from ref. 60. Copyright 2014, American Chemical Society. (b) is reprinted with permission from ref. 239. Copyright 2014, Wiley Online Library. (c and d) is reprinted with permission from ref. 226. Copyright 2009, Nature Publishing Group. | |
3. Efficient synthesis routes and growth mechanisms
Synthetic methods of multiphase TiO2 play a crucial role in the development of nanostructures from zero-dimensional (0D) to three-dimensional (3D) structures. The synthesis of multiphase TiO2 nanostructures in a variety of shapes with controlled morphologies, sizes (∼100 nm) and more complex nanostructures are of substantial interest due to their exceptional properties and prevalent application possibilities straddling from physico-chemical to biological fields.240,241 With a high degree of synthetic control, the size and shape of multiphase TiO2 nanostructures can be easily tuned from the micro- and nanometre to the molecular level and from spherical nanoparticles to nano-rods/-tubes/-wires. Moreover, owing to its excellent stoichiometry (Ti/O: 1/2), multiphase TiO2 nanostructures have always been a subject of enormous research interest and there is emerging attention paid now to the controlled synthesis or fabrication of structurally stoichiometric TiO2 with diverse shapes, with results reported on single and mixed phase TiO2 polymorphs. The synthesis of multiphase TiO2 nanostructures, therefore, is very interesting in terms of: (i) the structural phases (anatase-, brookite- and rutile-TiO2), (ii) the well-controlled morphogenesis (nano-particles,23,158 -tubes,34,35 -wires,31 -rods,162 -crystals242,243 and -flowers144,244), and (iii) the particle size (regime 1–100 nm) for a variety of technological and biosafety applications.
With the emergence of new synthetic techniques that are inexpensive, highly scalable and have a high yield, development of the large-scale cost-effective production of SMON is one of the key challenges for today's nanoscience and nanotechnology.245 Each fabrication method of SMON has its own advantages and strategy for the synthesis of SMON in 0D to 3D systems. In this section, we briefly describe the numerous synthesis methods for producing SMON, especially multiphase TiO2 nanostructures. Generally, two fundamental strategies have been developed to broadly prepare multiphase TiO2 nanostructures: the top-down approach and the bottom-up approach.
3.1. Top-down approach
Basically, the top-down approach is a miniaturization technique, in which small structures are fabricated from larger ones. The key advantageous of this approach are that the components, e.g. in the production of integrated circuits, are both patterned and assembled in position, so that no separate fabrication step is needed. Lithography, attrition or milling, quenching, etching and successive cutting are all typical examples of the top-down approach for the synthesis of metal oxide nanomaterials.108,246
3.2. Bottom-up approach
In this context, synthesis through a bottom-up approach, in which molecular precursors react to form the final larger structures, is a unique approach for the preparation of SMONs owing to its exceptional versatility.157,247–249 In the bottom-up approach, the molecular precursors self-associate, interact and combine with each other in a coordinated way to give rise to simple and more complex nanostructures. The bottom-up approach has four major branches: (i) physical, (ii) chemical, (iii) hybrid and (iv) biological. Nowadays, these synthetic routes have been established for the engineering of emerging multiphase TiO2 nanostructures (spherical, elongated and planar with sizes smaller than 100 nm).103,109,250,251 The existing physical, hybrid and/or biological synthesis methods typically involve toxic organic/inorganic reagents and need sophisticated instrumentation with complicated reaction conditions to produce the required materials, which are low in quantity as well as quality, even with a low-yield of the required material.252,253 Thus, the technological challenge has moved to the facile synthesis of multiphase TiO2 nanostructures via chemical routes and that could maintain their activity, selectivity and suitability over long-term operation in various potential technological and biosafety applications. In addition, the chemical method is an easy way to produce multiphase-TiO2 nanostructures using hazardless precursors in a short reaction time and at low cost for high scale-up with high purity in high throughput and good yield in industrial production. Due to numerous advantages such as simplicity, inexpensive instrumental set-up, easy operation and good control over the experimental conditions, the chemical routes are encouraged from the view-point of practical application. The chemical synthesis processes to obtain multiphase crystalline TiO2 nanostructures, including amongst others sol–gel or even hydrothermal approaches, wet chemical solution and precipitation methods, have become increasingly popular in recent years to achieve the goals of identically shaped, uniformly sized, perfect crystals, defect-free and high-purity materials. The entire synthetic mechanism, which provides exquisite control over many of the parameters cited above for the synthesis of nanostructures, is demonstrated in Scheme 2.
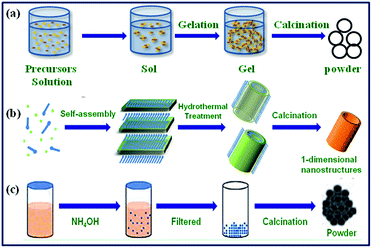 |
| | Scheme 2 Schematic representation of the chemical synthesis routes of SMON via (a) sol–gel, (b) hydrothermal, and (c) co-precipitation methods8 Reprinted with permission from ref. 8. Copyright 2016, DRDO. | |
Using these approaches, various morphologies of multiphase TiO2 have been synthesized and can be easily scaled up for large-scale production. The synthesis methods via a top-down approach normally require harmful organic/inorganic surfactants complex technologies as well as sophisticated instruments. Consequently, the bottom-up approach is preferred and has attracted key interest due to its versatility and potential to produce SMONs for many applications. Moreover, the chemical synthesis of multiphase TiO2 nanostructures via the sol–gel, hydrothermal and co-precipitation methods provides numerous significant advantages, such as:
(i) precise control of the structural phases and stoichiometry,
(ii) control of the size, morphology and homogeneity,
(iii) reproducible process suitable for the large-scale, cost-effective and high-purity production of nanomaterials,
(iv) short reaction conditions and inexpensive procedures.
3.2.1. Sol–gel method. The sol–gel method is broadly used to synthesize oxide materials, especially SMONs. Processing by this method involves the transformation of a sol (a colloidal suspension of nanometre-sized solid particles in a liquid phase) into a gel (a 3D network of metal–oxygen bonds, containing a continuous solid skeleton attached to a continuous liquid phase), which is then usually thermally treated to obtain the desired SMON.98 Namely, when the liquid is removed from the sol, the sol turns into a gel. The first gel derived from a metal alkoxide was synthesized by Ebelmen as early as 1846.101 Amongst all the available processes, the sol–gel approach is mainly based on the controlled hydrolysis, the condensation of appropriate precursors and inorganic polymerization reactions.254 The sol–gel process includes four steps: (i) hydrolysis, (ii) polycondensation, (iii) drying and (iv) thermal decomposition. The precursors of metal alkoxides hydrolyze with H2O or alcohols according to the hydrolysis process, followed by either H2O or alcohol condensation. Additionally, H2O or alcohol, an acid or a base can also assist hydrolysis of the precursor. In the case of acids, a reaction takes place between the alkoxide and acid to form a solution. After the sol formation, the solution is condensed to a gel and the solvent (H2O or alcohol) must be removed. A higher annealing/calcination temperature is needed to decompose the organic/inorganic precursor.240 Furthermore, the sol–gel method usually results in SMONs that are amorphous or badly crystalline because they are fabricated at or near room temperature. A thermal treatment (annealing or calcination) is normally needed to transform the gel into the final required SMON.97–107The sol–gel processing of multiphase TiO2 nanostructures is an interesting approach with a high level of control of the shape based on the controlled hydrolysis and condensation of the appropriate precursors. The sol–gel method is valuable for a high-throughput production of multiphase TiO2 nanostructures and much work has been carried out to date on this process, mainly involving the grain nanostructures. Varying the synthesis reaction conditions and parameters (particularly the solution composition, pH value and temperature) in sol–gel processing markedly affects the fabricated multiphase TiO2 nanostructures with varying sizes and different morphologies.255 A schematic diagram of the sol–gel processing for the synthesis of SMONs is shown in Scheme 2(a).
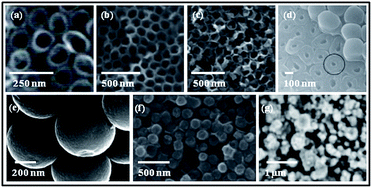
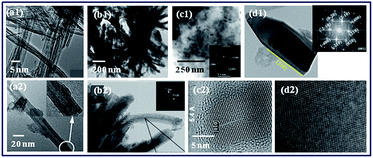
Multiphase TiO2 with different types of nanostructures, such as nano-particles, -whiskers, -fibrous and -spindles, have been successfully synthesized using this method (as shown in Fig. 4). The upper segment of Fig. 4 shows the sol–gel-derived spherical nanostructures of TiO2, whereas the lower segment presents the elongated nanostructures. Fig. 4a1 elucidates anatase-TiO2 with 20–60 nm crystallites agglomerated into 2 μm spherical spheres. Fig. 4a2 demonstrates the brookite-TiO2 nanoparticles are in a uniform spherical shape morphology with a diameter of about 400 nm.98 Fig. 4a3 shows the nano-scaled aggregates of a-TiO2 crystallites in particulate structure synthesized at ratios of EGMT:HCl = 1:5.4.144 Fig. 4a4 and b3 show the TEM images of highly crystalline anatase-TiO2 nanoparticles with different sizes and shapes prepared by the sol–gel method.256 Fig. 4a5 shows the cauliflower-like nanowhisker arrangements of rutile-TiO2 with a diameter of 4–5 nm and a length of 50 nm.144 Fig. 4b1 represents the higher magnification SEM image of the TiO2 nanofibrous structure.98 The fibre-like rutile-TiO2 nanostructures are illustrated in Fig. 4b2.163 Fig. 4b4 and b5 indicate the anatase-TiO2 particles with a spindle-like morphology depending on the pH value of the initial solution.97
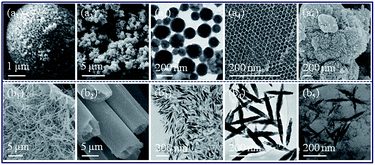 |
| | Fig. 4 Sol–gel synthesis of multiphase TiO2 nanostructures; (a1–a4) nanoparticles, (a5) nanowhiskers, (b1) nanofibrous, (b2) nanofibres, (b3) nanoparticles, (b4 and b5) nanospindle. Ref: [a1, b1],102 [a3, a5],144 [a4, b3],256 [b2],163 [b4 and b5].97 (a1, b1) are reprinted with permission from ref. 102. Copyright 2012, American Chemical Society. (a3, a5) are reprinted with permission from ref. 144. Copyright 2012, The Royal Society of Chemistry. (a4, b3) are reprinted with permission from ref. 256. (b2) is reprinted with permission from ref. 163. Copyright 2011, American Chemical Society. (b4, b5) are reprinted with permission from ref. 97. Copyright 2014, American Chemical Society. | |
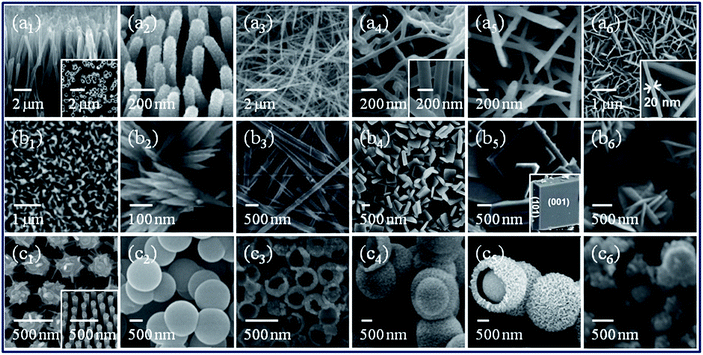
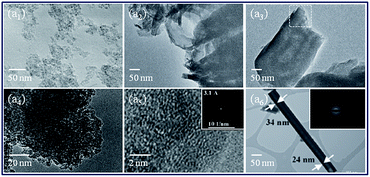
3.2.2. Hydrothermal method. The hydrothermal method is a simple, versatile and universal synthesis method that employs a solvent (generally water, H2O) at a moderate temperature and high pressure for producing SMONs. A schematic illustration for the formation of a SMON through the hydrothermal method is depicted in Scheme 2(b). The hydrothermal method is very comparable to the solvothermal method, with the main distinction between these two methods being in the precursor solutions. Specifically, aqueous and non-aqueous precursor solutions are used for the hydrothermal and solvothermal methods, respectively. Besides, the solvothermal method offers a better control of the size distribution, shape and crystallinity in SMONs than the hydrothermal method. The major chemical reactions occur at a critical temperature (374 °C) and pressure (218 atm) in a stainless steel Teflon autoclave. In the hydrothermal method, the dielectric constant and viscosity of H2O decrease with increasing the temperature and increase with the expanding pressure with the temperature effect predominating. Due to the changes in such characteristics of H2O, the raised temperature within a hydrothermal system has a considerable effect on the sample solubility and the transport of solids.108,109 In hydrothermal processing, mostly a lamellar phase is formed before the hydrothermal condition, in which the anions play the key role of surfactant to stabilize the layered organization of metal cation species. The layer, then, rolls up to generate one-dimensional (1D) nanostructures (particularly nano-tubes, -wires, -polyhedrons and -rods) in the process of crystallization under hydrothermal treatment. The crystalline/amorphous metal–hydroxide phase is, thus, obtained. After heat treatment annealing or calcination or sintering, the metal–hydroxide phase is, therefore, dehydrated and transformed to metal oxide nanostructures, while the 1D morphology is preserved and the organic/inorganic compounds or surfactants are removed. The hydrothermally synthesized 1D SMONs are expected to be identical in crystalline structure, uniform in size distribution, have a regular chemical composition, be perfect in shape and have no morphological defects or dislocations (particle–particle interface), which are exponentially useful for the applications of SMONs in photocatalysis, biosafety and human health.109 By using suitable parameters, such as precursors, solvent, surfactants, working temperature and reaction time, the structural phases, shape and size distribution of SMONs can be precisely controlled.Numerous morphologies of multiphase TiO2 nanostructures (nano-particles, -cuboid shape, -wires, -tubes, -belts and many others) have been effectively fabricated in this way (as represented in Fig. 5). A typical SEM micrograph of TiO2 nanowires made with the hydrothermal method is shown in Fig. 5a1.256 Fig. 5a2 and a5 correspond to the SEM and TEM images of TiO2 nanotubes, indicating a fibrous texture with lengths up to 1–3 μm, outer diameters between 7 nm and 10 nm, inner diameters of 5 nm and an inter-wall spacing of about 0.5 nm.257 Fig. 5a3 and a4 illustrates the representative SEM micrographs of anatase-TiO2 nano-polyhedrons (possessing diameters in the range of 300–600 nm) and nano–belts (approximately 130 nm in width, 50 nm in thickness and several micrometres in length), respectively.33 In addition to elongated TiO2 nanostructures, spherical TiO2 nanostructures (nanoparticles and cuboid shaped or thin sheets, as depicted in Fig. 5b1–b3) have also been synthesized with this method.172 Fig. 5b1 clearly shows uniform ultra-fine anatase-TiO2 nanoparticles (about 5–15 nm). Fig. 5b2 elucidates either a cuboid shaped or thin sheets of these anatase-TiO2 nanoparticles. One of these thin sheets with an edge length of 15 nm is marked in the micrograph (Fig. 5b2) and a set of Moiré fringes are also marked (encircled in Fig. 5b2). Fig. 5b4 and b5 represent the TEM images of TiO2 nano-tubes and -rods, respectively.108,110–126
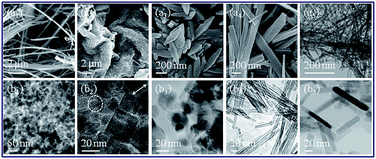 |
| | Fig. 5 Hydrothermal synthesis of multiphase TiO2 nanostructures: (a1) nanowires,256 (a2, a5) nanotubes,257 (a3) nano-polyhedrons,33 (a4) nanobelts,33 (b1) ultra-fine nanoparticles,172 (b2) nano-cuboid shaped or thin sheets,172 (b3) nanoparticles,256 (b4) nanotubes,256 (b5) nanorods.256 (a1, b3–b5) are reprinted with permission from ref. 256. (a2, a5) are reprinted with permission from ref. 257. Copyright 2012. Elsevier. (a3–a4) are reprinted with permission from ref. 33. Copyright 2012. Springer. (b1 and b2) are reprinted with permission from ref. 172. Copyright 2012. Elsevier. | |
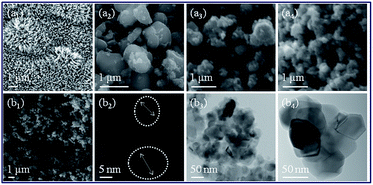
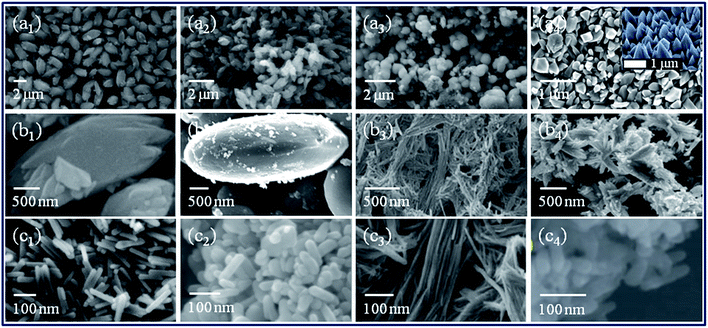
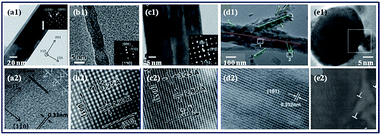
3.2.3. Co-precipitation method. As described above, many physical/chemical methods have been utilized for producing multiphase TiO2 nanostructures. Amongst all the synthetic approaches, the co-precipitation chemical strategy is based on the condition of supersaturation from aqueous solutions followed by thermal decomposition. Co-precipitation is also known as the wet chemical solution method and also a common method to synthesize SMONs with largely scalable production.8,240 In the co-precipitation method, the micro- or nano-structures of multiphase TiO2 are greatly affected by the reaction conditions, but also by the reactivity of the starting/intermediate materials, pH value of the reaction medium and the reaction parameters, such as temperature and time. The variations mentioned above present numerous parameters to construct different high-quality nanoparticles and other nanostructures. A schematic illustration for the formation of oxide nanostructures through the co-precipitation method is depicted in Scheme 2(c).Various shapes of multiphase TiO2 nanostructures have been synthesized, including nanorods and nanoparticles. Fig. 6a1–b4 elucidate the multiphase TiO2 nanostructures prepared via this method. Fig. 6a1 represents the SEM morphology of anatase-TiO2 nanorods,256 while Fig. 6a2 illustrates the rutile-TiO2 nanoparticles with a diameter of about 400 nm synthesized by the co-precipitation method.258 Fig. 6a3 and a4 present the SEM images of anatase-TiO2 and rutile-TiO2 nanoparticles,23 while Fig. 6b3 and b4 indicate the corresponding TEM images.23,259 The morphology of anatase-TiO2 nanoparticles monitored by SEM is depicted in Fig. 6b1.327 The TEM micrograph of TiO2 nanoparticles synthesized by this method is shown in Fig. 6b2, clearly indicating the uniform nanoparticles (size about 5–10 nm) distributed throughout the sample. Even though the method of preparing TiO2 nanoparticles via co-precipitation is very easy and simple, enormously complicated nanostructures can also be successfully fabricated in this way.
 |
| | Fig. 6 Co-precipitation synthesis of multiphase TiO2 nanostructures; (a1) nanorods,256 (a2, a3, b3) rutile nanoparticles,23,258 (a4, b4) anatase nanoparticles,23 (b1 and b2) nanoparticles.327 (a1) is reprinted with permission from ref. 256. (a2) is reprinted with permission from ref. 258. Copyright 2017. Elsevier. (a3, a4 and b3) are reprinted with permission from ref. 23. Copyright 2016. Elsevier. (b1) is reprinted with permission from ref. 327. Copyright 2016. Thai Journal of Nanoscience and Nanotechnology. | |
Here, we review all the literature reports, to the best of our knowledge, concerning an easy way to produce multiphase TiO2 nanostructures in a short reaction time, using hazardless starting ingredients and that are inexpensive for feasible scale-up and to produce a high yield with high purity in industrial production via the mainly sol–gel, hydrothermal and co-precipitation methods. Table 3 presents an overview of the facile chemical synthesis approaches for multiphase-TiO2 nanostructures that are usually available through these routes.
3.3. Growth mechanism
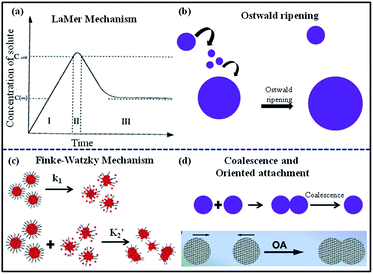
One of the most demanding concerns in the efficient processing of these multiphase TiO2 nanostructures is the control of their size, morphology and microstructure. An apparent interpretation of the growth mechanism for the formation of multiphase TiO2 nanostructures is mandatory in this respect and is shown in Scheme 3. It is well known that the synthesis process for the formation of nanostructures is classically categorized into two events: (i) nucleation and (ii) growth.260–262 In the nucleation process, small clusters composed of a few atoms (nuclei) are formed in the solution starting from monomers; while in the growth regime, existing nuclei grow to form larger particles.97 The mechanistic understanding of various aspects of the synthesis procedure can be established from a combination of crystallography and kinetics. Interestingly, the detailed mechanism still needs further investigation of the phase, structure and shape formation of TiO2. The chemical growth of nanostructured materials certainly entails the process of gelation or precipitation of a solid phase from the solution depending on the synthetic routes. An excellent perceptive of the processes and parameters ensuring the gel or precipitate formation helps to enhance the growth of nanoparticles to obtain the desired size and morphology.127 As the recent literature search indicated, there is immense interest in explaining the preliminary mechanisms, such as Finke–Watzky two step mechanisms, coalescence and oriented attachment as well as the LaMer burst nucleation followed by Ostwald ripening,137 aggregation and many more.262–265 The study of the nucleation and growth process, the tailored morphology and crystalline structure and annealing/calcination treatments, has thus, become an exciting concern to produce multiphase nanostructures. With that in mind, the present review expresses the description of phase transformation, nucleation, growth, coarsening and agglomeration processes, including the change in temperature and chemical environment of multiphase TiO2 nanostructures synthesized via facile chemical routes.
 |
| | Scheme 3 Different possible growth mechanisms for the synthesis of nanostructured TiO2 materials. (a) is reprinted with permission from ref. 325. Copyright 2014. American Chemical Society. (c) is reprinted with permission from ref. 326. Copyright 2015. The Royal Society of Chemistry. | |
Herein, the present review elaborates a brief description on the phase formation/transformation and different morphological characteristics of multiphase TiO2 nanostructures. The optimized procedures and growth mechanisms for the sol–gel, hydrothermal and co-precipitation methods of multiphase TiO2 nanostructures are also reviewed. In addition, the impacts of these nanostructures on the photoactive and biological responses are also described. Moreover, the review discusses the phase-, size- and morphology-dependent different transitions relating to the defect sites on multiphase TiO2 nanostructures as assessed by UV-Vis and PL spectroscopy. Furthermore, a comparative study assessed photocatalysis by modifying the surface of multiphase TiO2 nanostructures with inorganic (SiO2) to that of an organic coating derived from green tea (Camellia sinensis), independently with a comprehensive mechanism given. Additionally, it covers the fundamental concepts on efficient formation via facile chemical routes and the growth mechanism of multiphase TiO2 nanostructures. Finally, the present review composes a novel mechanism emphasizing the effect of multiphase TiO2 nanostructures on biosafety/human health by using essential evidence available in the literature.
4. Crystallographic structures
X-ray diffraction (XRD) analysis is essential to identify the crystallographic characteristics, such as gross structural analysis, phase transition, phase identification and phase purity determination of multiphase TiO2 nanostructures. Illustrations of the XRD patterns of the anatase-, -brookite and -rutile structural phases of TiO2 nanostructures are depicted in Fig. 7–9, which reveal the crystallinity, phase identification and phase purity of multiphase TiO2 nanostructures. In specific 2θ ranges (20–80°), the XRD patterns are sufficiently distinct, creating a clear classification of the multiphase TiO2 nanostructures.
4.1. Anatase-TiO2
Fig. 7a1 provides the XRD pattern of anatase-TiO2 nanostructures. The Bragg's position of the diffraction peaks and the relative intensity of the diffraction peaks accord perfectly with the standard JCPDF card no. 73-1764, corresponding to the tetragonal crystal system of anatase-TiO2 (space group: I41/amd (141); a = b = 0.377 nm, c = 0.948 nm).23 All of the diffraction peaks were identified as characteristic of the XRD pattern of anatase-TiO2. The presence of diffraction peaks at ∼25.06°, 36.9°, 37.8°, 38.6°, 48.1°, 54.1°, 55.1°, 62.7°, 68.7°, 70.1° and 75.1° indicate the (101), (103), (004), (112), (200), (105), (211), (204), (116), (220) and (215) lattice planes, respectively, indexing to a pure and highly crystalline anatase-TiO2 phase. No additional peaks corresponding to impurities and other structural phases were detected, which indicates the phase purity and high crystallinity synthesis of the anatase-TiO2 phase. The representative ball-and-stick structure of anatase-TiO2 is illustrated in Fig. 7b1. The anatase-TiO2 has a crystalline structure that agrees with the tetragonal system with a dipyramidal habit (as shown in Fig. 7c1).142,256
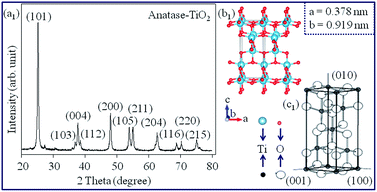 |
| | Fig. 7 Structural characteristics of anatase-TiO2; (a1) XRD pattern,275 (b1) ball-and-stick structure,142 (c1) the tetragonal system with a dipyramidal habit.256 Colour code; O atoms: red (small balls), grey (large balls) and Ti atoms: blue (large balls), black (small balls). Unit cells are outlined using thin lines. (a1) is reprinted with permission from ref. 275. Copyright 2015. VBRI Press. (b1) is reprinted with permission from ref. 142. Copyright 2014. American Chemical Society. (c1) is reprinted with permission from ref. 256. | |
4.2. Brookite-TiO2
The XRD pattern of brookite-TiO2 nanostructures is shown in Fig. 8a1. The Bragg's position of the diffraction peaks and the relative intensity of the diffraction peaks accord perfectly with the standard JCPDF card no. 76-1936, corresponding to an orthorhombic crystal system of brookite-TiO2 (space group: Pbca (61); a = 0.919 nm, b = 0.546 nm, c = 0.515 nm). All of the diffraction peaks were identified as characteristic of the XRD pattern of brookite-TiO2. The presence of diffraction peaks at ∼25.26°, 37.9°, 47.9°, 54.1°, 55.1°, 62.7°, 68.9°, 70.3° and 75.3° indicate the (210), (021), (321), (230), (421), (331), (040), (332) and (531) lattice planes, respectively, indexing to a pure and highly crystalline brookite-TiO2 phase. No additional peaks corresponding to impurities and other structural phases were detected, which indicates the phase purity and high crystallinity synthesis of the anatase-TiO2 phase. The representative ball-and-stick structure of brookite-TiO2 is illustrated in Fig. 8b1. The brookite-TiO2 phase has a crystalline structure that agrees with the orthorhombic crystal system (as shown in Fig. 8c1).142,256
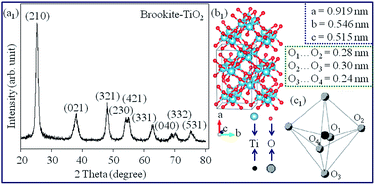 |
| | Fig. 8 Structural characteristics of brookite-TiO2; (a1) XRD pattern,275 (b1) ball-and-stick structure,142 (c1) an orthorhombic crystalline structure.256 Colour code; O atoms: red (small balls), grey (large balls) and Ti atoms: blue (large balls), black (small balls). Unit cells are outlined using thin lines. (a1) is reprinted with permission from ref. 275. Copyright 2015. VBRI Press. (b1) is reprinted with permission from ref. 142. Copyright 2014. American Chemical Society. (c1) is reprinted with permission from ref. 256. | |
4.3. Rutile-TiO2
Fig. 9a1 provides the XRD pattern of TiO2 nanostructures. The Bragg's position of the diffraction peaks and the relative intensity of the diffraction peaks accord perfectly with the standard JCPDF card no. 73-1765, also corresponding to the tetragonal crystal system of rutile-TiO2 (space group: P42/mnm (136); a = b = 0.458 nm, c = 0.295 nm). All of the diffraction peaks were identified as characteristic of the XRD pattern of rutile-TiO2. The presence of diffraction peaks at ∼27.5°, 36.2°, 39.3°, 41.4°, 44.0°, 54.3°, 56.5°, 62.7°, 63.9°, 69.1°, 69.8° and 76.7° indicate the (110), (101), (200), (111), (210), (211), (220), (002), (310), (301), (311) and (202) lattice planes, respectively, indexing to a pure and highly crystalline rutile-TiO2 phase. No additional peaks corresponding to impurities and other structural phases were detected, which indicates the phase purity and high crystallinity synthesis of the anatase-TiO2 phase. The representative ball-and-stick structure of rutile-TiO2 is illustrated in Fig. 9b1. The rutile-TiO2 has a crystalline structure that agrees with the tetragonal system with a prismatic habit (as shown in Fig. 9c1).142,256
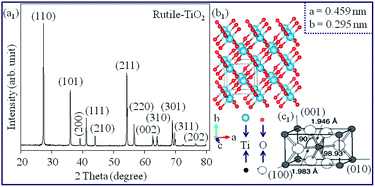 |
| | Fig. 9 Structural characteristics of rutile-TiO2; (a1) XRD pattern,23 (b1) ball-and-stick structure,142 (c1) the tetragonal system with a prismatic habit.256 Colour code; O atoms: red (small balls), grey (large balls) and Ti atoms: blue (large balls), black (small balls). Unit cells are outlined using thin lines. (a1) is reprinted with permission from ref. 23. Copyright 2016. Elsevier. (b1) is reprinted with permission from ref. 142. Copyright 2014. American Chemical Society. (c1) is reprinted with permission from ref. 256. | |
5. Morphological and microstructural features
Electron microscopy (EM) studies using scanning EM (SEM), field emission scanning EM (FE-SEM) and high-resolution transmission EM (HR-TEM) were utilized to investigate the different morphologies and for microstructural identification in real as well as in reciprocal spaces for assessing the phase-dependent morphology of amorphous- and crystalline-TiO2 nanostructures.
5.1. SEM aspects
The representative micrographs of amorphous- and multiphase-TiO2 (anatase-, brookite- and rutile-TiO2) nanostructures using SEM and FE-SEM images are shown in Fig. 10–13. These figures reveal the general/surface morphology of the TiO2 nanostructures.
5.1.1. Amorphous-TiO2. Fig. 10 depicts the SEM micrographs of amorphous-TiO2 (a-TiO2) nanostructures synthesized via different fabrication routes. Fig. 10(a) shows a SEM image of a-TiO2 nanotube arrays synthesized after electrochemical cycling at a current density of 400 μA cm−2.266 Fig. 10(b, c and f) represent the FE-SEM images of a-TiO2 nanotube arrays synthesized via the hydrothermal method under different reaction conditions.267 Fig. 10(d) illustrates the bottom surface of double-wall a-TiO2 nanotube arrays produced via anodization.268 Uniform a-TiO2 nanoparticles with an average diameter of 500 nm obtained through a sol–gel process is represented in Fig. 10(e). Fig. 10(g) elucidates the electrodeposited thin film of a-TiO2.173
 |
| | Fig. 10 SEM micrographs of a-TiO2 nanostructures: (a–d) nanotube arrays, (e) nanoparticles, (f) nanotube, (g) thin film. Ref: [a],266 [b, c, f],267 [d],268 [e],328 [g].173 (a) is reprinted with permission from ref. 266. Copyright 2011. American Scientific Publisher. (b, c and f) are reprinted with permission from ref. 267. Copyright 2012. John Wiley and Sons. (d) is reprinted with permission from ref. 268. Copyright 2014. The Chemical Society of Japan. (e) is reprinted with permission from ref. 328. Copyright 2012. John Wiley and Sons. (g) is reprinted with permission from ref. 173. Copyright 2005. Elsevier. | |
5.1.2. Multiphase-TiO2. When atoms/ions/molecules are arranged in an infinite, periodic, regular and ordered way, the nanomaterials become crystalline and have different structural phases (polymorph materials). The SEM/FE-SEM images of multiphase TiO2, in particular anatase-, brookite- and rutile-TiO2, nanostructures, are represented in Fig. 11–13.
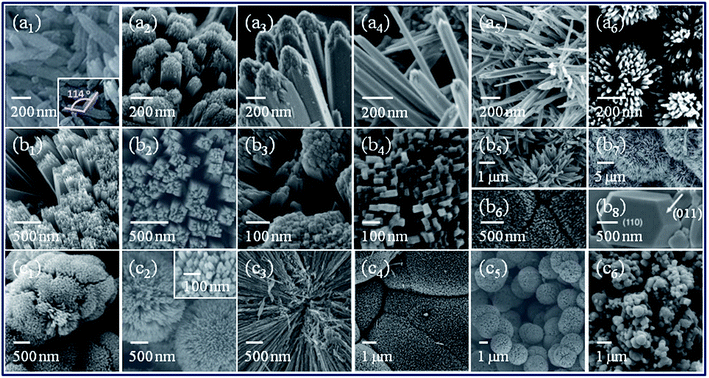
5.1.2.1. Anatase-TiO2. Fig. 11(a1–c6) show various morphological features of anatase-TiO2 nanostructures (elongated and spherical) synthesized via numerous methods. Fig. 11(a1 and a2) clearly demonstrate the SEM images of nanotubes synthesized via a liquid-phase deposition and ten cycles of TiCl4 followed by the H2O deposition method, respectively.50 Fig. 11(a3 and a4) illustrate nanofibres of anatase-TiO2 synthesized by calcination at 700 °C for 4 h (ref. 268) and an atomic layer deposition process, respectively.50 Fig. 11(a5 and a6) represent the FE-SEM images of nanorods,269 and nanorods with a nanoflake film, respectively.270 In addition, Fig. 11(b1–b6) show the SEM micrographs of elongated anatase-TiO2 nanostructures: (b1) nanorod arrays,271 (b2) nanoribbons,271 (b3) nanobelts,50 (b4–b6) nanosheets.41,272,292,331 Moreover, the spherical morphologies of anatase-TiO2 nanostructures are depicted in Fig. 11(c1–c6), such as (c1) a 3D network grown on the silicon through a surface-reaction-limited pulsed chemical vapour deposition process,50 (c2) uniform, smooth, solid spherical particles,273 (c3) nanocups,274 (c4 and c5) nanospheres273 (c6) nanoparticles.275
 |
| | Fig. 11 SEM micrographs of anatase-TiO2 nanostructures: (a1 and a2) nanotubes, (a3 and a4) nanofibres, (a5) nanorods, (a6) nanorods with nanoflakes, (b1) nanorod arrays, (b2) nanoribbons, (b3) nanowires, (b4–b6) nanosheets, (c1) 3D network, (c2) nanospheres, (c3) nanocups, (c4 and c5) nanospheres and (c6) nanoparticles. Insets (a1, a4, a6, b5 and c1) provide the corresponding higher magnification images. Ref: [a1, a2],50 [a3],329 [a4],50 [a5],269 [a6],270 [b1],330 [b2],271 [b3],50 [b4],292 [b5],41 [b6],331 [c1],50 [c3],274 [c2, c4 and c5],273 [c6].275 (a1, a2, a4, b3 and c1) are reprinted with permission from ref. 50. Copyright 2014. American Chemical Society. (a3) is reprinted with permission from ref. 329. Copyright 2005. Elsevier. (a5) is reprinted with permission from ref. 269. Copyright 2013. The Royal Society of Chemistry. (a6) is reprinted with permission from ref. 270. Copyright 2012. The Royal Society of Chemistry. (b1) is reprinted with permission from ref. 330. Copyright 2004. The Royal Society of Chemistry. (b2) is reprinted with permission from ref. 271. Copyright 2011. American Chemical Society. (b4) is reprinted with permission from ref. 292. Copyright 2009. American Chemical Society. (b5) is reprinted with permission from ref. 41. Copyright 2009. American Chemical Society. (b6) is reprinted with permission from ref. 331. Copyright 2011. John Wiley and Sons. (c2, c4 and c5) are reprinted with permission from ref. 273. Copyright 2007. American Chemical Society. (c3) is reprinted with permission from ref. 274. Copyright 2013. The Royal Society of Chemistry. (c6) is reprinted with permission from ref. 275. VBRI Press. | |
 |
| | Fig. 12 SEM micrographs of brookite-TiO2 nanostructures: (a1 and a2) nanorices,276 (a3) nanoparticles,275 (a4) nanobullets,293 (b1) nanorices,276 (b2) eggshell,277 (b3) nanotubes,278 (b4) nanoflowers, (c1 and c2) nanorods,279,280 (c3) nanotubes,278 (c4) nanorods.281 Inset (a4) illustrates the corresponding tilt-view of nanobullets. (a1, a2 and b1) are reprinted with permission from ref. 276. Copyright 2014. The Royal Society of Chemistry. (a3) is reprinted with permission from ref. 275. Copyright 2015. VBRI Press. (a4) is reprinted with permission from ref. 293. Copyright 2016. Nature Publishing Group. (b2) is reprinted with permission from ref. 277. (b3, c3) are reprinted with permission from ref. 278. Copyright 2008. The Royal Society of Chemistry. (c1) is reprinted with permission from ref. 279. Copyright 2013. The Royal Society of Chemistry. (c2) is reprinted with permission from ref. 280. Copyright 2012. Elsevier. (c4) is reprinted with permission from ref. 281. Copyright 2013. The Royal Society of Chemistry. | |
 |
| | Fig. 13 SEM micrographs of rutile-TiO2 nanostructures: (a1) nanorods,282 (a2–a5) nanorod arrays,283 (a6) nanorod spheres,284 (b1, b3 and b4) nanorod bundles,283,285 (b2) flower-like super architectures,286 (b5) urchin-like,286 (b6) nanospheres,286 (b7) nanotrees,286 (b8) a single nanoparticle,287 (c1) self-assembled nanowires,288 (c2) microspheres,286 (c3) nanorod arrays,286 (c4) quasi spheres,286 (c5) microspheres286 and (c6) nanoparticles.275 Insets: (lower inset in a1) nanorods at higher magnification, (upper inset in c2) top view of the nanorods with square-shaped ends. (a1) is reprinted with permission from ref. 282. Copyright 2011. The Royal Society of Chemistry. (a2–a5) are reprinted with permission from ref. 283. Copyright 2014. Nature Publishing Group. (a6) is reprinted with permission from ref. 284. Copyright 2014. American Chemical Society. (b1) is reprinted with permission from ref. 285. Copyright 2014. Nature Publishing Group. (b2, b5–b7, c2–c5) are reprinted with permission from ref. 286. Copyright 2012. The Royal Society of Chemistry. (b3 and b4) are reprinted with permission from ref. 283. Copyright 2014. Nature Publishing Group. (b8) is reprinted with permission from ref. 287. Copyright 2002. The Royal Society of Chemistry. (c1) is reprinted with permission from ref. 288. Copyright 2010. The Royal Society of Chemistry. (c6) is reprinted with permission from ref. 275. Copyright 2015. VBRI Press. | |
5.2. TEM/HR-TEM aspects
The detailed microstructural evidence, fine structure arrangement at the atomic level and selected area electron diffraction (SAED) and fast Fourier transform (FFT) patterns of amorphous-TiO2 (a-TiO2) and crystalline-TiO2 (anatase-, brookite- and rutile-TiO2) nanostructures can be realized in real and reciprocal spaces through taking and analyzing the TEM and HR-TEM images, which are discussed in Fig. 14–17.
5.2.1. Amorphous-TiO2. Amorphous solids do exhibit short-range order in their structures. Fig. 14(a1–a6) provide the TEM and HR-TEM images and SAED and FFT patterns of a-TiO2 nanostructures. Fig. 14(a1) represents the TEM micrograph of a-TiO2 nanoparticles having a narrowly distributed size of about 10–15 nm.259 Fig. 14(a2 and a3) show the morphological changes of the nanotube arrays with the introduction (as shown in Fig. 14(a2)) and without the introduction (as depicted in Fig. 14(a3)) of oxygen (O2) gas.268 Fig. 14(a4 and a5) elucidate the typical HR-TEM micrograph at low and high magnifications, respectively. The FFT pattern of a-TiO2 (as illustrated in the upper inset of Fig. 14(a5)) represents the semicircle-like diffuse spots centred at 3.1 ± 0.1 Å. The FFT pattern reveals that the contrast patterns in the micrograph can be assigned to the chains of octahedral species linked through Ti–O–Ti bridges at a distance that is: (i) lower than that related to the corner sharing (generally ∼3.5 Å), but (ii) higher than the characteristic distance for Ti–O–Ti octahedrons in an edge-sharing configuration (normally ∼3.0 Å).289 Fig. 14(a6) shows the TEM image of a-TiO2 nanotube arrays with a gradually thickened wall with depth. The upper inset of Fig. 14(a6) reveals the diffuse ring SAED pattern of the single nanotube and indicates the amorphous nature of nanotube arrays.267
 |
| | Fig. 14 TEM/HR-TEM micrographs of a-TiO2 nanostructures: (a1) TEM image of nanoparticles,259 (a2) nanotubes with the introduction of O2 gas,268 (a3) nanotubes without the introduction of O2 gas,268 HR-TEM image of nanoparticles at low (a4) and high (a5) magnification,289 (a6) TEM images of a single nanotube.267 Insets provide: (a5) corresponding FFT pattern and (a6) corresponding SAED pattern. (a1) is reprinted with permission from ref. 259. Copyright 2013. Indian Journal of Engineering & Materials Sciences. (a2 and a3) are reprinted with permission from ref. 268. Copyright 2014. The Chemical Society of Japan. (a4 and a5) are reprinted with permission from ref. 289. (a6) is reprinted with permission from ref. 267. Copyright 2012. John Wiley and Sons. | |
5.2.2. Multiphase TiO2. Most solids are crystalline, with the atoms, ions, or molecules of which they are composed falling into regular, repeated 3D patterns. The presence of long-range order is thus the defining property of a crystal. The observation of multiphase TiO2 (especially anatase-, brookite-, and rutile-TiO2) nanostructures by means of TEM/HR-TEM are commonly overlooked, but here the results are displayed as well as discussed in Fig. 15–17.
5.2.2.1. Anatase-TiO2. Fig. 15(a1–f2) provide the TEM/HR-TEM micrographs at low and high magnifications as well as the SAED and FFT patterns of anatase-TiO2 nanostructures. Fig. 15(a1 and a2) represent the bright-field TEM and HR-TEM micrographs of nanobelts obtained from an alkali-hydrothermal process with the growth direction along the [010] plane.290 Fig. 15(b1 and b2) show the low- and high-magnification TEM images of nanorods, respectively. From the figures, it can clearly be observed that the crystalline behaviour is along their entire lengths. The calculated interplanar spacing d(101) = 0.35 nm, which affirms the presence of anatase-TiO2.291 Fig. 15(c1 and c2) elucidate the low- and high-magnification TEM images of nanoflakes. The lattice fringes with interplanar spacings of d(101) = 0.35 nm are consistent with the anatase-TiO2.291 Fig. 15(d1 and d2) show the continuous (200) atomic planes with a lattice spacing of 0.19 nm.292 Fig. 15(e1 and e2) indicate the TEM and HR-TEM images of the nanofibres, respectively.268 Moreover, the TEM and HR-TEM images of nanoparticles synthesized by a wet chemical method are displayed in Fig. 15(f1 and f2), respectively.23
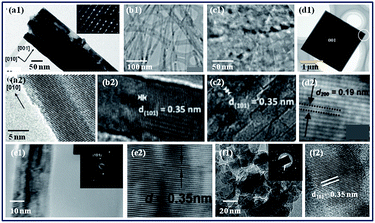 |
| | Fig. 15 TEM/HR-TEM micrographs of anatase-TiO2 nanostructures: (a1) bright-field TEM image of a nanobelt and the corresponding HR-TEM image,290 (a2) taken along the [100] direction,290 (b1) low- and (b2) high-magnification TEM images of nanorods,291 (c1) low- and (c2) high-magnification TEM images of nanoflakes,291 (d1) HR-TEM image of a nanocrystal and its corresponding lattice fringe image (d2),292 (e1) TEM and (e2) HR-TEM images of the nanofibres329 and (f1) TEM and corresponding HR-TEM image (f2) of nanoparticles.23 Insets in (a1, e1, f1) provide their corresponding SAED pattern. (a1 and a2) are reprinted with permission from ref. 290. Copyright 2015. John Wiley and Sons. (b1, b2, c1 and c2) are reprinted with permission from ref. 291. Copyright 2012. The Royal Society of Chemistry. (d1 and d2) are reprinted with permission from ref. 292. Copyright 2009. American Chemical Society. (e1 and e2) are reprinted with permission from ref. 329. Copyright 2005. Elsevier. (f1 and f2) are reprinted with permission from ref. 23. Copyright 2016. Elsevier. | |
 |
| | Fig. 16 TEM/HR-TEM micrographs of brookite-TiO2 nanostructures: (a1, b1, c1, d1) TEM images of nanotubes,244,278,289,293 (a2, b2, c2, d2) HR-TEM images of nano-tubes, -flowers, -particles, -bullets, respectively.244,278,289,293 Insets (in b2, c1, d1) correspond to the FFT patterns. (a1 and a2) are reprinted with permission from ref. 278. Copyright 2008. The Royal Society of Chemistry. (b1 and b2) are reprinted with permission from ref. 244. Copyright 2009. The Royal Society of Chemistry. (c1 and c2) are reprinted with permission from ref. 289. (d1 and d2) are reprinted with permission from ref. 293. Copyright 2016. Nature Publishing Group. | |
 |
| | Fig. 17 TEM/HR-TEM micrographs of rutile-TiO2 nanostructures: (a1 and a2) TEM image and corresponding HR-TEM image of a nanobelt,290 (b1 and c1) TEM images of one individual nanowire and nanorod,271 (b2 and c2) corresponding HR-TEM images of the nanowire and nanorod,271 (d1 and d2) low magnification TEM and HR-TEM images of multilevel branched architectures,286 (e1) the lattice image and (e2) reconstructed image from the square region in (e1).294 Insets (in a1, b1 and c1) illustrate the corresponding SAED patterns. (a1 and a2) are reprinted with permission from ref. 290. Copyright 2015. John Wiley and Sons. (b1, b2, c1 and c2) are reprinted with permission from ref. 271. Copyright 2011. American Chemical Society. (d1 and d2) are reprinted with permission from ref. 286. Copyright 2012. The Royal Society of Chemistry. (e1 and e2) are reprinted with permission from ref. 294. Copyright 2004. Nature Publishing Group. | |
6. Spectroscopic and band characteristics
The optical properties of SMONs have been studied via numerous spectroscopic techniques, such as Raman, Fourier transform infrared (FT-IR), UV-Visible (UV-Vis) and photoluminescence (PL) spectroscopy.322 Raman spectroscopy is a spectroscopic technique that is mainly based on an inelastic scattering of monochromatic light, normally from a laser source in the visible, near IR or ultraviolet range. Raman peaks initiate mainly from the vibrational modes (Eg and A1g), which are related to different crystal planes. This provides, thus, a high accuracy and sensitivity for measuring the percentage of the exposed facets from the micro perspective of molecular bonding together with the benefit of fewer measured errors. FT-IR spectroscopy is an absorption spectroscopic technique that establishes the vibrational transitions in molecules generated by various stretching or bending motions in the chemical bonds. It is well known that an optical transition occurs when a photon is absorbed or emitted by a defect; and because this transition takes place essentially instantaneously on the scale of lattice relaxations, it arises at fixed atomic coordinates. The absorption band characteristics of photons have been widely observed using UV-Vis spectroscopy.13,275,299,300,313,314,321–324
6.1. Raman spectroscopy
Fig. 18 shows the Raman spectra of multiphase TiO2 (anatase-, brookite- and rutile-TiO2) nanoparticles synthesized by the sol–gel method. Raman spectroscopy is analyzed in the Raman shift ranging from 200 cm−1 to 800 cm−1 at the excitation line of 514 nm at room temperature. When Raman spectroscopy was applied to characterize the nanoparticles, it was observed that: (i) the Eg peak is mainly caused by symmetric stretching, (ii) the B1g peak is caused by symmetric bending and (iii) the A1g peak is caused by antisymmetric bending vibrations of O–Ti–O in the TiO2 nanoparticles. The major Raman bands were observed at 398, 517 and 640 cm−1 and verify the anatase phase of TiO2. These bands can be attributed to Raman active modes of the anatase structural phase with the symmetries of B1g, A1g and Eg, respectively. The strong Raman peaks of brookite-TiO2 were seen at 395, 446 and 637 cm−1, where the peaks at 395 cm−1 and 637 cm−1 correspond to B2g and A1g, respectively.295 The thermodynamically stable rutile-TiO2 exhibited major peaks at 397, 515 and 638 cm−1 with a minor peak at 247 cm−1.296–298
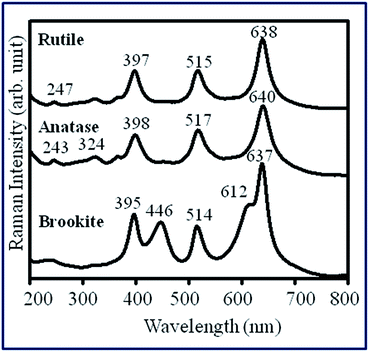 |
| | Fig. 18 Raman spectra of brookite-, anatase- and rutile-TiO2 nanoparticles.275 Reprinted with permission from ref. 275. Copyright 2015. VBRI Press. | |
6.2. FT-IR spectroscopy
FT-IR spectroscopy has been used to investigate the nature of chemical bonding present in multiphase TiO2 nanostructures. Fig. 19 represents the FT-IR spectra in the region 4000–400 cm−1 versus the transmittance for anatase-, brookite-, and rutile-TiO2 nanoparticles synthesized by facile chemical routes. The observed transmittance bands in the region 800–400 cm−1 are attributed to Ti–O and/or Ti–O–Ti bonds, as represented in Fig. 19. The peaks, therefore, at 545, 745 and 770 cm−1 can be associated with ν(Ti–O) vibrations in multiphase-TiO2 nanoparticles.23 Also, transmittance bands are found at 1431, 1451, 1637, 1648 and 1655 cm−1 and were assigned to an O–H bending mode. Two transmittance bands were noticed at 2514 and 2922 cm−1, representing the combination bands in TiO2 nanoparticles.23,299,300 Additionally, broad transmittance bands were ascertained in the wavenumber region of 3650–3000 cm−1 and could be ascribed to physically adsorbed water on the surface of TiO2 nanoparticles.301,302
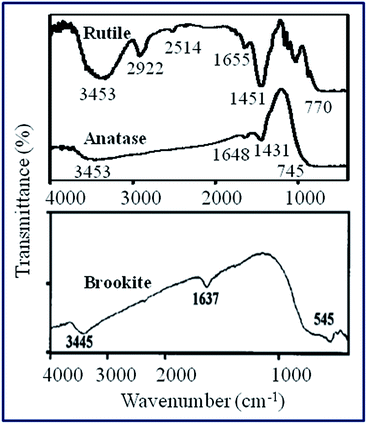 |
| | Fig. 19 FT-IR spectra of brookite-, anatase- and rutile-TiO2 nanoparticles.23,301 Reprinted with permission from ref. 23. Copyright 2016. Elsevier and ref. 301. Copyright 2000. Springer. | |
6.3. UV-Vis spectroscopy
The optical properties and related band gap characteristics have been studied using UV-Vis spectroscopy and the results are displayed in Fig. 20(a and b). Fig. 20(a) shows the results from reflectance measurements of anatase-, brookite-, and rutile-TiO2 nanostructures. The corresponding optical band gaps of the multiphase TiO2 nanostructures are calculated from the UV-Vis reflectance spectra using the Tauc equation:
where α is the absorption coefficient, hν is the energy of the incident photon, B is a constant (characteristic of the SMON), n has two different values, either 2 for direct or 1/2 for indirect band gap transitions, and Eg is the optical band gap of SMON. The intercept on the abscissa (X-axis) of the Tauc plot (αhν)n versus hν gives the optical band gap energy of the SMON (Fig. 20(b)). The extrapolation of the reflectance versus the wavelength curves determines the optical band gap energy of multiphase TiO2 nanoparticles: (i) 3.21 eV for anatase-TiO2, (ii) 3.13 eV for brookite-TiO2 and (iii) 3.00 eV for rutile-TiO2 nanoparticles. The obtained reflectance spectra were converted to equivalent absorption coefficients289 providing the same results as those obtained from extrapolation for indirect transitions (as provided in the upper segment in Fig. 20(b)). Furthermore, analysis for the direct transitions (as shown in the lower segment in Fig. 20(b)) resulted in transitions at higher energies.204 A summary of the obtained parameters from the UV-Vis spectra and the indirect and direct optical band gaps are displayed in Table 4.
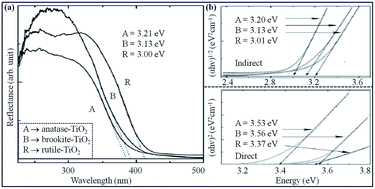 |
| | Fig. 20 Optical characteristics: (a) UV-Vis reflectance spectra, (b) optical band gap evaluation of multiphase TiO2 nanoparticles, where the symbols A, B and R correspond to anatase-, brookite and rutile-TiO2.289 Reprinted with permission from ref. 289. | |
Table 3 Summary of various synthesis routes for multiphase-TiO2 nanostructures
| Phase-TiO2 |
Nanostructures |
Synthesis routes |
| Anatase-TiO2 |
Nano-particles, -wires, -tubes, -cuboid, -belts, -tubes, -fibres, -cups, -spheres, -sheets |
Sol–gel, hydrothermal and co-precipitation |
| Brookite-TiO2 |
Nano-particles, -bullets, -rices, -tubes, -flowers |
Sol–gel, hydrothermal and co-precipitation |
| Rutile-TiO2 |
Nano-particles, -rods, -tree, -spheres, -rod arrays |
Sol–gel, hydrothermal and co-precipitation |
Table 4 Summary of the obtained parameters from UV-Vis spectra and the indirect and direct optical band gaps of multiphase-TiO2 nanostructures
| Multiphase-TiO2 |
Optical band gap values (Eg in eV) |
| Extrapolation |
Indirect |
Direct |
| Anatase-TiO2 |
3.21 |
3.20 |
3.53 |
| Brookite-TiO2 |
3.13 |
3.13 |
3.56 |
| Rutile-TiO2 |
3.00 |
3.01 |
3.37 |
7. Applications
7.1. Photocatalysis
Photocatalysis is the surface phenomenon that is defined as the catalytic property of a SMON when photons are irradiated on it. The surface property of multiphase-TiO2 nanoparticles (in particular anatase- and rutile-TiO2) can be manipulated by coating their surfaces with either an inorganic (silica) or organic (green tea) layer via a chemical approach. In general, the main constituent of green tea extract is polyphenols, predominantly the catechins.303–305 Out of the four major catechins [(i) epicatechin (EC) (ii) epicatechin gallate (ECG) (iii) epigallocatechin (EGC) and (iv) epigallocatechin gallate (EGCG)], EGCG is the main component found in green tea.306 The antioxidant action of polyphenols found in green tea is known to increase the antioxidant capacity of blood.307 Thus, green tea extract was expected to be an attractive material for modifying the surface of photocatalysts.227,235 Herein, anatase- and rutile-TiO2 were selected in the present context in regard to their photocatalytic applications. In addition, these two structural phases were coated with: (i) silica (TiO2_silica; anatase/rutile_silica) and (ii) green tea (TiO2_polyphenol; anatase/rutile_polyphenol).23
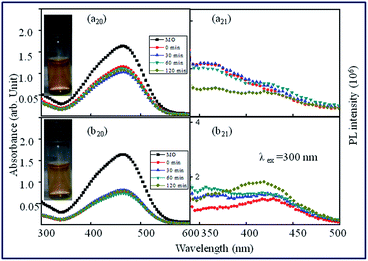
7.1.1. Bare anatase- and rutile-TiO2 nanoparticles. The photocatalytic activity of bare anatase- and rutile-TiO2 nanoparticles was analyzed by studying the photodegradation of methyl orange (MO) solution and then confirmed by the PL spectra, as depicted in Fig. 21(a10 and b11). PL is an important tool for exploring the recombination phenomenon occurring in the excitons analysis of SMON. The UV-Vis absorption spectrum of MO solution with an initial concentration 0.153 mg l−1 established as a broad band at 464 nm, which corresponds to π → π* transition,308 as depicted in Fig. 21(a10 and b10). In the PL spectrum (inset in Fig. 21(b11)), three peaks can be observed at 334, 394 and 524 nm in the case of the bare MO solution. A summary of the photodegradation and photoluminescence characteristics of methyl orange dye by the catalysts, bare anatase- and rutile-TiO2 nanoparticles at various UV irradiation time is represented in Table 5. However, the trend in photocatalytic activity as evidenced by UV-Vis absorption was found to be peculiar after 60 min and 30 min when anatase-TiO2 and rutile-TiO2, respectively, were used as the catalyst. The reason behind this is that deactivation of the catalyst occurs to some extent due to the formation of a number of degradation fragments of MO at the catalyst surface that block the active sites of the catalyst and also as the solution becomes concentrated, which scatters the UV light instead of transmitting it through the solution. These cause hindrance for further photodegradation.23,309,310
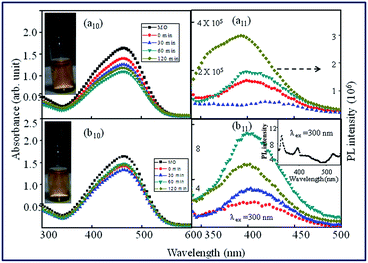 |
| | Fig. 21 Photocatalytic and photoluminescence spectra of anatase- and rutile-TiO2 nanoparticles. UV-Vis spectra of the photodegradation of methyl orange dye by anatase (a20) and rutile (b20), respectively, at various time intervals. (a21), and (b21) show the PL characteristics of anatase and rutile, respectively at λex = 300 nm.23 Reprinted with permission from ref. 23. Copyright 2016. Elsevier. | |
Table 5 Summary of the photodegradation and photoluminescence (PL) characteristics of methyl orange dye by bare anatase- and rutile-TiO2 nanoparticlesa
| Bare TiO2 |
UV irradiation time (minutes) |
Characteristics |
Remarks |
| UV absorbance |
PL intensity |
Photodegradation |
Recombination |
| Symbols introduced: ✓ → yes, ✗ → no. |
| Anatase TiO2 |
30 |
Decreases |
Least peak |
✓ |
✗ |
| 60 |
Again decreases |
Moderate peak |
✓ |
✓ |
| 120 |
Increases |
Highest peak |
✗ |
✓ |
| Rutile TiO2 |
30 |
Decreases |
Lower peak |
✓ |
✗ |
| 60 |
Increases |
Highest peak |
✗ |
✓ |
| 120 |
Decreases |
Moderate peak |
✓ |
✓ |
7.1.2. Coated anatase- and rutile-TiO2 nanoparticles.
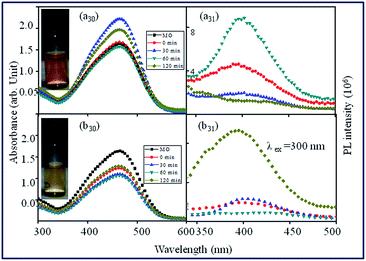
7.1.2.1. Anatase- and rutile-TiO2_silica. The photocatalytic activity of anatase- and rutile-TiO2_silica nanoparticles was also assessed by studying the photodegradation of methyl orange (MO) solution, and then its corresponding PL spectra was also investigated, as depicted in Fig. 22(a20 and b21). The photocatalytic degradation of MO dye by anatase_silica and rutile_silica show a frequent decrease in absorbance at 0 min as compared to pristine MO solution, which may be due to inter/intra-chain interactions311 of the catalyst with the MO dye as shown in Fig. 22(a20 and b20). As UV irradiation is exposed at various time intervals, overlapping and diminished intensity absorbance curves are observed revealing the uniform nature of the silica coating helps to inhibit the photocatalytic activity of the catalyst. Silica, being a good radical scavenger, engulfs all the radicals produced by TiO2. To understand the fate of the photogenerated charge carriers, PL spectrum analysis was also employed at λex = 300 nm, which showed a decreasing trend with increasing irradiation time, indicating that the electrons and holes generated are involved in degradation and not in exciton generation, thus leading to a drop in PL emission, as shown in Fig. 22(a21 and b21). The reduction in the photodegradation of MO dye by coating the surface of rutile with silica correlates with the already reported results in the literature.312
 |
| | Fig. 22 Photocatalytic and photoluminescence spectra of silica-coated anatase- and rutile-TiO2 nanoparticles. UV-Vis spectra of the photodegradation of methyl orange dye by anatase_silica (a20) and rutile_silica (b20), respectively, at various time intervals. (a21) and (b21) show the PL characteristics of anatase_silica and rutile_silica, respectively.23 Reprinted with permission from ref. 23. Copyright 2016. Elsevier. | |
 |
| | Fig. 23 Photocatalytic and photoluminescence spectra of polyphenol-coated-anatase and -rutile-TiO2 nanoparticles. UV-Vis spectra of the photodegradation of methyl orange dye by anatase_polyphenol (a30) and rutile_polyphenol (b30), respectively, at various time intervals. (a31) and (b31) show the PL characteristics of anatase_polyphenol and rutile_polyphenol, respectively.23 Reprinted with permission from ref. 23. Copyright 2016. Elsevier. | |
Table 6 Summary of the photodegradation and photoluminescence characteristics of methyl orange dye by anatase- and rutile-TiO2_polyphenol nanoparticlesa
| Phase-TiO2_polyphenol |
UV irradiation time (minutes) |
Characteristics |
Remarks |
| UV absorbance |
PL intensity |
Photodegradation |
Recombination |
| Symbols introduced: ✓ → yes, ✗ → no. |
| Anatase-TiO2_polyphenol |
30 |
Increases |
Reduced peak |
✗ |
✗ |
| 60 |
Decreases |
Highest intensity |
✓ |
✓ |
| 120 |
Increases |
Least intensity |
✗ |
✗ |
| Rutile-TiO2_polyphenol |
30 |
Decreases |
Lower intensity |
✓ |
✗ |
| 60 |
Again decreases |
Least intensity |
✓ |
✗ |
| 120 |
Increases |
Highest intensity |
✗ |
✓ |
7.2. Concomitant summary
On comparing the coated forms of anatase- and rutile-TiO2 nanoparticles, the polyphenol-coated form shows a higher photocatalytic activity than silica-coated forms, which is accounted for by some microstructural alterations and by the nature and thickness of the coating moiety. In summary, (as illustrated in Scheme 4), the results show that anatase- and rutile-TiO2_silica were found to be least photocatalytically active, ensuring their cosmetic application in sunscreens, whereas rutile-TiO2_polyphenol and bare anatase-TiO2 had the highest photocatalytic activity amongst their corresponding forms when reviewed in a broad research area including the photodegradation of toxic organic dyes.
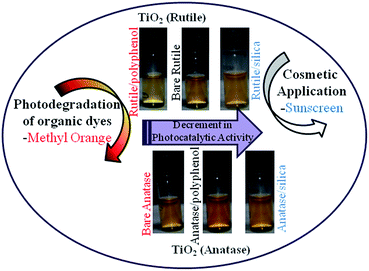 |
| | Scheme 4 Pictorial representation of the photodegradation of methyl orange by TiO2 nanoparticles.23 Reprinted with permission from ref. 23. Copyright 2016. Elsevier. | |
7.3. Bio-safety and human health
TiO2 nanoparticles are utilized to inhibit bacterial growth owing to their broad antibacterial characteristics. The influence of nano-sized anatase-TiO2 particles on biofilms formed by Enterobacter sp. (1.25 μm)315 was evaluated to treat wound infection. Different concentrations of anatase-TiO2 nanoparticles were utilized to assist gaining an in-depth understanding. In our case, in the presence of nanoparticles, it was noticed that bacteria using their appendages expressed surface adhesion proteins, became adhered to the solid surface and formed a biofilm via a defence mechanism.
These nanoparticles showed antibacterial characteristics as evidenced by the serial dilution plate method, as displayed in Fig. 24, which clearly demonstrate that cell viability could be observed to be completely arrested at 700 μg ml−1 of nanoparticle concentration and at 72 h incubation time.
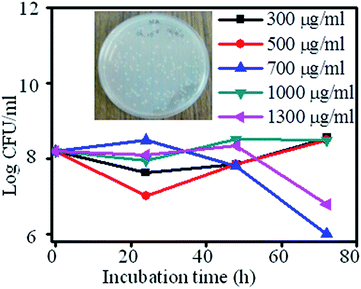 |
| | Fig. 24 Growth of bacterial species versus incubation time (h) for Enterobacter sp.51 Reprinted with permission from ref. 51. Copyright 2017. Taylor and Francis. | |
The obtained results from the serial dilution plate method were supported by electron microscopy analysis, SEM and TEM, as represented in Fig. 25(a–i). EM results revealed the interaction of the bacterial biofilm with nanoparticles. SEM micrographs, as shown in Fig. 25(a–c), revealed the fact that nanoparticles were spread all over the bacterial lump and thus the biofilms were encrusted with nanoparticles. To orchestrate the bio-distribution of nanoparticles into the biofilm and to detect the size of bacterium, HR-TEM was performed, as elucidated in Fig. 25(d–i). The formation of a bacterial biofilm was again confirmed by TEM, as depicted in Fig. 25(d–e). The size of single Enterobacter sp. bacterium was observed to be ∼1.25 μm, which was found to be in agreement with Bergey's Manual of Determinative Bacteriology.315 Moreover, complete entrapment of agglomerated TiO2 nanoparticles into the biological mass was affirmed by HR-TEM, as portrayed in Fig. 25(g–i). The nanoparticles also affected the morphology of bacterial cells as represented by blue squares, shown in Fig. 25(g and i). Thus, the antibacterial activity of anatase-TiO2 nanoparticles against a biofilm can be used to treat human wound infection.51,316–320
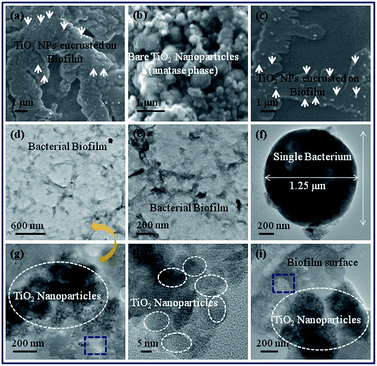 |
| | Fig. 25 (a)–(c) SEM micrographs of TiO2 nanoparticles (700 μg ml−1) interaction with Enterobacter sp. for 72 h incubation, TEM images of (d)–(f) bare Enterobacter sp. and (g)–(i) interaction of TiO2 nanoparticles with bacterial biofilm. Blue squares (in (g) and (i)) represent a ruptured biofilm.51 Reprinted with permission from ref. 51. Copyright 2017. Taylor and Francis. | |
8. Conclusions
Thanks to the efficient efforts of experienced scientists and engineers throughout the world working on multiphase TiO2 nanomaterials over the past decades, the advances made in research in this field are enormously significant and noteworthy. The present review article has presented a widespread analysis of the state-of-art research into the growth mechanism behind the efficient synthesis of multiphase TiO2 nanostructures through chemical routes. More exploration on a wide variety of unique nanostructures has been analyzed according to their various structural, morphological and microstructural features.
In brief, the present review mainly provides key information to unveil more about the multiphase TiO2 nanostructures, ranging from their efficient synthesis to control the morphology, growth mechanism and properties to their photoactive potential characteristics. Additionally, the opto-biological properties are strongly influenced by the tunable morphologies, particle sizes and phase transformations of multiphase TiO2 nanostructures.
Ultimately, we hope that this review article not only summarizes the recent progress but will also help to inspire research activity in this field on understanding the intriguing characteristics of multiphase TiO2 nanostructures. The present review has mainly focused on anatase, brookite and rutile; however, the research focus on the structural, morphological and microstructural features of the remaining crystalline and noncrystalline phases of TiO2 should also be interesting in the near future. Moreover, their nano–bio assessment also deserves more attention in the future.
Conflicts of interest
There are no conflicts to declare.
Acknowledgements
The authors sincerely thank the Director, NPL New Delhi, India for providing the necessary experimental facilities. We would like to acknowledge CSIR network project, BSC-0112 (NanoSHE). We also acknowledge to all the authors whose published articles help us as a resource for completion of this review article. There is no financial concern to publish this review article.
Notes and references
- C. C. Yang and Y. W. Mai, Mater. Sci. Eng., R, 2014, 79, 1–40 CrossRef.
- M. K. Song, S. Park, F. M. Alamgir, J. Cho and M. Liu, Mater. Sci. Eng. R, 2011, 72, 203–252 CrossRef.
- D. C. Sayle, J. A. Doig, S. A. Maicaneanu and G. W. Watson, Phys. Rev. B: Condens. Matter Mater. Phys., 2002, 65, 245414 CrossRef.
- A. Chandran, J. Prakash, J. Gangwar, T. Joshi, A. K. Srivastava, D. Haranath and A. M. Biradar, RSC Adv., 2016, 6, 53873–53881 RSC.
- J. M. Petroski, T. C. Green and M. A. El-Sayed, J. Phys. Chem. A, 2001, 105, 5542–5547 CrossRef CAS.
- R. Datt, J. Gangwar, S. K. Tripathi, R. K. Singh and A. K. Srivastava, Quantum Matter, 2016, 5, 1 CrossRef.
- M. I. Khan, J. Solid State Chem., 2000, 152, 105–112 CrossRef CAS.
- J. Gangwar, B. K. Gupta and A. K. Srivastava, Def. Sci. J., 2016, 66, 323 CrossRef.
- K. K. Dey, D. Bhatnagar, A. K. Srivastava, M. Wan, S. Singh, R. R. Yadav, B. C. Yadav and M. Deepa, Nanoscale, 2015, 7, 6159–6172 RSC.
- K. K. Dey, A. Kumar, R. Shanker, A. Dhawan, M. Wan, R. R. Yadav and A. K. Srivastava, RSC Adv., 2012, 2, 1387 RSC.
- M. Niu, F. Huang, L. Cui, P. Huang, Y. Yu and Y. Wang, ACS Nano, 2010, 4, 681–688 CrossRef CAS PubMed.
- J. Yu, X. Yu, B. Huang, X. Zhang and Y. Dai, Cryst. Growth Des., 2009, 9, 1474–1480 CAS.
- J. Gangwar, K. K. Dey, S. K. Tripathi, M. Wan, R. R. Yadav, R. K. Singh, Samta and A. K. Srivastava, Nanotechnology, 2013, 24, 415705 CrossRef PubMed.
- C. Ye, G. Wang, M. Kong and L. Zhang, J. Nanomater., 2006, 2006, 1–5 CrossRef.
- Z. Zhang, J. Mater. Res., 2002, 17, 1698–1701 CrossRef CAS.
- Y. R. Smith, A. Kar and V. Subramanian, Ind. Eng. Chem. Res., 2009, 48, 10268–10276 CrossRef CAS.
- P. P. González-Borrero, F. Sato, A. N. Medina, M. L. Baesso and A. C. Bento, et al., Appl. Phys. Lett., 2010, 96, 061909 CrossRef.
- Q. Wang, A. Puntambekar and V. Chakrapani, Nano Lett., 2016, 16, 7067–7077 CrossRef CAS PubMed.
- X. Hu, J. Gong, L. Zhang and J. C. Yu, Adv. Mater., 2008, 20, 4845–4850 CrossRef CAS.
- G. Z. Shen, Y. Bando, B. Liu, D. Golberg and C. Lee, Adv. Funct. Mater., 2006, 16, 410–416 CrossRef CAS.
- Z. Y. Wang, B. B. Huang, X. Y. Qin, X. Y. Zhang, P. Wang, J. Y. Wei, J. Zhan, X. Y. Jing, H. X. Liu, Z. H. Xu, H. F. Cheng, X. N. Wang and Z. K. Zheng, Mater. Lett., 2009, 63, 130–132 CrossRef CAS.
- V. Sivakumar, R. Suresh, K. Giribabu and V. Narayanan, Cogent Chem., 2015, 1, 1074647 Search PubMed.
- R. Verma, A. Awasthi, P. Singh, R. Srivastava, H. Sheng, J. Wen, D. J. Miller and A. K. Srivastava, J. Colloid Interface Sci., 2016, 475, 82–95 CrossRef CAS PubMed.
- K. Karthick, S. R. Ede, U. Nithiyanantham and S. Kundu, New J. Chem., 2017, 41, 3473–3486 RSC.
- C. G. Anchieta, D. Sallet, E. L. Folettoa, S. S. da Silva, O. C. Filhob and C. A. O. do Nascimentoc, Ceram. Int., 2014, 40, 4173–4178 CrossRef CAS.
- P. Guo, L. Cui, Y. Wang, M. Lv, B. Wang and X. S. Zhao, Langmuir, 2013, 29, 8997–9003 CrossRef CAS PubMed.
- S. Zhang, L. Ren and S. Peng, CrystEngComm, 2014, 16, 6195 RSC.
- Dhiraj, B. K. Gupta, S. P. Singh, S. Singh, Govind and A. K. Srivastava, A Process for the Synthesis of highly Luminescent Green Emitting Undoped Zn2SiO4 afterglow Nano Phosphor, Indian Patent Filing No. 0044NF2017, 17-Mar-2017.
- Y. Li, M. Gecevicius and J. Qiu, Chem. Soc. Rev., 2016, 45, 2090 RSC.
- S. E. John, S. K. Mohapatra and M. Misra, Langmuir, 2009, 25, 8240 CrossRef CAS PubMed.
- J. Yu, L. Qi and M. Jaroniec, J. Phys. Chem. C, 2010, 114, 13118–13125 CAS.
- R. A. Patil, R. S. Devan, Y. Liou and Y. R. Ma, Sol. Energy Mater. Sol. Cells, 2016, 147, 240–245 CrossRef CAS.
- L. Huang, T. Liu, H. Zhang, W. W. Guo and W. Zeng, J. Mater. Sci.: Mater. Electron., 2012, 23, 2024 CrossRef CAS.
- Z. Miao, D. Xu, J. Ouyang, G. Guo, X. Zhao and Y. Tang, Nano Lett., 2002, 2, 717 CrossRef CAS.
- D. K. Yi, S. J. Yoo and D. Y. Kim, Nano Lett., 2002, 2, 1101 CrossRef CAS.
- T. Aarthi and G. Madras, Ind. Eng. Chem. Res., 2007, 46, 7 CrossRef CAS.
- R. Asahi, T. Morikawa, T. Ohwaki, K. Aoki and Y. Taga, Science, 2001, 293, 269–271 CrossRef CAS PubMed.
- A. Fujishima, X. T. Zhang and D. A. Tryk, Surf. Sci. Rep., 2008, 63, 515–582 CrossRef CAS.
- I. K. Konstantinou and T. A. Albanis, Appl. Catal., B, 2004, 49, 1–14 CrossRef CAS.
- J. C. Yu, J. G. Yu, W. K. Ho, Z. T. Jiang and L. Z. Zhang, Chem. Mater., 2002, 14, 3808–3816 CrossRef CAS.
- G. Liu, H. G. Yang, X. Wang, L. Cheng, H. Lu, L. Wang, G. Q. Lu and H. M. Cheng, J. Phys. Chem. C, 2009, 113, 21784 CAS.
- G. Liu, H. G. Yang, X. Wang, L. Cheng, J. Pan, G. Q. Lu and H. M. Cheng, J. Am. Chem. Soc., 2009, 131, 12868 CrossRef CAS PubMed.
- F. Turci, E. Peira, I. Corazzari, I. Fenoglio, M. Trotta and B. Fubini, Chem. Res. Toxicol., 2013, 26, 1579 CrossRef CAS PubMed.
- A. Jaroenworaluck, W. Sunsaneeyametha, N. Kosachan and R. Stevens, Surf. Interface Anal., 2006, 38, 473 CrossRef CAS.
- S. Li, S. Xu, L. He, F. Xu, Y. Wang and L. Zhang, Polym.-Plast. Technol. Eng., 2010, 49, 400–406 CrossRef CAS.
- S. Kumar and P. Maiti, RSC Adv., 2016, 6, 67449–67480 RSC.
- E. Yousif and R. Haddad, SpringerPlus, 2013, 2, 398 CrossRef PubMed.
- X. Zhao, Z. Li, Y. Chen, L. Shi and Y. Zhu, J. Mol. Catal. A: Chem., 2007, 268, 101–106 CrossRef CAS.
- Y. Liu and Y. Yang, J. Nanomater., 2016, 2016, 8123652 Search PubMed.
- J. Bai and B. Zhou, Chem. Rev., 2014, 114, 10131–10176 CrossRef CAS PubMed.
- R. Verma, V. B. Chaudhary, L. Nain and A. K. Srivastava, Mater. Tech., 2017, 32, 385–390 CrossRef CAS.
- C. Y. Flores, C. Diaz, A. Rubert, G. A. Benitez, M. S. Moreno, M. A. F. L. De Mele, R. C. Salvarezza, P. L. Schilardi and C. Vericat, J. Colloid Interface Sci., 2010, 350, 402 CrossRef CAS PubMed.
- J. F. Jacobs, L. V. de Poel and P. Osseweijer, Nanoethics, 2010, 4, 103–113 CrossRef PubMed.
- J. M. Davis, T. C. Long, J. A. Shatkin and A. Wang, Nanomaterials Case Studies: Nanoscale Titanium Dioxide in Water Treatment and in Topical Sunscreen, Draft Agency, E. P., Research Triangle Park, NC, 2009 Search PubMed.
- P. Prasannalakshmia, N. Shanmugama, A. Senthil Kumarb and N. Kannadasan, J. Electroanal. Chem., 2016, 775, 356–363 CrossRef.
- R. Kaegi, A. Ulrich, B. Sinnet, R. Vonbank, A. Wichser, S. Zuleeg, H. Simmler, S. Brunner, H. Vonmont, M. Burkhardt and M. Boller, Environ. Pollut., 2008, 156, 233–239 CrossRef CAS PubMed.
- A. Weir, P. Westerhoff, L. Fabricius and N. V. Goetz, Environ. Sci. Technol., 2012, 46, 2242–2250 CrossRef CAS PubMed.
- X. Li, Y. Zhang, T. Li, Q. Zhong, H. Li and J. Huang, J. Power Sources, 2014, 268, 372–378 CrossRef CAS.
- J. Jin, S. Z. Huang and J. Liu, et al., J. Mater. Chem. A, 2014, 2, 9699–9708 CAS.
- K. Liu, M. Cao, A. Fujishima and L. Jiang, Chem. Rev., 2014, 114, 7740 CrossRef PubMed.
- ICIS Titanium Dioxide Uses and Market, http://www.icis.com/Articles/2007/11/07/9076546/titanium-dioxide-tio2-uses-and-market-data.html, 1st June 2011.
- N. Pradhan, S. Singh, N. Ojha, A. Shrivastava, A. Barla, V. Rai and S. Bose, BioMed Res. Int., 2015, 2015, 365672 Search PubMed.
- K. A. Abbas, A. M. Saleh, A. Mohamed and N. MohdAzhan, J. Food, Agric. Environ., 2009, 7, 14–17 CAS.
- M. C. E. Lomer, R. P. H. Thompson, J. Commisso, C. L. Keen and J. J. Powell, Analyst, 2000, 125, 2339–2343 RSC.
- K. Liu, M. Cao, A. Fujishima and L. Jiang, Chem. Rev., 2014, 114, 10044–10094 CrossRef CAS PubMed.
- F. Gao, Q. Y. Lu and S. Komarneni, Chem. Mater., 2005, 17, 856 CrossRef CAS.
- G. Q. Tan, Y. Q. Zheng, H. Y. Miao, A. Xia, H. J. Ren and H. Hintzen, J. Am. Ceram. Soc., 2012, 95, 280 CrossRef CAS.
- Z. H. Ai, K. J. Deng, Q. F. Wan, L. Z. Zhang and S. C. Lee, J. Phys. Chem. C, 2010, 114, 6237 CAS.
- M. Larhed, C. Moberg and A. Hallberg, Acc. Chem. Res., 2002, 35, 717 CrossRef CAS PubMed.
- J. Du, L. R. Espelt, I. A. Guzei and T. P. Yoon, Chem. Sci., 2011, 2, 2115 RSC.
- Q. J. Xiang, J. G. Yu and M. Jaroniec, Chem. Soc. Rev., 2012, 41, 782 RSC.
- K. F. Zhou, Y. H. Zhu, X. L. Yang, X. Jiang and C. Z. Li, New J. Chem., 2011, 35, 353 RSC.
- J. T. Zhang, Z. G. Xiong and X. S. Zhao, J. Mater. Chem., 2011, 21, 3634 RSC.
- Q. Shen, W. Zhang, Z. P. Hao and L. D. Zou, Chem. Eng. J., 2010, 165, 301 CrossRef CAS.
- F. Y. Shen, W. X. Que, Y. L. Liao and X. T. Yin, Ind. Eng. Chem. Res., 2011, 50, 9131 CrossRef CAS.
- M. Y. Xing, Y. M. Wu, J. L. Zhang and F. Chen, Nanoscale, 2010, 2, 1233 RSC.
- V. Iliev, D. Tomova and S. Rakovsky, Desalination, 2010, 260, 101 CrossRef CAS.
- X. H. Peng, A. C. Santulli, E. Sutter and S. S. Wong, Chem. Sci., 2012, 3, 1262 RSC.
- Z. Ren, E. Kim, S. W. Pattinson, K. S. Subrahmanyam, C. N. R. Rao, A. K. Cheetham and D. Eder, Chem. Sci., 2012, 3, 209 RSC.
- N. Wang, T. Tachikawa and T. Majima, Chem. Sci., 2011, 2, 891 RSC.
- L. W. Zhang, H. Y. Cheng, R. L. Zong and Y. F. Zhu, J. Phys. Chem. C, 2009, 113, 2368 Search PubMed.
- J. T. Tian, L. J. Chen, Y. S. Yin, X. Wang, J. H. Dai, Z. B. Zhu, X. Y. Liu and P. W. Wu, Surf. Coat. Technol., 2009, 204, 205 CrossRef CAS.
- H. B. Fu, T. G. Xu, S. B. Zhu and Y. F. Zhu, Environ. Sci. Technol., 2008, 42, 8064 CrossRef CAS PubMed.
- L. A. Ghule, A. A. Patil, K. B. Sapnar, S. D. Dhole and K. M. Garadkar, Toxicol. Environ. Chem., 2011, 93, 623 CrossRef CAS.
- S. F. Chen, W. Zhao, S. J. Zhang and W. Liu, Chem. Eng. J., 2009, 148, 263 CrossRef.
- D. Lin, H. Wu, R. Zhang and W. Pan, Chem. Mater., 2009, 21, 3479 CrossRef CAS.
- M. Gratzel, Nature, 2001, 414, 338 CrossRef CAS PubMed.
- M. J. Zhou, Y. Hu, Y. Liu, W. L. Yang and H. S. Qian, CrystEngComm, 2012, 14, 7686 RSC.
- A. Kajbafvala, H. Ghorbani, A. Paravar, J. P. Samberg, E. Kajbafvala and S. K. Sadrnezhaad, Superlattices Microstruct., 2012, 51, 512 CrossRef CAS.
- L. Poul, S. Ammar, N. Jouini, F. Fieovet and F. Villain, Solid State Sci., 2001, 3, 31 CrossRef CAS.
- H. M. Kou, J. Wang, Y. B. Pan and J. K. Guo, Mater. Chem. Phys., 2006, 99, 325 CrossRef CAS.
- S. M. Wang, Z. S. Yang, M. K. Lu, Y. Y. Zhou, G. J. Zhou, Z. F. Qiu, S. F. Wang, H. P. Zhang and A. Y. Zhang, Mater. Lett., 2007, 61, 3005 CrossRef CAS.
- Y. Zhou and M. Antonietti, J. Am. Chem. Soc., 2003, 125, 14960 CrossRef CAS PubMed.
- J. J. Wu and C. C. Yu, J. Phys. Chem. B, 2004, 108, 3377 CrossRef CAS.
- S. Pavasupreea, S. Ngamsinlapasathiana, M. Nakajimaa, Y. Suzukia and S. Yoshikawa, J. Photochem. Photobiol., A, 2006, 184, 163–169 CrossRef.
- A. Al-Kattan, A. Wichser, S. Zuin, Y. Arroyo, L. Golanski, A. Ulrich and B. Nowack, Environ. Sci. Technol., 2014, 48, 6710–6718 CrossRef CAS PubMed.
- M. Cargnello, T. R. Gordon and C. B. Murray, Chem. Rev., 2014, 114, 9319 CrossRef CAS PubMed.
- D. D. Camillo, F. Ruggieri, S. Santucci and L. Lozzi, J. Phys. Chem. C, 2012, 116, 18427–18431 Search PubMed.
- J. Gangwar, K. K. Dey, P. Komal, S. K. Tripathi and A. K. Srivastava, Adv. Mater. Lett., 2011, 2, 402 CrossRef CAS.
- J. Gangwar, A. K. Srivastava, S. K. Tripathi, M. Wan and R. R. Yadav, Appl. Phys. Lett., 2014, 105, 063108 CrossRef.
- Ebelmen, Ann. Chim. Phys. Ser., 1846, 57, 319 Search PubMed.
- R. Sui and P. Charpentier, Chem. Rev., 2012, 112, 3057 CrossRef CAS PubMed.
- R. Verma, K. K. Naik, J. Gangwar and A. K. Srivastava, Mater. Chem. Phys., 2014, 148, 1064–1070 CrossRef CAS.
- N. Pinna and M. Niederberger, Angew. Chem., Int. Ed., 2008, 47, 5292 CrossRef CAS PubMed.
- D. Kundu, T. Manna and G. De, J. Sol-Gel Sci. Technol., 2002, 23, 145 CrossRef CAS.
- G. L. Teoh, K. Y. Liew and W. A. K. Mahmood, J. Sol-Gel Sci. Technol., 2007, 44, 177 CrossRef CAS.
- S. W. Bian, J. Baltrusaitis, P. Galhotra and V. H. Grassian, J. Mater. Chem., 2010, 20, 8705 RSC.
- K. K. Dey and A. K. Srivastava, in Oxide Nanostructures: Growth, Microstructures, and Properties, ed. A. K. Srivastava, Pan Stanford Publishing, 2014, vol. 1, pp. 1–98, ISBN-13: 978-9814411356 Search PubMed.
- R. S. Devan, R. A. Patil, J. H. Lin and Y. R. Ma, Adv. Funct. Mater., 2012, 22, 3326 CrossRef CAS.
- Y. Qi, H. Qi, C. Lu, Y. Yang and Y. Zhao, J. Mater. Sci.: Mater. Electron., 2009, 20, 479 CrossRef CAS.
- G. Zhu, C. Xi, H. Xu, D. Zheng, Y. Liu, X. Xu and X. Shen, RSC Adv., 2012, 2, 4236 RSC.
- M. A. Shah, Nanoscale Res. Lett., 2008, 3, 255 CrossRef CAS.
- L. Liu, Y. Li, S. Yuan, M. Ge, M. Ren, C. Sun and Z. Zhou, J. Phys. Chem. C, 2010, 114, 251 CAS.
- W. L. Suchanek, J. M. Garcés, P. F. Fulvio and M. Jaroniec, Chem. Mater., 2010, 22, 6564 CrossRef CAS.
- W. L. Suchanek and J. M. Garcés, CrystEngComm, 2010, 12, 2996 RSC.
- L. Yan, J. Zhuang, X. Sun, Z. Deng and Y. Li, Mater. Chem. Phys., 2002, 76, 119 CrossRef CAS.
- W. Zhu, L. Zhang, G. L. Tian, R. Wang, H. Zhang, X. Piao and Q. Zhang, CrystEngComm, 2014, 16, 308 RSC.
- L. X. Yang, Y. J. Zhu, H. Tong, Z. H. Liang and W. W. Wang, Cryst. Growth Des., 2007, 7, 2716 CAS.
- L. Dong, Y. Chu and W. Sun, Chem.–Eur. J., 2008, 14, 5064 CrossRef CAS PubMed.
- Y. Y. Xi, D. Li, A. B. Djurišić, M. H. Xie, K. Y. K. Man and W. K. Chan, Electrochem. Solid-State Lett., 2008, 11, D56 CrossRef CAS.
- L. Lepleux, B. Chavillon, Y. Pellegrin, E. Blart, L. Cario, S. Jobic and F. Odobel, Inorg. Chem., 2009, 48, 8245 CrossRef CAS PubMed.
- B. Zhao, X. K. Ke, J. H. Bao, C. L. Wang, L. Dong, Y. W. Chen and H. L. Chen, J. Phys. Chem. C, 2009, 113, 14440 CAS.
- X. Zhang, W. Shi, J. Zhu, W. Zhao, J. Ma, S. Mhaisalkar, T. L. Maria, Y. Yang, H. Zhang, H. H. Hng and Q. Yan, Nano Res., 2010, 3, 643 CrossRef CAS.
- S. Shang, K. Xue, D. Chen and X. Jiao, CrystEngComm, 2011, 13, 5094 RSC.
- H. Gao, F. Xiao, C. B. Ching and H. Duan, ACS Appl. Mater. Interfaces, 2012, 4, 2801 CAS.
- J. Yang, S. Mei and J. M. F. Ferreira, Mater. Sci. Eng., C, 2001, 15, 183 CrossRef.
- C. Burda, X. Chen, R. Narayanan and M. A. El-Sayed, Chem. Rev., 2005, 105, 1025 CrossRef CAS PubMed.
- A. Pottier, C. Chanéac, E. Tronc, L. Mazerolles and J. P. Jolivet, J. Mater. Chem., 2001, 11, 1116–1121 RSC.
- M. Wu, G. Lin, D. Chen, G. Wang and D. He, et al., Mater. Chem., 2002, 14, 1974 CrossRef CAS.
- J. Gangwar, B. K. Gupta, S. K. Tripathi and A. K. Srivastava, Nanoscale, 2015, 7, 13313 RSC.
- J. L. Gole, J. D. Stout, C. Burda, Y. B. Lou and X. B. Chen, J. Phys. Chem. B, 2004, 108, 1230–1240 CrossRef CAS.
- M. Iwase, K. Yamada, T. Kurisaki, O. O. Prieto-Mahaney, B. Ohtani and H. Wakita, Appl. Catal., B, 2013, 132, 39–44 CrossRef.
- Y. K. Lai, L. Sun, Y. C. Chen, H. F. Zhuang, C. J. Lin and J. W. Chin, J. Electrochem. Soc., 2006, 153, D123–D127 CrossRef CAS.
- D. Li, H. Haneda, S. Hishita and N. Ohashi, Chem. Mater., 2005, 17, 2596–2602 CrossRef CAS.
- S. Sato, R. Nakamura and S. Abe, Appl. Catal., A, 2005, 284, 131–137 CrossRef CAS.
- L. Sun, J. Li, C. L. Wang, S. F. Li, Y. K. Lai, H. B. Chen and C. J. Lin, J. Hazard. Mater., 2009, 171, 1045–1050 CrossRef CAS PubMed.
- C. C. Yec and H. C. Zeng, J. Mater. Chem. A, 2014, 2, 4843 CAS.
- M. Wang, L. Sun, Z. Lin, J. Cai, K. Xie and C. Lin, Energy Environ. Sci., 2013, 6, 1211–1220 CAS.
- Q. Wu, J. J. Ouyang, K. P. Xiea, L. Sun, M. Y. Wang and C. J. Lin, J. Hazard. Mater., 2012, 199, 410–417 CrossRef PubMed.
- Y. Ohno, K. Tomita, Y. Komatsubara, T. Taniguchi, K. Katsumata, N. Matsushita, T. Kogure and K. Okada, Cryst. Growth Des., 2011, 11, 4831–4836 CAS.
- S. Hu, M. R. Shaner, J. A. Beardslee, M. Lichterman, B. S. Brunschwig and N. S. Lewis, Science, 2014, 344, 1005 CrossRef CAS PubMed.
- H. Zhang and J. F. Banfield, Chem. Rev., 2014, 114, 9613–9644 CrossRef CAS PubMed.
- K. Lee, A. Mazare and P. Schmuki, Chem. Rev., 2014, 114, 9385–9454 CrossRef CAS PubMed.
- T. Froschl, U. Hormann, P. Kubiak, G. Kucherova, M. Pfanzelt, C. K. Weiss, R. J. Behm, N. Husing, U. Kaiser, K. Landfester and M. Wohlfahrt-Mehrenes, Chem. Soc. Rev., 2012, 41, 5313 RSC.
- M. Gopal, W. J. Moberlychan and L. C. De Jonghe, J. Mater. Sci., 1997, 32, 6001–6008 CrossRef CAS.
- K. Fujita, J. Konishi, K. Nakanishi and K. Hirao, Appl. Phys. Lett., 2004, 85, 5595 CrossRef CAS.
- A. Wypych, I. Bobowska, M. Tracz, A. Opasinska, S. Kadlubowski, A. K. Kaliszewska, J. Grobelny and P. Wojciechowski, J. Nanomater., 2014, 124814 Search PubMed.
- D. Komaraiah, P. Madhukar, Y. Vijayakumar, M. V. R. Reddy and R. Sayanna, Mater. Today, 2016, 3, 3770–3778 CrossRef.
- J. L. Mi, C. Clausen, M. Bremholm, N. Lock, K. M. Ø. Jensen, M. Christensen and B. B. Iversen, Cryst. Growth Des., 2012, 12, 6092–6097 CAS.
- Y. Qu, C. Sun, G. Sun, X. Kong and W. Zhang, Results Phys., 2016, 6, 100–106 CrossRef.
- S. S. Watson, D. Beydoun, J. A. Scott and R. Amal, Chem. Eng. J., 2003, 95, 213–220 CrossRef CAS.
- S. Patra, C. Davoisne, H. Bouyanfif, D. Foix and F. Sauvage, Sci. Rep., 2015, 5, 10928 CrossRef CAS PubMed.
- W. Hu, L. Li, G. Li, Y. Liu and R. L. Withers, Sci. Rep., 2014, 4, 6582 CrossRef CAS PubMed.
- D. A. H. Hanaor and C. C. Sorrell, J. Mater. Sci., 2011, 46, 855 CrossRef CAS.
- J.-G. Li, T. Ishigaki and X. Sun, J. Phys. Chem. C, 2007, 111, 4969 CAS.
- K. Bourikas, C. Kordulis and A. Lycourghiotis, Chem. Rev., 2014, 114, 9754–9823 CrossRef CAS PubMed.
- K. K. Dey, P. Kumar, R. R. Yadav, A. Dhar and A. K. Srivastava, RSC Adv., 2014, 4, 10123 RSC.
- S. Wang, Y. Ding, S. Xu, Y. Zhang, G. Li, L. Hu and S. Dai, Chem.–Eur. J., 2014, 20, 4916–4920 CrossRef CAS PubMed.
- H. Yaghoubi, N. Taghavinia, E. K. Alamdari and A. A. Volinsky, ACS Appl. Mater. Interfaces, 2010, 9, 2629–2636 Search PubMed.
- R. Menzel, A. Duerrbeck, E. Liberti, H. C. Yau, D. McComb and M. S. P. Shaffer, Chem. Mater., 2013, 25, 2137–2145 CrossRef CAS.
- H. Ming, Z. Ma, H. Huang, S. Lian, H. Li, X. He, H. Yu, K. Pan, Y. Liu and Z. Kang, Chem. Commun., 2011, 47, 8025–8027 RSC.
- Z. R. Tian, J. A. Voigt, J. Liu, B. McKenzie and H. Xu, J. Am. Chem. Soc., 2003, 125, 12384 CrossRef CAS PubMed.
- J. Zeng, R. Li, S. Liu and L. Zhang, ACS Appl. Mater. Interfaces, 2011, 3, 2074–2079 CAS.
- R.-C. Wang, C.-C. Hsu and S.-J. Chen, Ind. Eng. Chem. Res., 2012, 51, 3677–3681 CrossRef CAS.
- P. C. Shih, J. D. Peng, C. P. Lee, R. Y. Y. Lin, T. C. Chu, R. Vittal and K. C. Ho, ChemElectroChem, 2014, 1, 532–535 CrossRef.
- F. U. Rehman, C. Zhao, H. Jiang, M. Selke and X. Wang, Photodiagn. Photodyn. Ther., 2016, 13, 267–275 CrossRef CAS PubMed.
- C. Zhao, F. U. Rehman, Y. Yang, X. Li, D. Zhang, H. Jiang, M. Selke, X. Wang and C. Liu, Sci. Rep., 2015, 5, 11518 CrossRef PubMed.
- M. H. Yang, P. C. Chen, M. C. Tsai, T. T. Chen, I. C. Chang, H. T. Chiu and C. Y. Lee, CrystEngComm, 2014, 16, 441 RSC.
- Y. Yamaguchi, T. Shimodo, S. Usuki, K. Torigoe, C. Terashima, K. Katsumata, M. Ikekita, A. Fujishima, H. Sakaia and K. Nakata, Photochem. Photobiol. Sci., 2016, 15, 988 CAS.
- W. Sun, H. Liu, J. Hu and J. Li, RSC Adv., 2015, 5, 513–520 RSC.
- C. Song, L. Wang, F. Gao and Q. Lu, Chem, 2016, 22, 6368–6373 CrossRef CAS PubMed.
- P. Singh, O. P. Sinha, R. Srivastava, A. K. Srivastava, J. K. Bindra, R. P. Singh and M. N. Kamalasanan, Mater. Chem. Phys., 2012, 133, 317 CrossRef CAS.
- S. Karuppuchamy and J. M. Jeong, Mater. Chem. Phys., 2005, 93, 251–254 CrossRef CAS.
- V. K. Yemmireddy, G. D. Farrell and Y. C. Hung, J. Food Sci., 2015, 80, N1903–N1911 CrossRef CAS PubMed.
- L. Wensheng, J. C. Chang and S. T. Lee, Nano Lett., 2008, 8, 104–109 CrossRef PubMed.
- S. Karmakar, S. Kumar, R. Rinaldi and G. Maruccio, J. Phys.: Conf. Ser., 2011, 292, 012002 CrossRef.
- S. S. Lucky, K. C. Soo and Y. Zhang, Chem. Rev., 2015, 115, 1990–2042 CrossRef CAS PubMed.
- D. K. Chatterjee, L. S. Fong and Y. Zhang, Adv. Drug Delivery Rev., 2008, 60, 1627–1637 CrossRef CAS PubMed.
- A. B. Chinen, C. M. Guan, J. R. Ferrer, S. N. Barnaby, T. J. Merkel and C. A. Mirkin, Chem. Rev., 2015, 115, 10530–10574 CrossRef CAS PubMed.
- J. Schneider, M. Matsuoka, M. Takeuchi, J. Zhang, Y. Horiuchi, M. Anpo and D. W. Bahnemann, Chem. Rev., 2014, 114, 9919–9986 CrossRef CAS PubMed.
- A. Kubacka, M. S. Diez, D. Rojo, R. Bargiela, S. Ciordia, I. Zapico, J. P. Albar, C. Barbas, V. A. P. M. dos Santos, M. F. García and M. Ferrer, Sci. Rep., 2014, 4, 4134 CrossRef PubMed.
- M. A. Vargas and J. E. R. Páez, J. Non-Cryst. Solids, 2017, 459, 192–205 CrossRef CAS.
- N. Marwaha, B. K. Gupta, R. Verma and A. K. Srivastava, J. Mater. Sci., 2017, 52, 10480–10484 CrossRef CAS.
- F. Todescato, I. Fortunati, A. Minotto, R. Signorini, J. J. Jasieniak and R. Bozio, Materials, 2016, 9, 672 CrossRef PubMed.
- A. C. Fischer, F. Forsberg, M. Lapisa, S. J. Bleiker, G. Stemme, N. Roxhed and F. Niklaus, Microsyst. Nanoeng., 2015, 1, 15005 CrossRef.
- G. Chen, I. Roy, C. Yang and P. N. Prasad, Chem. Rev., 2016, 116, 2826–2885 CrossRef CAS PubMed.
- J. Yao, M. Yang and Y. Duan, Chem. Rev., 2014, 114, 6130–6178 CrossRef CAS PubMed.
- N. Puri, S. K. Mishra, A. Niazi, A. K. Srivastava and Rajesh, J. Chem. Technol. Biotechnol., 2015, 90, 1699–1706 CrossRef CAS.
- S. K. Mishra, A. K. Srivastava, D. Kumar, A. M. Biradar and Rajesh, Nanoscale, 2013, 5, 10494–10503 RSC.
- D. Prasai, J. C. Tuberquia, R. R. Harl, G. K. Jennings and K. I. Bolotin, ACS Nano, 2012, 6, 1102–1108 CrossRef CAS PubMed.
- M. J. Nine, M. A. Cole, D. N. H. Trana and D. Losic, J. Mater. Chem. A, 2015, 3, 12580–12602 CAS.
- S. S. Nanda, D. K. Yi and K. Kim, Sci. Rep., 2016, 6, 28443 CrossRef CAS PubMed.
- H. Ji, H. Sun and X. Qu, Adv. Drug Delivery Rev., 2016, 105, 176–189 CrossRef CAS PubMed.
- S. Yavuz, C. Kuru, D. Choi, A. Kargar, S. Jina and P. R. Bandaru, Nanoscale, 2016, 8, 6473–6478 RSC.
- X. Jiang, Y. Cao, K. Wang, J. Wei, D. Wu and H. Zhu, Surf. Coat. Technol., 2015, 261, 327–330 CrossRef CAS.
- K. O. Park, J. H. Lee, J. H. Park, Y. C. Shin, J. B. Huh, J. H. Bae, S. H. Kang, S. W. Hong, B. Kim, D. J. Ayng, D. W. Han and J. H. Yeum, Appl. Spectrosc. Rev., 2016, 51, 540 CrossRef CAS.
- S. R. Shin, H. L. Jang, P. Khoshakhlagh, M. Akbari, A. Nasajpour, Y. S. Zhang, A. Tamayol and A. Khademhosseini, Adv. Drug Delivery Rev., 2016, 105, 255–274 CrossRef CAS PubMed.
- S. Kumar and K. Chatterjee, ACS Appl. Mater. Interfaces, 2016, 8, 26431–26457 CAS.
- L. Wang and T. Sasaki, Chem. Rev., 2014, 114, 9455–9486 CrossRef CAS PubMed.
- E. Ertekin, L. K. Wagner and J. C. Grossman, Phys. Rev. B: Condens. Matter, 2013, 87, 155210 CrossRef.
- D. Jassby, J. F. Budarz and M. Wiesner, Environ. Sci. Technol., 2012, 46, 6934–6941 CrossRef CAS PubMed.
- L. Pan, X. Liu, Z. Suna and C. Q. Sun, J. Mater. Chem. A, 2013, 1, 8299 CAS.
- W. He, H. Jia, J. Cai, X. Han, Z. Zheng, W. G. Wamer and J. J. Yin, J. Phys. Chem. C, 2016, 120, 3187–3195 CAS.
- A. A. Alfadda and R. M. Sallam, J. Biomed. Biotechnol., 2012, 2012, 936486 Search PubMed.
- S. H. Lee, M. K. Gupta, J. B. Bang, H. Bae and H. J. Sung, Adv. Healthcare Mater., 2013, 2, 908–915 CrossRef CAS PubMed.
- E. L. Cates, Environ. Sci. Technol., 2017, 51, 757–758 CrossRef CAS PubMed.
- J. Zhao and X. Yang, Build. Environ., 2003, 38, 645–654 CrossRef.
- Y. Yu, T. He, L. Guo, Y. Yang, L. Guo, Y. Tang and Y. Cao, Sci. Rep., 2015, 5, 9561 CrossRef CAS PubMed.
- L. Yuan, C. Han, M. Pagliaro and Y. J. Xu, J. Phys. Chem. C, 2016, 120, 265–273 CAS.
- W. Kim, T. Tachikawa, T. Majima and W. Cho, J. Phys. Chem. C, 2009, 113, 10603–10609 CAS.
- G. P. Fotou, T. T. Kodas and B. Anderson, Aerosol Sci. Technol., 2000, 33, 557–571 CrossRef CAS.
- M. M. Momeni and Y. Ghayeb, Ceram. Int., 2016, 42, 7014–7022 CrossRef CAS.
- Y. Takahashi, P. Ngaotrakanwiwat and T. Tatsuma, Electrochim. Acta, 2004, 49, 2025–2029 CrossRef CAS.
- T. K. Kim, M. N. Lee, S. H. Lee, Y. C. Park, C. K. Jung and J. H. Boo, Thin Solid Films, 2005, 475, 171 CrossRef CAS.
- X. Fu, L. A. Clark, Q. Yang and M. A. Anderson, Environ. Sci. Technol., 1996, 30, 647 CrossRef CAS.
- A. Pietroiusti, Nanoscale, 2012, 4, 1231 RSC.
- L. Shang, K. Nienhaus and G. U. Nienhaus, J. Nanobiotechnol., 2014, 12, 5 CrossRef PubMed.
- A. M. Holmes, Z. Song, H. R. Moghimi and M. S. Roberts, ACS Nano, 2016, 10, 1810–1814 CrossRef CAS PubMed.
- M. Schneider, F. Stracke, S. Hansen and U. F. Schaefer, Derm.-Endocrinol., 2009, 1, 197–206 CrossRef CAS.
- D. Wang, Z. Lin, T. Wang, Z. Yao, M. Qin, S. Zheng and W. Lu, J. Hazard. Mater., 2016, 308, 328–334 CrossRef CAS PubMed.
- H. Zhang, Z. Ji, T. Xia, H. Meng, C. Low-Kam, R. Liu, S. Pokhrel, S. Lin, X. Wang and Y.-P. Liao, ACS Nano, 2012, 6, 4349–4368 CrossRef CAS PubMed.
- M. Pandurangan and D. H. Kim, J. Nanopart. Res., 2015, 17, 1–8 CrossRef CAS.
- L. C. Wehmas, C. Anders, J. Chess, A. Punnoose, C. B. Pereira, J. A. Greenwood and R. L. Tanguay, Toxicol. Rep., 2015, 2, 702–715 CrossRef CAS PubMed.
- G. Applerot, A. Lipovsky, R. Dror, N. Perkas, Y. Nitzan, R. Lubart and A. Gedanken, Adv. Funct. Mater., 2009, 19, 842–852 CrossRef CAS.
- Y. Xiao, M. G. Vijver, G. Chen and W. J. Peijnenburg, Environ. Sci. Technol., 2015, 49, 4657–4664 CrossRef CAS PubMed.
- A. E. Nel, L. Mädler, D. Velegol, T. Xia, E. M. V. Hoek, P. Somasundaran, F. Klaessig, V. Castranova and M. Thompson, Nat. Mater., 2009, 8, 543 CrossRef CAS PubMed.
- M. C. Moulton, L. K. B. Stolle, M. N. Nadagouda, S. Kunzelman, S. M. Hussain and R. S. Varma, Nanoscale, 2010, 2, 763 RSC.
- S. K. Misra, A. Dybowska, D. Berhanu, S. N. Luoma and E. Valsami-Jones, Sci. Total Environ., 2012, 438, 225–232 CrossRef CAS PubMed.
- S. D. Li and L. Huang, Mol. Pharmaceutics, 2008, 5, 496–504 CrossRef CAS PubMed.
- H. Arami, A. Khandhar, D. Liggitt and K. M. Krishnan, Chem. Soc. Rev., 2015, 44, 8576 RSC.
- H. Kang, S. Mintri, A. V. Menon, H. Y. Lee, H. S. Choi and J. Kim, Nanoscale, 2015, 7, 18848–18862 RSC.
- S. M. Moghimi, A. C. Hunter and T. L. Andresen, Annu. Rev. Pharmacol. Toxicol., 2012, 52, 481–503 CrossRef CAS PubMed.
- S. E. Dunn, A. G. A. Coombes, M. C. Garnett, S. S. Davis, M. C. Davies and L. Illum, J. Controlled Release, 1997, 44, 65–76 CrossRef CAS.
- S. Sharifi, S. Behzadi, S. Laurent, M. L. Forrest, P. Stroeve and M. Mahmoudi, Chem. Soc. Rev., 2012, 41, 2323–2343 RSC.
- Z. Wang, C. Fang and M. Megharaj, ACS Sustainable Chem. Eng., 2014, 1022, 2 Search PubMed.
- D. E. Owens III and N. A. Peppas, Int. J. Pharm., 2006, 307, 93 CrossRef PubMed.
- A. E. Nel, L. Mädler, D. Velegol, T. Xia, E. M. V. Hoek, P. Somasundaran, F. Klaessig, V. Castranova and M. Thompson, Nat. Mater., 2009, 8, 543–557 CrossRef CAS PubMed.
- Q. Mu, G. Jiang, L. Chen, H. Zhou, D. Fourches, A. Tropsha and B. Yan, Chem. Rev., 2014, 114, 7740–7781 CrossRef CAS PubMed.
- C. Y. Tay, M. I. Setyawati, J. Xie, W. J. Parak and D. T. Leong, Adv. Funct. Mater., 2014, 24, 5936 CrossRef CAS.
- A. Fujishima and K. Honda, Nature, 1972, 238, 37–38 CrossRef CAS PubMed.
- X. Chen and A. Selloni, Chem. Rev., 2014, 114, 9281–9282 CrossRef CAS PubMed.
- G. Longoni, R. L. P. Cabrera, S. Polizzi, M. D'Arienzo, C. M. Mari, Y. Cui and R. Ruffo, Nano Lett., 2017, 17, 992–1000 CrossRef CAS PubMed.
- D. V. Potapenko, Z. Li and R. M. Osgood Jr, J. Phys. Chem. C, 2015, 119, 28946–28953 CAS.
- B. Zhao, F. Chen, Q. Huang and J. Zhang, Chem. Commun., 2009, 5115 RSC.
- C. T. Sousa, D. C. Leitao, M. P. Proenca, J. Ventura, A. M. Pereira and J. P. Araujo, Appl. Phys. Rev., 2014, 1, 031102 Search PubMed.
- Y. Wang and Y. Xia, Nano Lett., 2004, 4, 2047–2050 CrossRef CAS.
- E. Gazit, Chem. Soc. Rev., 2007, 36, 1263–1269 RSC.
- Y. Wan, Y. Shia and D. Zhao, Chem. Commun., 2007, 897–926 RSC.
- S. H. Cai, S. N. Rashkeev, S. T. Pantelides and K. Sohlberg, Phys. Rev. B: Condens. Matter, 2003, 67, 224104 CrossRef.
- V. L. Colvin, Nat. Biotechnol., 2003, 21, 1166 CrossRef CAS PubMed.
- R. Yuan, X. Fu, X. Wang, P. Liu, L. Wu, Y. Xu, X. Wang and Z. Wang, Chem. Mater., 2006, 18, 4700 CrossRef CAS.
- C. N. R. Rao, S. R. C. Vivekchand, K. Biswas and A. Govindaraj, Dalton Trans., 2007, 2007, 3728 RSC.
- A. I. Y. Tok, F. Y. C. Boey and X. L. Zhao, J. Mater. Process. Technol., 2006, 178, 270 CrossRef CAS.
- T. Fröschl, U. Hörmann, P. Kubiak, G. Kučerová, M. Pfanzelt, C. K. Weiss, R. J. Behm, N. Hüsing, U. Kaiser, K. Landfesterd and M. W. Mehrens, Chem. Soc. Rev., 2012, 41, 5313–5360 RSC.
- D. P. Macwan, P. N. Dave and S. Chaturvedi, J. Mater. Sci., 2011, 46, 3669–3686 CrossRef CAS.
- M. M. Byranvanda, A. N. Kharata, L. Fatholahib and Z. M. Beiranvand, J. Nanostruct., 2013, 3, 1–9 Search PubMed.
- I. Tacchini, A. Ansón-Casaos, Y. Yu, M. T. Martínez and M. L. Cantu, Mater. Sci. Eng., B, 2012, 177, 19–26 CrossRef CAS.
- H. A. Budiarti, R. N. Puspitasari, A. M. Hatta, Sekartedjo and D. D. Risanti, Procedia Eng., 2017, 170, 65 CrossRef CAS.
- H. Pan, X. D. Wang, S. S. Xiao, L. G. Yu and Z. J. Zhang, Indian J. Eng. Mater. Sci., 2013, 20, 561–567 CAS.
- J. Gangwar, B. K. Gupta, P. Kumar, S. K. Tripathi and A. K. Srivastava, Dalton Trans., 2014, 43, 17034 RSC.
- C. B. Murray, C. R. Kagan and M. G. Bawendi, Annu. Rev. Mater. Sci., 2000, 30, 545–610 CrossRef CAS.
- N. T. K. Thanh, N. Maclean and S. Mahiddine, Chem. Rev., 2014, 114, 7610 CrossRef CAS PubMed.
- K. Sabyrov, N. D. Burrows and R. L. Penn, Chem. Mater., 2013, 25, 1408–1415 CrossRef CAS.
- S. C. Zhu, S. H. Xie and Z. P. Liu, J. Am. Chem. Soc., 2015, 137, 11532 CrossRef CAS PubMed.
- J. Lee, J. Yang, S. G. Kwon and T. Hyeon, Nat. Rev. Mater., 2016, 16034 CrossRef CAS.
- D. Guan, C. Cai and Y. Wang, J. Nanosci. Nanotechnol., 2011, 11, 3641–3650 CrossRef CAS PubMed.
- K. Huo, H. Wang, X. Zhang, Y. Cao and P. K. Chu, ChemPlusChem, 2012, 77, 323–329 CrossRef CAS.
- C. Xue, T. Narushima, Y. Ishida, T. Tokunaga and T. Yonezawa, Chem. Lett., 2014, 43, 1514–1516 CrossRef CAS.
- D. H. Kim, W. M. Seong, I. J. Park, E. S. Yoo, S. S. Shin, J. S. Kim, H. S. Jung, S. Lee and K. S. Hong, Nanoscale, 2013, 5, 11725 RSC.
- B. Liu, A. Khare and E. S. Aydil, Chem. Commun., 2012, 48, 8565 RSC.
- Z. Sun, J. H. Kim, Y. Zhao, F. Bijarbooneh, V. Malgras, Y. Lee, Y. M. Kang and S. X. Dou, J. Am. Chem. Soc., 2011, 133, 19314 CrossRef CAS PubMed.
- M. V. Dozzi and E. Selli, Catalysts, 2013, 3, 455 CrossRef CAS.
- H. Li, Z. Bian, J. Zhu, D. Zhang, G. Li, Y. Huo, H. Li and Y. Lu, J. Am. Chem. Soc., 2007, 129, 8406 CrossRef CAS PubMed.
- J. Lu, P. Zhang, A. Li, F. Su, T. Wang, Y. Liu and J. Gong, Chem. Commun., 2013, 49, 5817–5819 RSC.
- R. Verma, B. Mantri, Ramphal and A. K. Srivastava, Adv. Mater. Lett., 2015, 6, 324 CrossRef CAS.
- K. Li, J. Xu, W. Shi, Y. Wang and T. Peng, J. Mater. Chem. A, 2014, 2, 1886 CAS.
- A. D. Paola, M. Bellardita and L. Palmisano, Catalysts, 2013, 3, 36 CrossRef.
- Q. Deng, M. Wei, X. Ding, L. Jiang, B. Ye and K. Wei, Chem. Commun., 2008, 3657 RSC.
- T. A. Kandiel, L. Robben, A. Alkaim and D. Bahnemann, Photochem. Photobiol. Sci., 2013, 12, 602 CAS.
- L. Zhanga, V. M. M. Floresa, N. Murakami and T. Ohno, Appl. Surf. Sci., 2012, 258, 5803 CrossRef.
- H. Zhao, L. Liu, J. M. Andinobc and Y. Li, J. Mater. Chem. A, 2013, 1, 8209 CAS.
- T. Y. Ke, P. C. Chen, M. H. Yang, H. T. Chiuc and C. Y. Lee, CrystEngComm, 2011, 13, 5292 RSC.
- J. Lin, Y. U. Heo, A. Nattestad, Z. Sun, L. Wang, J. H. Kim and S. X. Dou, Sci. Rep., 2014, 4, 5769 CrossRef PubMed.
- D. F. Rohlfing, A. Zaleska and T. Bein, Chem. Rev., 2014, 114, 9487–9558 CrossRef PubMed.
- M. Yu, X. Ren, L. Ma and Y. Wu, Nat. Commun., 2014, 5, 5111 CrossRef CAS PubMed.
- D. Sarkar, C. K. Ghosh and K. K. Chattopadhyay, CrystEngComm, 2012, 14, 2683 RSC.
- T. Ohno, K. Sarukawa and M. Matsumura, New J. Chem., 2002, 26, 1167 RSC.
- D. Zhang, G. Li, F. Wanga and J. C. Yu, CrystEngComm, 2010, 12, 1759 RSC.
- D. R. Coronado, G. R. Gattorno, M. E. E. Pesqueira, C. Cab, R. deCoss and G. Oskam, Nanotechnology, 2008, 19, 145605 CrossRef PubMed.
- Z. Zhao, J. Tian, Y. Sang, A. Cabot and H. Liu, Adv. Mater., 2015, 27, 2557–2582 CrossRef CAS PubMed.
- B. Liu, A. Khare and E. S. Aydil, Chem. Commun., 2012, 48, 8565 RSC.
- H. G. Yang, G. Liu, S. Z. Qiao, C. H. Sun, Y. G. Jin, S. C. Smith, J. Zou, H. M. Cheng and G. Q. (Max) Lu, J. Am. Chem. Soc., 2009, 131, 4078–4083 CrossRef CAS PubMed.
- M. Choi, J. H. Lee, Y. J. Jang, D. Kim, J. S. Lee, H. M. Jang and K. Yong, Sci. Rep., 2016, 6, 36099 CrossRef CAS PubMed.
- M. H. Tsai, S. Y. Chen and P. Shen, Nano Lett., 2004, 4, 1197–1201 CrossRef CAS.
- M. Rezaee, S. M. M. Khoie and K. H. Liu, CrystEngComm, 2011, 13, 5055 RSC.
- B. Choudhary and A. Choudhary, Int. Nano Lett., 2013, 3, 55 CrossRef.
- J. Zhang, M. Li, Z. Feng, J. Chen and C. Li, J. Phys. Chem. B, 2006, 110, 927 CrossRef CAS PubMed.
- H. C. Choi, Y. M. Jung and S. B. Kim, Vib. Spectrosc., 2005, 37, 33 CrossRef CAS.
- S. Hu, F. Li and Z. Fan, Bull. Korean Chem. Soc., 1895, 2012, 33 Search PubMed.
- J. Das, F. S. Freitas, I. R. Evans, A. F. Nogueira and D. Khushalani, J. Mater. Chem., 2010, 20, 4425 RSC.
- Z. Yanqing, S. Erwei, C. Suxian, L. Wenjun and H. Xingfang, J. Mater. Sci. Lett., 2000, 19, 1445–1448 CrossRef CAS.
- L. Pinho and M. J. Mosquera, J. Phys. Chem. C, 2011, 115, 22851–22862 CAS.
- H. N. Graham, Prev. Med., 1992, 21, 334 CrossRef CAS PubMed.
- S. P. J. N. Senanayake, J. Funct. Foods, 2013, 5, 1529 CrossRef.
- D. A. Balentine, S. A. Wiseman and L. C. Bouwens, Crit. Rev. Food Sci. Nutr., 1997, 37, 693 CrossRef CAS PubMed.
- L. Xiao, M. Mertens, L. Wortmann, S. Kremer, M. Valldor, T. Lammers, F. Kiessling and S. Mathur, ACS Appl. Mater. Interfaces, 2015, 7, 6530–6540 CAS.
- Canadian Food Inspection Agency, Guide to Food Labelling and Advertising, 2010 Search PubMed.
- J. B. Birks, Photophysics of Aromatic Molecules, Wiley-Interscience, London, 1970 Search PubMed.
- C. Chen, J. Liu, P. Liu and B. Yu, Adv. Chem. Eng. Sci., 2011, 1, 9–14 CrossRef CAS.
- Y. Yang, G. Wang, Q. Deng, D. H. L. Ng and H. Zhao, ACS Appl. Mater. Interfaces, 2014, 6, 3008–3015 CAS.
- P. Singh, O. P. Sinha, R. Srivastava, A. K. Srivastava, J. K. Bindra, R. P. Singh and M. N. Kamalasanan, Mater. Chem. Phys., 2012, 133, 317–323 CrossRef CAS.
- M. H. Lee, U. M. Patil, S. T. Kochuveedu, C. S. Lee and D. H. Kim, Bull. Korean Chem. Soc., 2012, 33, 3767–3771 CrossRef CAS.
- U. Soni, P. Tripathy and S. Sapra, J. Phys. Chem. Lett., 2014, 5, 1909–1916 CrossRef CAS PubMed.
- V. Etacheri, R. Roshan and V. Kumar, ACS Appl. Mater. Interfaces, 2012, 4, 2717–2725 CAS.
- J. G. Cappuccino and N. Sherman, Microbiology: a laboratory manual, Benjamin Cummings, California, CA, 1999, 10th edn, p. 471 Search PubMed.
- J. G. Holt, N. R. Krieg and P. H. A. Sneath, et al., Bergey's manual of determinative bacteriology, Lippincott Williams & Wilkins, Baltimore, MD, 9th edn, 1994, p. 787 Search PubMed.
- C. M. Kunin and C. Steele, J. Clin. Microbiol., 1985, 21, 902–908 CAS.
- J. Beranova, G. Seydlova and H. Kozak, et al., FEMS Microbiol. Lett., 2014, 351, 179–186 CrossRef CAS PubMed.
- S. J. Parikh and J. Chorover, Langmuir, 2006, 22, 8492–8500 CrossRef CAS PubMed.
- B. Girase, D. Depan and J. S. Shah, et al., Mater. Sci. Eng., C, 2011, 31, 1759–1766 CrossRef CAS.
- J. Gangwar, J. Kim, A. Kumar, D. Bhatnagar, K. Senthil, S. K. Tripathi, K. Yong and A. K. Srivastava, Nanosci. Nanotechnol. Lett., 2013, 5, 67 CrossRef CAS.
- J. Gangwar, A. Chandran, T. Joshi, R. Verma, A. M. Biradar, S. K. Tripathi, B. K. Gupta and A. K. Srivastava, Mater. Res. Express, 2015, 2, 075013 CrossRef.
- J. S. Tawale, K. K. Dey, R. Pasricha, K. N. Sood and A. K. Srivastava, Thin Solid Films, 2010, 519, 1244–1247 CrossRef CAS.
- N. Jain, N. Marwaha, R. Verma, B. K. Gupta and A. K. Srivastava, RSC Adv., 2016, 6, 4960 RSC.
- N. T. K. Thanh, N. Maclean and S. Mahiddine, Chem. Rev., 2014, 114, 7610–7630 CrossRef CAS PubMed.
- B. Stein, D. Zopes, M. Schmudde, R. Schneider, A. Mohsen, C. Goroncy, S. Mathur and C. Graf, Faraday Discuss., 2015, 181, 85–102 RSC.
- P. Junlabhut and P. Nuthongkum, Thai J. Nanosci. Nanotechnol., 2016, 1, 1–7 Search PubMed.
- J. S. Lee, K. H. You and C. B. Park, Adv. Mater., 2012, 24, 1084–1088 CrossRef CAS PubMed.
- S. Pavasupreea, Y. Suzukia, S. Yoshikawaa and R. Kawahata, J. Solid State Chem., 2005, 178, 3110–3116 CrossRef.
- X. Peng and A. Chen, J. Mater. Chem., 2004, 14, 2542–2548 RSC.
- W. Q. Fang, J. Z. Zhou, J. Liu, Z. G. Chen, C. Yang, C. H. Sun, G. R. Qian, J. Zou, S. Z. Qiao and H. G. Yang, Chem.–Eur. J., 2011, 17, 1423–1427 CrossRef CAS PubMed.
|
| This journal is © The Royal Society of Chemistry 2017 |

 Open Access Article
 This Open Access Article is licensed under a Creative Commons Attribution-Non Commercial 3.0 Unported Licence
 *ab
*ab


