 Open Access Article
Creative Commons Attribution 3.0 Unported Licence
Ionic liquid assisted hydrothermal syntheses of Au doped TiO2 NPs for efficient visible-light photocatalytic hydrogen production from water, electrochemical detection and photochemical detoxification of hexavalent chromium (Cr6+)
T. N. Ravishankar *ab,
Mauricio de O. Vazb,
T. Ramakrishnappac,
Sergio R. Teixeirab and
J. Dupontd
aGlobal Academy of Technology, Rajarajeshwarinagar, (off Mysore Road), Ideal Homes Township, Bangalore-560098, Karnataka, India. E-mail: jaiguruji8789@gmail.com; ravishankar8789@gmail.com
bLaboratory of Thin Films and Nanostructure Fabrication (L3F nano), Institute of Physics, Universidade Federal do Rio Grande do Sul, UFRGS, Avenida Bento Goncalves 9500, P. O. Box 15051, 91501-970 Porto Alegre, RS, Brazil
cDayananda Sagar Academy of Technology and Management, Udayapura, Opp Art of Living, Kanakapura Road, Bangalore-560082, India
dDepartment of Sustainable Chemistry, School of Chemistry, University of Nottingham, Nottingham, UK
First published on 6th September 2017
Abstract
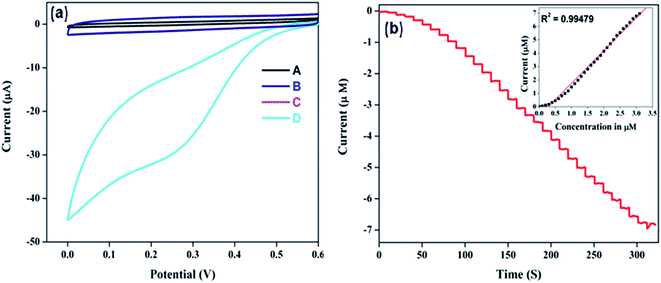
Au/TiO2 NPs have been successfully prepared at 130 °C in one day using an ionic liquid assisted hydrothermal method using methoxyethyl methyl imidazolium methanesulfonate as the ionic liquid, titanium(IV) isopropoxide and tetrachloroaurate(III) trihydrate as precursors. Physico-chemical properties of the obtained photocatalysts were investigated via thorough characterizations. The framework substitution of Au in TiO2 NPs was established by X-ray diffraction (XRD), X-ray photoelectron spectroscopy (XPS) and energy dispersive X-ray spectroscopy (EDS) techniques. X-ray diffraction (XRD) and transmission electron microscopy (TEM) image results confirmed the anatase phase and nanocrystalline nature of Au/TiO2. The optical properties revealed an extended tailing of the absorption edge toward the visible region upon Au doping. The concentration of Au in the TiO2 matrix has been fine-tuned to improve the hydrogen production, electrochemical detection and photochemical detoxification of hexavalent chromium (Cr6+). But there are no reports utilizing a single material for all three applications such as photocatalytic hydrogen production from water and photochemical as well as electrochemical reduction of Cr6+ to Cr3+. The synergy between the Au and TiO2 has an optimum for concentration of 0.5 wt% Au doped TiO2. The optimized product has produced promising hydrogen evolution of 3344 μmol g−1 under illumination with a visible light source in a water/ethanol system. The optimized product has shown promising electrocatalytic reduction and the photocatalytic detoxification ability of the material towards Cr6+ was explored. Amperometric studies showed a linear range from 0.1 to 2.7 mM, and limits of detection and quantification of 0.01 mM and 0.023 mM, respectively. The Au/TiO2 nanoparticle modified glassy carbon has been used for electrochemical monitoring of Cr6+ in natural water samples. The material also showed better photochemical reduction of Cr6+ in sunlight compared to UV light.
Introduction
The continual increase in world population and lifestyle standards has led to a sharp increase in global energy consumption. The conventionally used fossil fuels are costly and present environmental limitations so the efficient utilization of renewable energy sources is more urgent. In this regard, photocatalytical water splitting hydrogen production has been considered as having enormous potential for the sustainable development of society. Several semiconducting metal oxide NPs have been utilized for photocatalytical hydrogen production.1–3 Amongst these TiO2 has been widely used as a photocatalyst for hydrogen generation via water splitting because of its wideband gap (Eg = 3.2 eV), low-cost, non-toxicity and good oxidizing power.4 However, literature reports suggested that TiO2 has some practical limitations, for example bare TiO2 NPs are less efficient under near UV irradiation (4% of the solar spectrum) for effective photocatalysis and recombination of electron–hole pairs than doped TiO2 NPs Hence, its use as a photocatalysts for water splitting is limited due to its redox potential referring to the normal hydrogen electrode (NHE),5 A lot of studies have been made to increase the photocatalytic activity of titanium dioxide for the water splitting reaction. For this purpose, scientists are working on the synthesis of doped TiO2 NPs using various methods such as hydrothermal, ionic liquid assisted hydrothermal, sol–gel, co-precipitation, combustion and other strategies.6,7 Amongst these methods, the ionic liquid assisted hydrothermal method is considered the most prominent, as room temperature ionic liquids (RTILs) have received extensive attention from both academic and industrial researchers over the past two decades. RTILs possess unique properties such as negligible vapor pressure, a wide liquid temperature range, high thermal stability, and dissolubility in both organic and inorganic compounds, high ionic conductivity and a wide electrochemical window. An important aspect of the interaction of RTILs with nanoparticle precursors involves the nucleation and growth of the NPs.8 Metal dopants like Au, Ag, Al, Ce, Nd, Eu, Mo, and Fe as well as non-metal dopants like O, N, and S, have been used to enhance the photocatalytic activity of TiO2 NPs. Au is one of the most promising dopants which modifies the surface and crystalline structure of TiO2 and acts as electrons sink and minimizes the recombination of electron–hole pairs and making more carriers available for oxidation or reduction processes on the surface. Due to these properties, Au doped TiO2 NPs show an enhanced photocatalytic H2 generation via the water splitting reaction, electrochemical detection and photochemical detoxification of hexavalent chromium (Cr6+) compared to bare TiO2 NPs.As Cr6+ proved to be toxic, carcinogenic and mutagenic, the WHO has set 0.96 mM as the threshold limit in drinking water. So, it is very important to monitor its flux followed by detoxification in various environmental matrices.9 So many photochemical and electrochemical methods using Au/TiO2 particles are reported for detoxification and determination of Cr6+. But there are no reports utilizing a single material for all three applications such as photocatalytic hydrogen production from water and photochemical as well as electrochemical reduction of Cr6+ to Cr3+.
In this manuscript, we report the ionothermal synthesis of Au/TiO2 NPs and explore the possibility of utilizing the synthesized materials for photocatalytic hydrogen production from water, photochemical detoxification of Cr6+ to Cr3+ as well as for the electro catalytic reduction of Cr6+ to Cr3+. The catalytic electrochemical reduction is utilized in an amperometric detection of Cr6+ in various environmental effluents.
Experiment and methods
Chemicals and reagents
Titanium(IV) isopropoxide and tetrachloroaurate(III) trihydrate were purchased from Sigma Aldrich, sodium hydroxide (NaOH) was purchased from Merck, India. 1-(2-Methoxyethyl)-3-methylimidazolium methane sulfonate ionic liquid was prepared by previously developed method.10 Double distilled water was used throughout the experiments.Preparation of photocatalysts
For the syntheses of pristine TiO2 NPs (NPs), 5.5 mL of titanium(IV) isopropoxide, used as precursors. In first step, precursor was added separately in Teflon tube having 2.5 mL 1-(2-methoxyethyl)-3-methylimidazolium methane sulfonate as IL and 3.5 mL of 0.1 M NaOH solution as mineralizer. The system was left for homogenization under a constant stirring and after that; 8 mL of water was added for the hydrolysis to occur. Furthermore, the precipitate in Teflon tube was put into the stainless autoclave followed by hydrothermal treatment at 130 °C for one day. After the reaction, the system was cooled to room temperature naturally. In the second step, the obtained product was mixed with acetonitrile and stirred for overnight to remove the IL's residue. Finally, TiO2 NPs were retrieved from centrifugation; thereby, post calcinations step was followed at 300 °C for 1 h for both of the catalysts.The Au incorporated TiO2 NPs were prepared by following the similar procedures and post calcinations except for the first step once we mixed different concentrations (0.25, 0.5 and 0.75 wt%) of tetrachloroaurate(III) trihydrate with a fixed volume of titanium tetrachloride (5.5 mL).
Photocatalytic H2 production
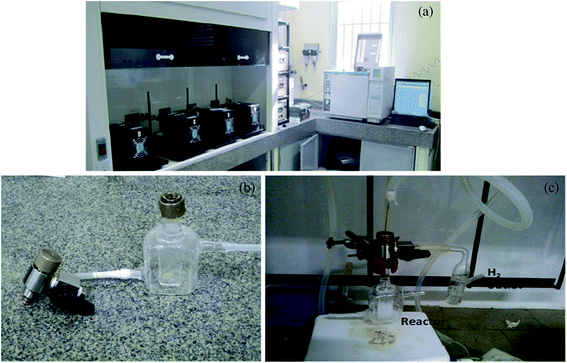
Photocatalytic activities were evaluated by measuring hydrogen production using gas chromatography at room temperature in water ethanol system. Photocatalytic H2 production reactions were carried out in a closed gas-circulating system as depicted in Fig. 1.11 The reaction was carried out in a closed gas circulating system in an inner irradiation type reactor. Different photocatalyts (10 mg) were sonicated for 20 min to disperse in 7.5 mL aqueous solution. After sonication, 2.5 mL ethanol was added as a sacrificial reagent. Prior to irradiation, the system was deaerated by bubbling argon for 10–15 min to reduce the oxygen content. During the entire experiment, the reaction temperature was kept at 25 °C by eliminating the contribution of IR radiation with the circulation of water in the outer jacket of the reactor. 240 W Hg-Xe arc lamp (Cermax) was used as the UV excitation source, A 300 W Xe arc lamp, with the incident photon flux I0 of 0.056176 or 0.078245 μmol cm−2 s−1, was focused through a shutter window and a 420 or 390 nm cut-off filter onto the window face of the cell was used as the visible light source. Analyses were conducted using Agilent 6820 GC Chromatograph equipped with a thermal conductivity detector (TCD) and a 5 Å molecular sieve packed column with argon as the carrier gas. Using a gastight syringe with a maximum volume of 50 μL, the amount of hydrogen produced was measured for 0.5 h intervals.Electrochemical monitoring of Cr6+ in aqueous samples
Amperometric measurements were performed in a stirred solution with an applied potential of 0.29 V. The electrolyte was deaerated with nitrogen gas for 30 min before each measurement. Aliquot of tap water was directly injected into the electrolyte (0.1 M HCl) for amperometric analysis of Cr6+ whereas the lake water samples were filtered using Whatman filter paper before analysis.
Characterization
Powder X-ray diffraction data was recorded on Philips X'pert PRO X-ray diffractometer with graphite monochromatized Cu-Kα (1.5418 Å) radiation operated at 40 kV and 30 mA. X-ray photo electron spectroscopy (XPS) analysis was carried out on an ESCALAB 250 (Thermo-VG Scientific), using Al Kα as the excitation source. The binding energy (BE) from the advantageous carbon (284.6 eV) was used to calibrate the spectra. The absorption spectra of the samples were measured by dispersing the NPs in water using Perkin Elmer Lambda-750 UV-Vis spectrometer. The morphology was examined using table top Hitachi 3000 scanning electron microscopy (SEM). The nanostructure of the product was observed by transmission electron microscopy (TEM) performed by JEOL JEM 1200 Ex operating at 100 kV. Samples for TEM were prepared by dropping the dispersion of 2-propanol metal oxide nanoparticle on a holey carbon grid and drying the grids under vacuum for 24 h. BET surface area i.e. N2 adsorption–desorption measurements of the samples were measured using Tristar II, Micromeritics. Electrochemical measurements were performed on a standard three-electrode electrochemical cell with a CHI 800 electrochemical workstation (CH Instrument, USA) with a Au/TiO2 NPs modified glassy carbon electrode as the working electrode, a platinum wire as the counter electrode and a saturated calomel electrode (SCE) as the reference electrode, respectively. All pH measurements were carried out using a digital pH meter MK VI of Systronics make.Results and discussion
XRD studies
XRD is mainly used to investigate the phase composition and crystallite size of prepared materials. The powder XRD patterns of the Au/TiO2 NPs prepared by homogenous hydrolysis of titanium(IV) isopropoxide are shown in Fig. 2. All of the patterns are indexed as a single phase of anatase and diffractograms are in good agreement with JCPDS no. 2-387, which clearly confirms the formation of TiO2, no diffraction peaks of other polymorphs of titania are observed. All of the NPs give similar patterns without any peak due to the doping of Au. Hence at these loadings, Au particles become uniformly dispersed and therefore do not have adequate dimensions to produce their characteristic patterns. The presence of Au content in TiO2 nano-crystalline structure influences the particle size, surface area, band gap energy and quantum yield of prepared photocatalysts.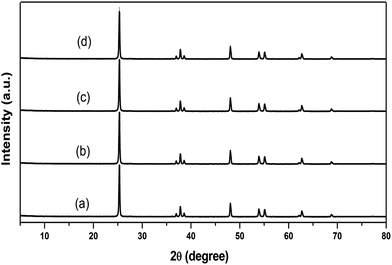 | ||
| Fig. 2 XRD patterns of (a) pristine TiO2 NPs, (b) 0.25, (c) 0.5 and (d) 0.75 wt% Au/TiO2 NPs. The samples were calcinated at 400 °C for 1 h. | ||
Crystallite size, BET surface area, band gap energy and quantum yield
The crystallite size, BET surface area, band gap energy and quantum yield for the pristine TiO2 NPs, 0.25, 0.5, and 0.75 wt% Au incorporated TiO2 NPs (Au/TiO2 NPs) were calculated and are shown in Table 1. It can be seen that the Au/TiO2 NPs present a higher surface area compared to the pristine TiO2 NPs. In addition, the 0.5 wt% Au/TiO2 NPs presents the highest surface area compared to all the other photocatalysts. Furthermore, comparing the quantum yields of the Au/TiO2 NPs and pristine nanomaterials, the Au/TiO2 NPs seem to be more attractive for photolysis compared to pristine NPs (Table 1). The optical properties were characterized at room temperature using a UV-Vis spectrophotometer in the wavelength range of 200–800 nm and the band gap energies of the NPs were calculated from diffused reflectance spectra using the Tauc plot function, and the results are indicated in Table 1.| Samples | Au content (wt%) | Crystalline size (nm) | BET surface area (m2 g−1) | Quantum yield | Band gap (eV) |
|---|---|---|---|---|---|
| TiO2 NPs | 0 | 30.3 for (101) | 34.1 | 0.22 | 3.31 |
| Au/TiO2 NPs | 0.25 | 35.3 for (101) | 38.6 | 0.38 | 2.7 |
| 0.5 | 36.7 for (101) | 52.7 | 0.51 | 2.10 | |
| 0.75 | 35.1 for (101) | 41.8 | 0.40 | 1.98 |
XPS studies
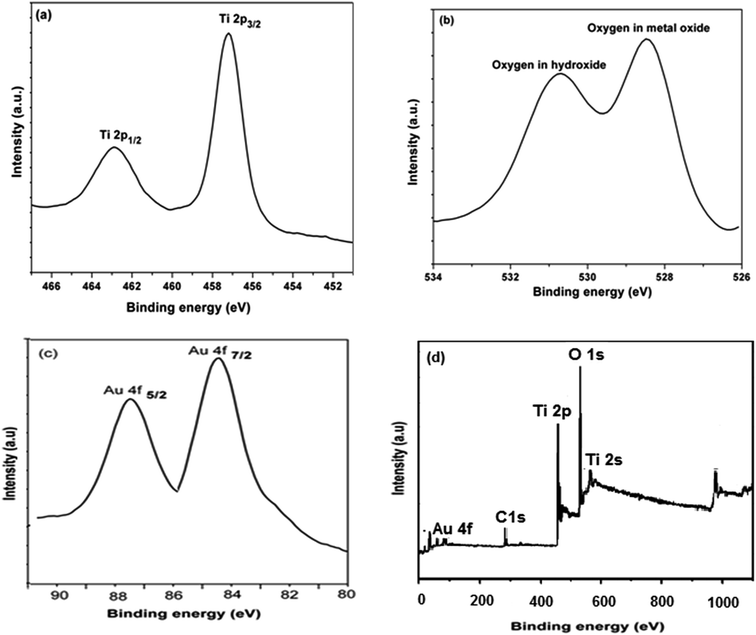
The surface chemical composition and the oxidation state for 0.5 wt% Au/TiO2 NPs sample is investigated by XPS measurements as shown in Fig. 3. From the survey spectrum (Fig. 3(d)) the presence of Ti, O and Au elements was recorded. From the Fig. 3(a) it is made clear that XPS measured at the Ti 2p core levels, the binding energies of 458.6 and 464.1 eV are indicative of Ti 2p3/2 and Ti 2p1/2 which correspond to Ti4+.7 In O 1s region (Fig. 3(b)) the peak centered at 529.6 eV is related to the oxygen in TiO2 lattice. However, the adjacent peak at 531.4 eV can be regarded as the presence of surface hydroxide species that were found to be advantageous for improved hydrogen generation.12 In Au 4f region (Fig. 3(c)), the binding energies for Au 4f7/2 and Au 4f5/2 are observed at ca. 84.1 and 87.5 eV, respectively this indicates that the presence of metallic state Au in TiO2 lattice structure.13Photocatalytic water splitting hydrogen evolution
The pristine TiO2 NPs and Au/TiO2 NPs were subsequently applied for hydrogen evolution in water–ethanol system. Fig. 4 compares the gas chromatography results of the photocatalysts. It can be seen that the pristine NPs prepared in the current study have shown enhanced photoactivity compared to the commercially available powders that highlights the importance of the RTILs synthesis route. Furthermore, the photocatalytic activity of Au/TiO2 NPs is better than the pristine TiO2 NPs this presenting Au/TiO2 NPs as promising photocatalysts. For the Au/TiO2 NPs, the concentration of Au in TiO2 matrix has an obvious effect on the H2 evolution activity that has an optimum for 0.5 wt% concentration of Au evolving 3344 μmol g−1 of H2. On the other hand, the H2 evolution rate dropped to 2054 μmol g−1 for 0.75 wt% Au/TiO2 NPs.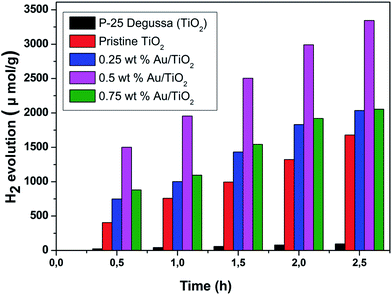 | ||
| Fig. 4 Hydrogen generation of pristine TiO2 NPs, 0.25, 0.5, 0.75 wt% Au/TiO2 NPs and commercial TiO2 (Degussa P-25). | ||
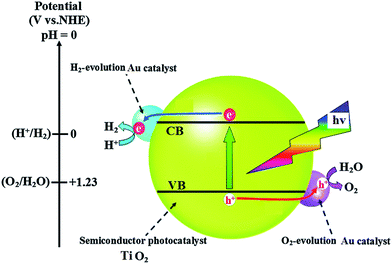
Photocatalytic hydrogen generation by 0.5 wt% Au/TiO2 NPs in UV light and visible light is presented in Fig. 5. It can be observed that 0.5 wt% Au/TiO2 NPs show 2136 and 3344 μmol g−1 of hydrogen generation when exposed to UV illumination and visible light illumination, respectively. The enhanced photocatalytic hydrogen generation of 0.5 wt% Au/TiO2 NPs in visible light illumination may be attributed to its band gap, quantum efficiency, surface area and surface morphology. The enhanced photocatalytic activity of Au/TiO2 NPs can be explained as follow; water splitting is an uphill reaction that needs the standard Gibbs free energy change of ΔGo of 237 kJ mol−1 or 1.23 eV.14,15 Therefore, the band gap energy (Eg) of the photocatalyst should straddle the water redox potentials and it should be between 1.23 eV < Eg < 3.26 eV.16,17 In addition, the photocatalyst should be efficient enough to separate the photogenerated carriers and to transport them to their reactive sites in order to decrease the electron–hole pair recombination. In Au/TiO2 NPs that possess appropriate band gap energetic the CB electrons of one semiconductor are injected to other thereby; achieving a wide electron–hole separation (Fig. 6).18,19 The CB of TiO2 and Au are positioned at ca. −0.7 and −0.30 V, respectively more negative than that of water reduction potential and VB of TiO2 lies closed to the water oxidation potential compared to the VB of Au.20–22 Therefore, owing the advantage of Au/TiO2 NPs, under illumination; electrons are excited from VB to CB of TiO2, thereof transferred to the CB of Au, thereby; reducing water to hydrogen. On the other hand holes from the VB of TiO2 oxidize water. Therefore, the hetero-junction formed between TiO2 and Au efficiently separates the photoexcited electron–hole pairs, and thus hinders the charge recombination and improve the photocatalytic performance of Au/TiO2 NPs compared to the pristine TiO2 NPs. Since we are changing the concentration of Au that evidently affects the capture of photoexcited electrons from the CB of TiO2. If concentration of Au is large, the light absorption from TiO2; will be small thereby inhibiting the generation of electron–hole pairs in TiO2 that is the main reason of decreasing H2 evolution rate of high content incorporation of Au such as that 0.75 wt% of Au in TiO2 matrix. In the absence of Au, most of these charges tend to recombine rapidly as the pristine TiO2 NPs present lower photocatalytic hydrogen generation. Therefore, the synergy for improved photocatalytic activity can be obtained only for a certain concentration of Au in TiO2 matrix. In the current work that synergy is achieved for the 0.5 wt% Au/TiO2NPs. Therefore, the optimum concentration of Au in TiO2 matrix not only optimize the light absorption but also increase the BET surface area and quantum yield (Table 1) which than synergize 0.5 wt% Au/TiO2 NPs for enhanced photocatalytic activity compared to all other samples.
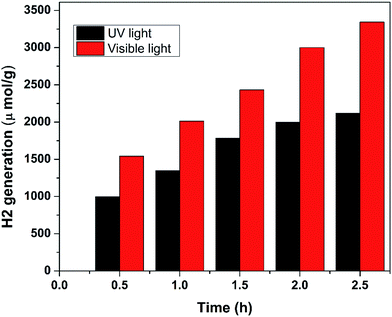 | ||
| Fig. 5 Comparison study of photocatalytic hydrogen generation of 0.5 wt% Au/TiO2 NPs under illumination of UV and visible light. | ||
As it provided the best results in all aspects of the current study, we then characterized the 0.5 wt% Au/TiO2 NPs comprehensively.
The gold content in the synthesized Au/TiO2 samples, measured by ICP-OES analysis is presented in Table 2. The estimated gold contents in the samples were found to be in good agreement with the theoretical values.
Surface morphology studies
The surface morphology of 0.5 wt% Au/TiO2 NPs as showed in Fig. 7(a), 0.5 wt% Au/TiO2 NPs was analyzed using SEM and it shows irregularly-shaped particles, which aggregated to form crystals. The quantitative compositional analysis of 0.5 wt% Au/TiO2 NPs is analyzed using energy dispersive X-ray (EDAX) spectroscopy measurements. The spectra confirm the presence of basic elements like Ti, O and Au, as shown in Fig. 7(b). From the measurements, it is enumerated that the Au was successfully inserted in to the TiO2 crystalline structure. The transmission electron microscopic analysis was carried out to confirm the size of the particles, growth pattern and distribution of the crystallites. A representative TEM image in Fig. 7(c) shows that most of the particles are well distributed with little concentration of aggregates, the average particle size was found to be 38 nm. The lattice spaces of 0.35 nm and 0.239 nm can be observed in HRTEM image (Fig. 7(d)), that are in good agreement with (101) for anatase TiO2, (111) plane for Au. The corresponding SAED spectrum is shown in Fig. 7(e) that further indicates the presence of Au in TiO2 crystalline structure.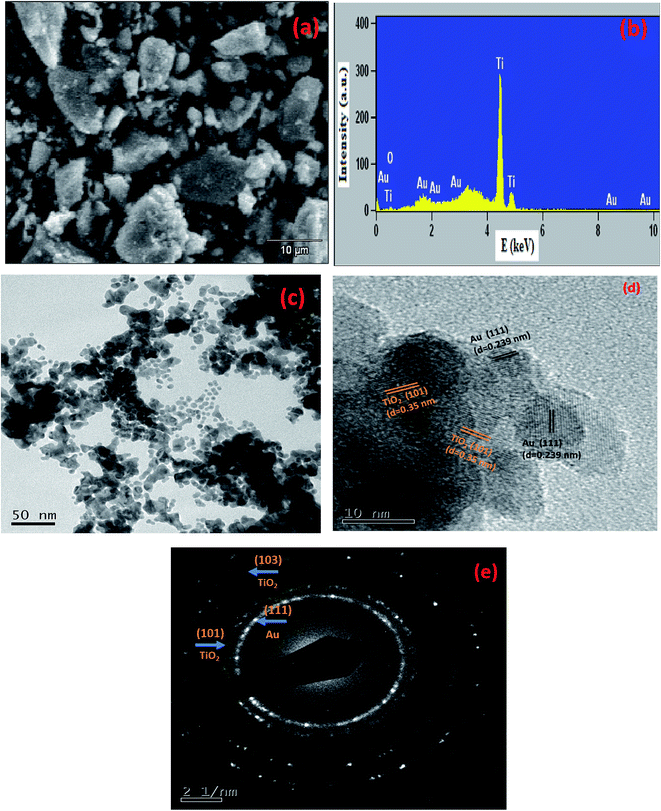 | ||
| Fig. 7 (a) SEM image, (b) EDAX, (c) TEM image, (d) HRTEM image and (e) SAED pattern of the 0.5 wt% Au/TiO2 NPs. | ||
Photocatalytic reduction of Cr6+ to Cr3+
Comparative study of photocatalytic activity of Degussa p25 TiO2, TiO2 and Au/TiO2NPs
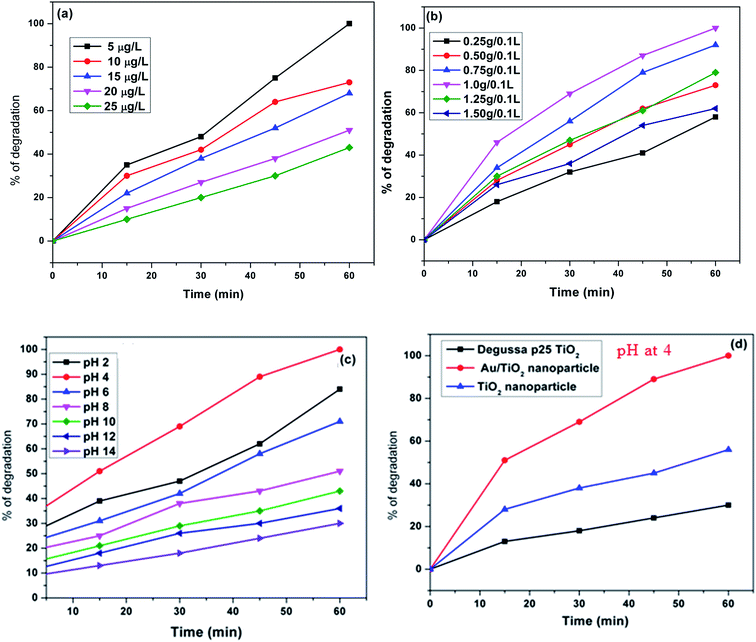
Fig. 8(d) shows the comparative study of photocatalytic activity of Degussa p25 TiO2, TiO2 and Au/TiO2 NPs. Photocatalytic reaction was carried out at constant Cr6+ concentration (5 μg L−1), constant catalytic load (1 g/0.1 L) and pH at 4. These studies indicate the of photocatalytic activity of Au/TiO2 NPs were superior to the photocatalytic activity of bare TiO2 NPs and Degussa p25 TiO2 this was attributed to its surface morphology, higher surface area and quantum yield than TiO2 NPs and Degussa p25 TiO2.The effect of Au doping on the photocatalytic activity of TiO2 NPs
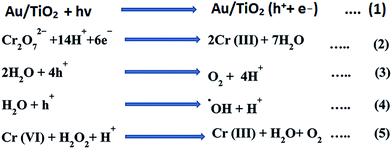
TiO2 under irradiation of UV light produces electron–hole pairs, recombination of electron–hole pairs more in the case of bare TiO2 nanoparticles; the rate of photocatalytic activity resulting there is a reduction of H2 evolution and photo-reduction of Cr6+. The positive effect of Au on the photocatalytic activity of TiO2 may be explained by its ability to trap electrons.27,28 This process reduces the recombination of light generated electron–hole pairs at the TiO2 surface and availability of electron and hole in the respective conduction and reduction bands increases.29 Therefore a more effective electron transfer occurs to the electron acceptors and donors adsorbed on the surface the particle than in the case of bare TiO2. Oxygen adsorbed on the photocatalyst surface traps the electrons and produces superoxide anion and on the other hand holes at the TiO2 surface can oxidize adsorbed water or hydroxide ions to radicals. The enhanced photocatalytic activity of Au/TiO2 NPs can also be explained by the oxidation state of Au ion on the surface of TiO2.30 The Au deposited at the surface as Au+ and Au2+ ions, the reduction of Au ions to metallic Au consumes electrons. Therefore the electron–hole pair recombination reduces and it showed that the electron scavenging by the oxygen at the surface the excited semiconductor particle cannot efficiently complete with the electron transfer to the Au ion.31 So electron transfer to the Au ion is a rather fast comparing to electron transfer to oxygen molecule, the loaded Au metals on the TiO2 surface can expedite the transport of photo-generated electrons to the outer systems. And it can be showed the in the Fig. 6. Mechanistic pathway of photocatalytic reduction from Cr6+ to Cr3+ as shown in Scheme 1.Photochemical detoxification of Cr6+ to Cr3+ in the presence of sunlight and UV light
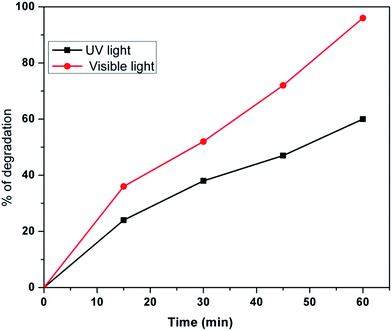
Photochemical detoxification of Cr6+ to Cr3+ in the presence of sunlight and UV light is shown in Fig. 9, respectively. Our catalyst is found to be more active in sunlight compared to UV light. The photocatalytic reduction of K2Cr2O7 (0.1 M) having pH 4 was carried out by adding 0.1 g Au/TiO2 NPs into a photocatalytic reactor in sunlight; it is clear that within 60 min about 96% reduction was achieved, whereas in UV light about 60% reduction was achieved. This clearly indicates that our material showed good photocatalytic reduction from Cr6+ to Cr3+ in sunlight compared to the UV-light. This may be due to the decrease in the band gap of TiO2 particles achieved by doping of Au.Effect of recycling of the photocatalyst
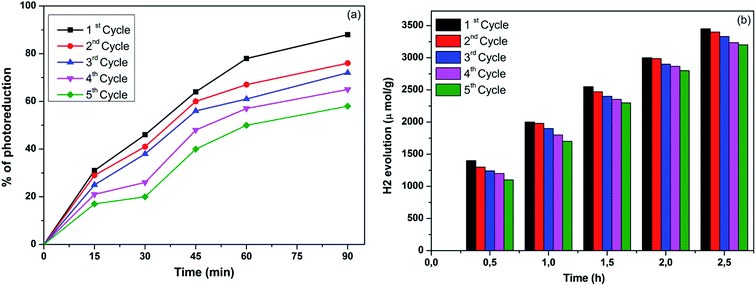
Effect of recycling of 0.5 wt% Au/TiO2 nanoparticles on photocatalytic reduction of Cr6+ to Cr3+ and photocatalytic hydrogen generation and Fig. 10(a) shows the effect of recycling of 0.5 wt% Au/TiO2 nanoparticles for photocatalytic reduction of Cr6+ to Cr3+, prepared at 130 °C for 1 day using an ionic liquid assisted hydrothermal method. One of today's main industrial wastewater treatment strategies is focused on the development of green technologies. Recycling of the Au/TiO2 nanoparticles can be foreseen as good practice for sustainable industrial waste treatment. Consequently, it is necessary to demonstrate whether after a photocatalytic treatment the catalyst can be reused. The nanoparticles were used and recycled consecutively five times. The photocatalytic reaction was carried out at a constant Cr6+ concentration (10 μg L−1) and constant catalytic load (1 g/0.1 L of Cr6+ solutions). Once the first set of experiments is completed, the catalyst is retrieved from the solution via centrifugation and dried in an oven. The recycled catalyst was used for the second cycle and so on. This experimental study indicated that the rate of photocatalytic reduction of Cr6+ to Cr3+ not decreased so much as the number of cycles increased. The effect of photocatalytic reduction of Cr6+ to Cr3+ for first cycle is almost same as fifth cycle, slight decrease in the photocatalytic activity could be due to aggregation and sedimentation of the dye around Au/TiO2 after each cycle of photocatalytic experiment. Each time the catalyst is reused; new parts of the catalyst surface become unavailable for Cr6+ adsorption and, thus, photon absorption, reducing the efficiency of the catalytic reaction, the same way results also observed for the effect of recycling of 0.5 wt% Au/TiO2 nanoparticles for photocatalytic hydrogen generation as shown in the Fig. 10(b).Form the above analyses it was cleared that the prepared Au/TiO2 photocatalyst showing good photo stability.
Electrochemical reduction studies of Cr6+
| Sample | Found Cr6+ (μM) | Added Cr6+ (μM) | Total Cr6+ (μM) | Recovery (%) | |||
|---|---|---|---|---|---|---|---|
| Proposed method | ICP-AES method | Proposed method | ICP-AES method | ||||
| Proposed method | ICP-AES method | ||||||
| Tap water | Not detected | Not detected | 0.5 | 0.5901 ± 0.090 | 0.7999 | 98.56 | 99.82 |
| Not detected | Not detected | 1.0 | 0.9776 ± 0.006 | 0.9486 | 98.76 | 99.66 | |
| Not detected | Not detected | 2.0 | 0.9886 ± 0.007 | 0.9986 | 98.86 | 99.87 | |
| Not detected | Not detected | 3.0 | 3.0000 ± 0.201 | 3.1005 | 100.02 | 101.23 | |
| Industrial waste water | Not detected | Not detected | 0.5 | 0.4985 ± 0.008 | 0.5000 | 99.76 | 99.99 |
| Not detected | Not detected | 1.0 | 0.9967 ± 0.001 | 1.0031 | 99.86 | 100.40 | |
| Not detected | Not detected | 2.0 | 0.9896 ± 0.005 | 0.9996 | 98.76 | 99.67 | |
| Not detected | Not detected | 3.0 | 2.7886 ± 0.126 | 2.7855 | 99.98 | 100.00 | |
Conclusions
Au/TiO2 NPs have been successfully prepared at 130 °C in one day using an ionic liquid assisted hydrothermal method using methoxyethyl methyl imidazolium methanesulfonate as the ionic liquid, titanium(IV) isopropoxide and tetrachloroaurate(III) trihydrate as precursors. Physico-chemical properties of the obtained photocatalysts were investigated via thorough characterizations. The framework substitution of Au in TiO2 NPs was established by XRD, XPS and EDS techniques. XRD and TEM image results confirmed the anatase phase and nanocrystalline nature of Au/TiO2. The optical properties revealed an extended tailing of the absorption edge toward the visible region upon Au doping. The concentration of Au in TiO2 matrix has been fine-tuned to improve the hydrogen production, electrochemical detection and photochemical detoxification of hexavalent chromium (Cr6+). One of the important feature of this article is still there are no reports utilizing a single material for all three applications such as photocatalytic hydrogen production from water and photochemical as well as electrochemical reduction of Cr6+ to Cr3+. The synergy between the Au and TiO2 has an optimum for concentration of 0.5 wt% Au doped TiO2. The optimized product has produced promising hydrogen evolution of 3344 μmol g−1 under the illumination of visible light source in water/ethanol system. The optimized product has showed promising electrocatalytic reduction and photocatalytic detoxification ability of the material towards Cr6+ were explored. Amperometric studies showed a linear range from 0.1 to 2.7 mM, and limits of detection and quantification of 0.01 mM and 0.023 mM, respectively. The Au/TiO2 nanoparticle modified glassy carbon has been used for electrochemical monitoring of Cr6+ in natural water samples. The material also showed better photochemical reduction of Cr6+ in sunlight compared to UV light.Conflicts of interest
There are no conflicts to declare.Acknowledgements
One of the authors, Dr T. N. Ravishankar wishes to acknowledge Dr Sherdil Khan for his valuable suggestions, CNPq-TWAS, Brazil, for financial support and Laboratory of Thin Films and Nanostructure Fabrication (L3F nano), Institute of Physics, UFRGS, Brazil for research facilities. Global Academy of Technology, Bangalore, Karnataka, India for encouragement and support.References
- J. Yu, L. Qi and M. Jaroniec, J. Phys. Chem. C, 2010, 114, 13118–13125 CAS.
- Q. Xiang, D. Lang, T. Shen and F. Liu, Appl. Catal., B, 2015, 162, 196–203 CrossRef CAS.
- M. Zhu, P. Chen and M. Liu, ACS Nano, 2011, 5, 4529–4536 CrossRef CAS PubMed.
- G. Nagaraju, T. N. Ravishankar, K. Manjunatha, S. Sarkar, H. Nagabhushana, R. Goncalves and J. Dupont, Mater. Lett., 2013, 15, 27–30 CrossRef.
- C. Liao, C. Huang, C. Jeffrey and S. Wu, Catalysts, 2012, 2, 490–516 CrossRef CAS.
- T. N. Ravishankar, T. Ramakrishnappa, H. Nagabhushana, V. S. Souza, J. Dupont and G. Nagaraju, New J. Chem., 2014, 39, 1421–1429 RSC.
- T. N. Ravishankar, M. O. Vaz, S. Khan, T. Ramakrishnappa, S. R. Teixeira, G. R. Balakrishna, G. Nagaraju and J. Dupont, New J. Chem., 2016, 40, 3578–3587 RSC.
- D. Jose, C. M. Sorensen, S. S. Rayalu, K. M. Shrestha and K. J. Klabunde, Int. J. Photoenergy, 2013, 685614 Search PubMed.
- T. N. Ravishankar, S. Muralikrishna, K. Sureshkumar, G. Nagaraju and T. Ramakrishnappa, Anal. Methods, 2015, 7, 3493–3499 RSC.
- J. Dupont, C. S. Consorti, P. A. Z. Suarez and R. F. de Souza, Org. Synth., 2002, 79, 236–241 CrossRef CAS.
- A. K. Ramasami, T. N. Ravishankar, G. Nagaraju, T. Ramakrishnappa, S. R. Teixeira and R. G. Balakrishna, Bull. Mater. Sci., 2017, 40, 345–354 CrossRef CAS.
- T. N. Ravishankar, M. d. O. Vaz, S. Khan, T. Ramakrishnappa, S. R. Teixeira, G. R. Balakrishna, G. Nagaraju and J. Dupont, ChemistrySelect, 2016, 1, 2199–2206 CrossRef CAS.
- S. Shuang, R. Lv, Z. Xie and Z. Zhang, Sci. Rep., 2016, 6, 26670 CrossRef CAS PubMed.
- A. Athanasiou, A. Mitsionis, T. Vaimakis, P. Pomonis, D. Petrakis, L. Loukatzikou, N. Todorova, C. Trapalis and S. Ladas, Appl. Surf. Sci., 2014, 319, 143–150 CrossRef CAS.
- N. Zhang, Y. Zhang and Y. Xu, Nanoscale, 2012, 4, 5792–5813 RSC.
- Q. Xiang, F. Cheng and D. Lang, ChemSusChem, 2016, 9, 996–1002 CrossRef CAS PubMed.
- X. Yu, J. Yu, B. Cheng and B. Huan, Chem.–Eur. J., 2009, 15, 6731–6739 CrossRef CAS PubMed.
- D. Lang, T. Shen and Q. Xiang, ChemCatChem, 2015, 7, 943–951 CrossRef CAS.
- Y. Shiraishi, N. Saito and T. Hirai, J. Am. Chem. Soc., 2005, 127, 12820–12822 CrossRef CAS PubMed.
- Q. Xiang, B. Cheng and J. Yu, Angew. Chem., Int. Ed., 2015, 54, 11350–11366 CrossRef CAS PubMed.
- M. M. Khan, S. A. Ansari, D. Pradhan, M. O. Ansari, D. H. Han, J. Lee and M. H. Cho, J. Mater. Chem. A, 2014, 2, 637–644 CAS.
- S. A. Ansari, M. M. Khan, M. O. Ansari and M. H. Cho, New J. Chem., 2015, 39, 4708–4715 RSC.
- Y. A. Shaban, World J. Nano Sci. Eng., 2013, 3, 154–160 CrossRef CAS.
- R. Wang, D. Ren, S. Xia, Y. Zhang and J. Zhao, J. Hazard. Mater., 2009, 169, 926–932 CrossRef CAS PubMed.
- M. C. Lu, G. D. Roam, J. N. Chen and C. P. Huang, J. Photochem. Photobiol., A, 1993, 76, 103–109 CrossRef CAS.
- H. Chen, Y. Shao, Z. Xu, H. Wan, Y. Wan, S. Zheng and D. Zhu, Appl. Catal., B, 2011, 105, 255–262 CrossRef CAS.
- U. M. Jasim, C. Federico, S. Domenica, B. Silvia and Z. Adriano, Mater. Res. Soc. Symp. Proc., 2008, 1077, 41–47 Search PubMed.
- B. Naik, S. Kim, C. Jung, S. Moon, S. H. Kim and J. Y. Park, Adv. Mater. Interfaces, 2014, 1, 1300018 CrossRef.
- D. Jose, C. M. Sorensen, S. S. Rayalu, K. M. Shrestha and K. J. Klabunde, Int. J. Photoenergy, 2013, 2013, 685614 CrossRef.
- W. Zhao, Z. Ai, J. Dai and M. Zhang, PLoS One, 2014, 9, e103671 Search PubMed.
- T. Jafari, E. Moharreri, A. S. Amin, R. Miao, W. Song and S. L. Suib, Molecules, 2016, 21, 900 CrossRef PubMed.
- P. M. Hallam, D. K. Kampouris, R. O. Kadaraand and C. E. Banks, Analyst, 2010, 135, 1947–1952 RSC.
- J. P. Metters, R. O. Kadara and C. E. Banks, Analyst, 2012, 137, 896–902 RSC.
| This journal is © The Royal Society of Chemistry 2017 |

