DOI:
10.1039/C7RA04900E
(Paper)
RSC Adv., 2017,
7, 34208-34214
Simultaneous neutron reflectometry and infrared reflection absorption spectroscopy (IRRAS) study of mixed monolayer reactions at the air–water interface†
Received
1st May 2017
, Accepted 23rd June 2017
First published on 7th July 2017
Abstract
The simultaneous application of neutron reflectometry (NR) and infrared reflection absorption spectroscopy (IRRAS) to the study of the oxidation kinetics of organic monolayers at the air–water interface is described for the first time. This advance was possible thanks to the development of a new sample environment that includes a gas-delivery system and is compatible with in situ application of the two techniques within the constraints of short-term neutron beam-line access. We studied the oxidation of monolayers of the mono-molecular film palmitoleic acid and of a binary mixture of oleic (OA) and stearic (SA) acids by gas-phase ozone. We contrast the two highly complementary techniques and demonstrate that IRRAS provides key additional insight into the alignment of surfactant molecules at the air–water interface. We highlight the potential of the more economical and widely available IRRAS technique to complement NR studies. We also found an apparent increase of the NR signal upon oxidation of a mixed SA/OA monolayer, as well as evidence of slow intensity fluctuations of the SA-generated IRRAS signal. We demonstrate how simultaneous NR-IRRAS substantially enhances future studies of increasingly complex surfactant mixtures and their atmospheric surface reactions.
1 Introduction
Organic monolayers at the air–water interface serve as model systems for a variety of natural and artificial surface films.1,2 Surfactant monolayers are relevant to a wide range of practical systems and processes, including detergency, paint manufacture, corrosion control, and foaming/de-foaming applications.3 In recent years, awareness has grown of potential roles for surfactants and long chain carboxylic acids in atmospheric aerosol.4–7 Surfactants in the atmosphere can originate from the sea-surface microlayer or can be associated with biomass burning and other combustion processes. Atmospheric aerosols in turn are of great interest, since they influence cloud formation and earth's global radiation budget. Although it is known that aerosols contain a mix of organic and inorganic material, the exact composition of aerosol particles and the partitioning of surfactants, for instance within the aerosol and on its surface, is not well established. Even less well understood is the effect of oxidative processes initiated by nitrate radicals (NO3), hydroxyl radicals (OH), and ozone, (O3) on surfactant composition.4,8–10 Our interest lies in understanding the kinetics of such processes, as well as in identifying the fate of the reaction products. A common and powerful technique for studying such reactions at the air–water interface is neutron reflectometry (NR).11 This non-destructive method enables the absolute determination of the adsorbed amount of a certain molecular species at the interface. Furthermore, by selective isotopic exchange of hydrogen atoms by deuterium it is possible to highlight one species in a mixture, or indeed to determine the fate of reaction products by deuterating only one part of a molecule. This approach has been successfully used by our group and others.12–14 With NR alone however, it is not possible to quantify the absolute adsorbed amount of each surfactant in a mixed monolayer consisting of two or more different species. Recent work by our group combined NR with ellipsometry off-line (Sebastiani et al., 2015).15 However, a method linked to NR on-line would have obvious advantages such as simultaneous observations on a single system without the need for assumptions about reproducibility of off- and on-line conditions/systems. One way of achieving this is to use a different surface-sensitive technique, such as Fourier Transform Infrared Reflection Absorption Spectroscopy (FT-IRRAS, or IRRAS). Voss et al. have demonstrated the use of sum frequency generation spectroscopy and IRRAS to observe the oxidation of oleic acid monolayers on water.16 A further advantage of IRRAS is its potential to show changes – evidenced by peak shifts – in the molecular environment during the oxidation process. These changes could be caused by reorganisation of the monolayer, changing surface pressure, level of hydration or cleavage of bonds. In order to obtain comprehensive information about the desorption behaviour of mixed, multi-component surfactant monolayers, we employed these two complementary techniques in parallel. An earlier set-up, using Attenuated Total Reflection (ATR) geometry, was deployed at the BioRef instrument at the Helmholtz-Zentrum Berlin (HZB).17 Due to the vertical sample geometry and space constraints of this set-up, it is only possible to measure solid(–liquid) samples. Furthermore, the accessible mid-IR region is restricted to above 1400 cm−1 due to absorption by the silicon substrate. In contrast, we developed a set-up allowing, for the first time, measurements on monolayers at the air–water interface in IRRAS geometry in a fully controlled gas-phase environment above the Langmuir trough allowing observation of complex reactions at the air–water interface with these two techniques simultaneously. The accessible mid-IR range is 4000–900 cm−1. By exploiting isotopic substitution (i.e. selective deuteration), we were able to obtain structural information from NR, as well as molecular level information about both deuterated and non-deuterated monolayer components at the same time. While NR provides accurate information about the surface excess and to some extent about changes in the layer thickness, IRRAS is able to record changes in the molecular environment within the monolayer (via shift in the characteristic absorption bands of the respective species), as well as detecting the presence of reaction products at the interface. This is especially important when studying mixed monolayers, where one of the components is not deuterated and therefore a determination of the surface excess from NR is not possible due to low contrast. Our set-up has the potential to be used for a broad range of monolayer or thin film systems, including protein adsorption in complex environments,18 polyelectrolyte/surfactant systems19 and many others. In this article we present two case studies in order to illustrate the capabilities of our set-up and to outline its key advantages.
2 Materials and methods
2.1 Materials
Partially deuterated (d14; the alkyl chain between double bond and carboxylic acid group is deuterated) palmitoleic acid (dPOA) was provided by the Oxford Deuteration Facility. Deuterated stearic acid (dSA, product no. 448249), deuterated oleic acid (dOA, product no. 683582), deuterated palmitic acid (dPA, product no. 366897), stearic acid (hSA, product no. 366897) and oleic acid (hOA, product no. O1008) were purchased from Sigma-Aldrich. All fatty acids were dissolved in chloroform to produce spreading solutions with the following concentrations: hSA – 1.12 mg mL−1, dOA – 1.18 mg mL−1, dPOA – 1.85 mg mL−1, dSA – 1.5 mg mL−1. The sub-phase was a mixture of 8.1% by volume D2O (Sigma-Aldrich 99.9 atom% D) in pure H2O (generated using a Millipore purification unit, 18.2 MΩ cm), known as air contrast matched water (ACMW). Chloroform (Sigma-Aldrich, >99.8%) and O2 (Air Liquide, France, >99.9%) were used as supplied.
2.2 Gas set-up
Ozone, O3, was produced by flowing pure O2 through a commercial ozoniser (UVP Pen-Ray continuous flow generator, UK). The O3 concentration was regulated by changing the exposure to the UV lamp. A flow of O3 in O2 was then admitted to the reaction chamber and the organic monolayer was oxidised at a rate that was determined by the O3 concentration. The flow rate of O2 was 1.2 L min−1, leading to a range of [O3]v from (3.6 ± 0.3) × 1013 cm−3 to (9.6 ± 0.6) × 1013 cm−3. Measurements of O3 absorption at 253.7 nm were carried out using UV-visible spectroscopy to establish the volume concentration, [O3]v (in molecule per cm3), and its uncertainty. The surface concentration, [O3]s (in molecule per cm2), of ozone that dissolves into the organic layer at the air–water interface is calculated from [O3]v assuming that the surface concentration is constant in time and is equal to Henry's law solubility following the approach of Smith et al.20
2.3 Neutron reflectometry
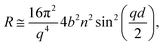
Specular neutron reflectometry (NR) measurements were carried out using the white beam INTER reflectometer at the Rutherford Appleton Laboratory (Oxfordshire, UK), using neutron wavelengths from 2.0 to 17.0 Å. The reflected intensity was measured at an incident angle of 0.8° (using a non-polarising supermirror at 0.75°) as a function of the momentum transfer, q = (4π![[thin space (1/6-em)]](https://www.rsc.org/images/entities/char_2009.gif) sinθ)/λ, where λ is wavelength and θ is the incident angle. Data were collected at a resolution (Δq/q) of 7%, yielding a total illuminated length of 165 mm. The width of the beam was set to 50 mm in order to avoid meniscus effects. Time-resolved measurements were acquired over minutes and up to several hours with a time resolution of 20 s. The sample stage was equipped with passive and active anti-vibration control. The reaction chamber was mounted on the sample stage and interfaced with the gas setup. The PTFE trough was filled with 90 mL of ACMW. Monolayers were spread using 20–40 μL of the spreading solutions in chloroform, leaving a monolayer of the dissolved species after evaporation of the solvent. Data were recorded for a few minutes before O3 was admitted into the chamber. The air–liquid interface was aligned with respect to the neutron beam using a “Keyence” laser displacement sensor (model no. LK-G402), which was coupled into the sample chamber via a quartz window to allow automated height adjustment during the measurements. NR measures the reflected intensity as a function of the momentum transfer vector q. For a monolayer at the air–ACMW interface the reflected intensity (or reflectivity) R can be expressed as:
sinθ)/λ, where λ is wavelength and θ is the incident angle. Data were collected at a resolution (Δq/q) of 7%, yielding a total illuminated length of 165 mm. The width of the beam was set to 50 mm in order to avoid meniscus effects. Time-resolved measurements were acquired over minutes and up to several hours with a time resolution of 20 s. The sample stage was equipped with passive and active anti-vibration control. The reaction chamber was mounted on the sample stage and interfaced with the gas setup. The PTFE trough was filled with 90 mL of ACMW. Monolayers were spread using 20–40 μL of the spreading solutions in chloroform, leaving a monolayer of the dissolved species after evaporation of the solvent. Data were recorded for a few minutes before O3 was admitted into the chamber. The air–liquid interface was aligned with respect to the neutron beam using a “Keyence” laser displacement sensor (model no. LK-G402), which was coupled into the sample chamber via a quartz window to allow automated height adjustment during the measurements. NR measures the reflected intensity as a function of the momentum transfer vector q. For a monolayer at the air–ACMW interface the reflected intensity (or reflectivity) R can be expressed as:| |
 | (1) |
where b is the scattering length, in Å, n is the number density, in Å3, d is the thickness of the layer in Å, and bn = ρ is the scattering length density in Å−2.11 Due to the use of ACMW, the reflectivity data do not show a critical edge and the neutrons are only sensitive to the surface monolayer. The monolayer is too thin to generate any Kiessig oscillations in the observable q-range. Using a single layer model fit, the product of ρ and d was determined for each kinetic measurement. Once ρd was determined the surface excess, Γ, was calculated by:| |
 | (2) |
where APM is the area per molecule. Although the individual values for monolayer thickness and density are correlated, their product can be determined with high confidence, as it is not very sensitive to specific model assumptions. By changing the thickness or density of the film within reasonable boundaries, the effect on the value of the surface excess was assessed and resulted in an uncertainty of <1% monolayer coverage.
2.4 In situ infrared reflection absorption spectroscopy
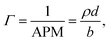
The in situ spectra were recorded with a Thermo Scientific Nicolet iS50 FT-IR Spectrometer in the spectral range 900–4000 cm−1 at a spectral resolution of 4 cm−1, using a liquid-nitrogen-cooled MCT (Mercury–Cadmium–Telluride) detector. The acquisition time was 5 min (1024 co-added spectra and an optical velocity of 1.8988) unless otherwise stated. An external infra-red beam was obtained by using the right-hand-side custom port. The infra-red light's optical path through the reaction chamber is outlined in Fig. 1a. All external optical components, as well as the reaction chamber, were mounted on a 600 mm × 600 mm optical breadboard (ThorLabs). This way, the entire set-up could be pre-aligned prior to the NR experiment, thus substantially reducing on-beam set-up time. The collimated light from the spectrometer's right-hand-side port was deflected up by using a 45° flat gold coated mirror (10 cm × 15 cm), which could be adjusted along the IR beam path making it possible to align its reflection with the first spherical mirror. Two adjustable, symmetrically positioned spherical mirrors with focal length f = 150 mm (protected gold, Edmund Optics) created a focal point on the liquid surface. Both spherical mirrors were mounted on gimbal mounts allowing fine adjustment. These were in turn located on a set of custom-made goniometer stages, which allowed each mirror to be individually rotated around the focal point. A final gold coated 90° parabolic mirror with an effective focal length of 101.6 mm (Edmund Optics) focused the light into the external MCT detector, which was mounted on a linear stage and a rotating collar to allow fine alignment. The parabolic mirror was also mounted on a linear stage for alignment with the second spherical mirror, and could also be rotated to allow fine control of the focal point relative to the MCT detector. The incident angle of the IR beam on the water surface was chosen to be 48° (it could be varied from 42° to 55°). This angle was found to yield the best signal-to-noise ratio. This is close to the Brewster angle (53°) and similar to angles reported elsewhere.21 Immediately before each measurement, a background spectrum of at least 1024 co-added spectra was acquired from a bare water surface. These background spectra were used to normalise the sample spectra. The spectrometer, with a footprint of approximately 600 mm × 600 mm, was mounted on a 2.5 m long structural rail (X95, ThorLabs) directly attached to the INTER sample position in such a way that the spectrometer and optics set-up could be moved as a whole in order to fine-adjust the trough position with respect to the neutron beam without disturbing the alignment of the spectrometer with respect to the optics, MCT detector, and reaction chamber.
 |
| | Fig. 1 (a) Optical path for the infra-red beam obtained from the right-hand-side port of the iS50 spectrometer. The beam was focused on the air–liquid interface using 3′′ gold coated spherical mirrors with a focal length of 150 mm. The incident angle of the IR beam with respect to the surface normal was chosen to be 48°, but could be varied between 42° and 55°. (b) Sketch of reaction chamber with neutron and IR beam paths indicated. | |
2.5 Reaction chamber design
A purpose-built gas flow cell was designed for studying oxidation reactions in mixed monolayers (Fig. 1b). The flow cell with a volume of approximately 1.5 L accommodates a liquid trough with inner dimensions of 238 mm × 70 mm and provides two CaF2 windows (CrysTran) of 1.5 mm thickness to allow ingress and egress of the IR light. The clear aperture of these windows is 45 mm. The windows are mounted at an angle of 48° with respect to the vertical, to enable normal or near-normal incidence for the IR beam in an angular range of 42 to 55°. A third circular quartz window with a clear aperture of 50 mm is mounted above the centre of the liquid trough to allow the height laser to monitor the liquid surface. This window is tilted by 5° from the horizontal in order to avoid a secondary reflection into the height laser.
The neutron beam enters and exits the chamber though rectangular quartz windows (50 mm × 68 mm) at either end of the reaction chamber. The main requirements for the reaction chamber were dictated by fitting the NR and FTIR beam geometries, minimising the chamber volume for rapid gas-mixing, and ensuring good flow characteristics by avoiding dead volumes. As a compromise between NR signal (illuminated area) and chamber volume, the outer dimensions were chosen to be 290 mm × 112 mm. To allow gas flow through the chamber, four push-fit-style bulkhead connectors are used, accepting 6 mm diameter PTFE tubing. Gas is admitted to the chamber by inserting an end-capped PTFE tube with 2 mm diameter holes drilled at 1 cm intervals into one of the push fit connectors, as described in Sebastiani et al.15 This design provides optimised homogenous flow and gas diffusion. The liquid trough is supported at three kinematic mounting points; the supporting adjustable screws can be synchronously adjusted from the outside using a belt drive, allowing for fine adjustment of the vertical location of the air–water interface within the gas-flow cell. This adjustment capability allows the maximisation of the FTIR signal independently of the alignment of the interface with respect to the neutron beam.
3 Results and discussion
3.1 Performance of the external IRRAS set-up
In order to assess the performance of the set-up, a representative spectrum containing both CH and CD absorption bands was baseline-corrected and the signal-to-noise ratio (SNR) was calculated as follows: first, the amplitude of the strongest and weakest band was determined (Fig. 2); then, by analysing a region without absorption bands (3415–3019 cm−1 – not shown here) the RMS noise was determined and compared with the signal from the reference spectrum. The resulting SNR values were 30.6 and 17.1 for CH and CD bands, respectively. Since the spectrum above arose from a mixture of perdeuterated palmitic acid and hydrogenous oleic acid (1:1 mixing ratio), for some single component measurements the SNR is better than the values quoted above. When using saturated compounds, such as stearic acid or lipids, which form tightly packed, well oriented monolayers, the obtained signal-to-noise is further improved, and count times of 30 s (rather than several minutes for unsaturated components) are achievable.
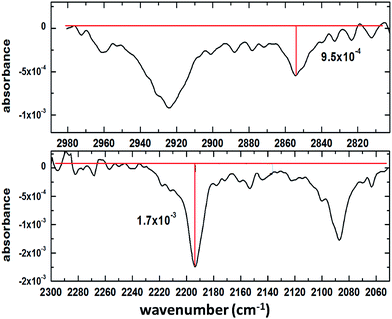 |
| | Fig. 2 Mixed monolayer of 1:1 deuterated palmitic acid and hydrogenous oleic acid: determination of the peak heights of the weakest (CH stretch of oleic acid, top) the strongest (CD stretch of palmitic acid, bottom) absorption bands. | |
3.2 Single-component monolayers
Partially deuterated POA. In order to determine the sensitivity of our set-up, a single component monolayer consisting of partially deuterated (d14) palmitoleic acid (15 μL spreading solution) was oxidised in situ and the reaction followed both with 20 s time resolution NR scans and 5 min time resolution IRRAS scans. Fig. 3 illustrates the comparison of the simultaneous NR and IRRAS data obtained. The much longer IRRAS acquisition time was necessary due to the comparatively low signal-to-noise caused by the disordered nature of the unsaturated fatty acid monolayer. These results also denote to some extent the sensitivity limit, as saturated fatty acids or lipids form well-ordered monolayers which generally lead to better signal-to-noise ratios than unsaturated compounds such as this species. The stability of the monolayer was assessed by monitoring the IRRAS and NR signals over several hours (data not shown). The slight decay in surface coverage can then be accounted for, leading to a precise determination of the coverage during the oxidation process.
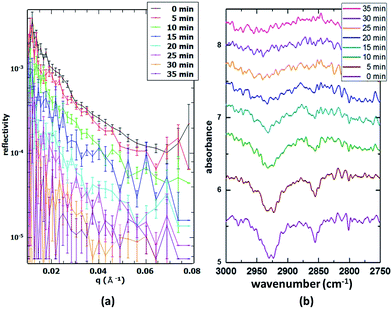 |
| | Fig. 3 (a) Time-resolved NR data (30 s acquisition time in 5 min intervals) during the oxidation of a partially deuterated palmitoleic acid monolayer; (b) simultaneous in situ IRRAS data (5 min acquisition time) obtained from the same monolayer. | |
3.3 Two-component monolayers
Stearic acid/deuterated oleic acid. The main strength of the presented method lies in the ability to follow the desorption of multiple components in mixed monolayers simultaneously in real time. For this purpose, one of the components is deuterated, while the other is not. This means that the NR signal will arise almost solely from the surface excess of the deuterated species, while the IRRAS signal will contain both CD and CH absorption bands and therefore will provide information for both species. An example of a mixed stearic acid and deuterated oleic acid system (1:1 mixing ratio) is presented in Fig. 4. The mixed monolayer was spread using 26 μL of a 1:1 mixture of the two spreading solutions and was oxidised using an O3 concentration of 1.2 × 1013 cm−3. The reaction was followed both with 20 s time resolution NR scans and 5 min time resolution IRRAS scans. The NR data show a fast drop in intensity, indicating the removal of dOA from the interface. In parallel, the FTIR spectra show the weakening of CD bands (2000–2200 cm−1), while the CH bands (originating from the hSA) maintain a constant intensity; however, complementary runs with a lower proportion of unsaturated surfactants (a better mimic for atmospheric aerosol composition) showed disappearance of CH bands suggesting an orientation dependent IR signal loss (data not shown). The difference in peak shape and intensity between CH and CD bands has several causes. Firstly, the saturated SA tends to form domains or islands due to strong van-der-Waals interactions of the alkane chains (see Brewster-Angle Microscopy (BAM) images obtained for the mixture of hSA and hOA in Fig. 5; the pressure–area isotherm for this mixture is given in the ESI†). These BAM images clearly illustrate the immiscibility of the two components recorded at three different surface pressures. Fig. 5a shows the presence of separated domains. Just before the pressure plateau (32 mN m−1; see Fig. S.1†), condensation nuclei appear while the circular domains are still visible (Fig. 5b). At the maximum pressure, 40 mN m−1, rod-like domains are distinguishable from a uniform background (Fig. 5c), and the morphology of the collapsed structure is different from the previous morphologies. Within these domains the chains are well aligned and this results in sharp CH bands. The unsaturated OA chains, on the other hand, are disordered and the resulting CD bands are broad and weak by comparison. As can be seen in Fig. 4, NR and CD band intensity both decrease during the oxidation process, while the CH bands remain visible, indicating the presence of the SA monolayer throughout the reaction.
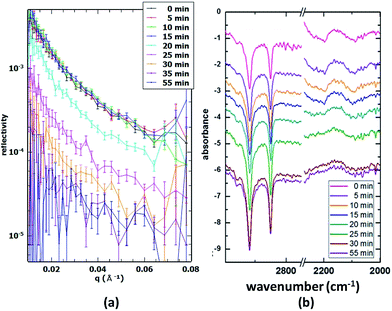 |
| | Fig. 4 Time-resolved NR and IRRAS data during the oxidation of a 1:1 mixed monolayer of stearic acid and deuterated oleic acid. Both CH and CD stretching vibrations are visible at about 2850–2920 and 2000–2200 cm−1, respectively. | |
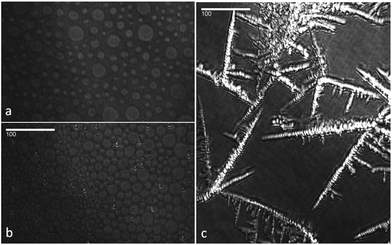 |
| | Fig. 5 BAM images of the hOA–hSA monolayer at 25 °C on a pure water sub-phase recorded at three pressures: (a) 0 mN m−1: the layer shows circular domains; (b) 32 mN m−1: collapsing points start to be visible between the circular domains; (c) 40 mN m−1: the layer is collapsed and domains became rod-like. The white bar corresponds to 100 μm. | |
It is worth mentioning that the oxidation of OA in the films mixed with SA leads to an unusual increase in the measured neutron reflectivity signal when SA is deuterated instead of OA. This is mostly due to the reorganisation of the remaining SA from islands into an homogeneous monolayer. When measuring the same mixed system, but with this reverse deuteration configuration (dSA/hOA), the NR signal started increasing as soon as oxidation of OA commenced (Fig. 6). The most likely explanation for this behaviour is the effect of the lateral coherence length of the neutron beam: if a significant proportion of the initial SA islands have a size greater than the coherence length of the neutron beam (typically of the order of microns),22 then the neutrons scattered by the islands do not interfere coherently with those scattered by the surrounding material. As a consequence, the scattered signal, rather than being an average of scattering length densities (SLDs) of dSA and hOA, arises solely from the dSA. The dSA islands however, cover only about 50% of the surface, leading to an overall reduction of the scattered signal in the initial state. Upon oxidation of hOA, the dSA islands spread to form a uniform monolayer covering the entire surface. This leads to an apparent increase in the scattering signal. For mixed monolayers where the two components are miscible, the scattered signal will always be a function of the average of the SLDs of the different species. If the oxidisable component is null-reflecting (same SLD as air and the sub-phase), then no change in the scattered intensity will be observed if the stable component remains on the surface. This signal increase could be misinterpreted, especially if measuring in the reverse deuteration, where it would lead to an apparent reduction in the reaction rate as well as a “residual” signal. This effect strongly depends on island size and could be used as indirect measure of island size distribution. To corroborate this explanation of the signal increase we have also measured the scattered intensity on a linear detector (data not shown). There was no discernible difference before and after the oxidation in the amount of off-specular scattering. This finding excludes the possibility of increased roughness due to the islands in the initial state.
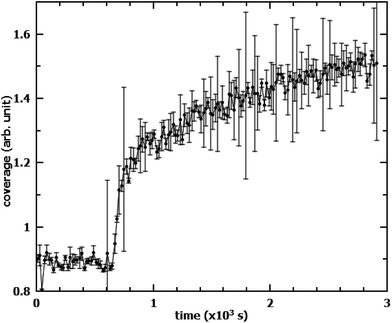 |
| | Fig. 6 Evolution of NR signal from a dSA/hOA monolayer during oxidation with a time resolution of 20 s. O3 at a concentration of 1.2 × 1013 cm−3 is admitted to the reaction chamber at t = 640 s. The scattering arose solely from the deuterated component (SA), which underwent re-ordering on the surface. | |
4 Conclusions and outlook
We have described an experimental set-up for performing simultaneous NR and IRRAS within a specially designed reaction chamber for the study of atmospherically relevant chemical reactions in thin films at the air–water interface. To our knowledge this is the first on-beam IRRAS set-up for studying liquid interfaces. This flexible set-up is available for use on the INTER reflectometer at the ISIS spallation neutron source. We have demonstrated that we can obtain complementary information regarding thin-film structure and molecular environment with good SNR and short acquisition times in an optimised set-up. This set-up is applicable to a range of monolayer and thin film (kinetic) studies, e.g. protein adsorption, protein-monolayer interactions, surfactant monolayers and mixtures, as well as our core interest of atmospheric chemistry. The in situ IRRAS set-up provides additional information: it shows the presence and relative concentration (if corrected for the natural strength of various absorption bands, for instance by comparing with a known standard) of molecules invisible to NR (contrast matched) at the same time as the NR signal provides structural information of the highly contrasting species. IRRAS also gives molecular environment information in addition to structural information from NR. We are continuing to apply the strengths of our approach to determining the fate of reaction products upon oxidation. As atmospheric aerosols will typically contain a complex mixture of surfactants (saturated and unsaturated), our combined techniques are ideally suited to give us detailed insight into the oxidation process. Unraveling the fate of individual components within a complex mixture will inevitably further our understanding of the very complex life cycle of atmospheric aerosols.
Acknowledgements
MWAS would like to thank J. Simms for help with the technical drawings for the reaction chamber. The authors gratefully acknowledge studentship funding from the following sources: NERC for MH, NERC SCENARIO and ISIS for BT, Institut Laue-Langevin (ILL) and University of Reading for FS. We also thank the Partnership for Soft Condensed Matter at ILL for providing access to BAM. Access to the neutron reflectometer INTER and use of the on-beam FTIR was provided by ISIS (experiments RB1510605 and RB1520459).
References
- S. Fuzzi, M. O. Andreae, B. J. Huebert, M. Kulmala, T. C. Bond, M. Boy, S. J. Doherty, A. Guenther, M. Kanakidou, K. Kawamura, V.-M. Kerminen, U. Lohmann, L. M. Russell and U. Pöschl, Atmos. Chem. Phys., 2006, 6, 2017–2038 CrossRef CAS.
- J. Pérez-Gil, Biochim. Biophys. Acta, Biomembr., 2008, 1778, 1676–1695 CrossRef PubMed.
- M. S. Aston, Chem. Soc. Rev., 1993, 22, 67–71 RSC.
- A. D. Estillore, J. V. Trueblood and V. H. Grassian, Chem. Sci., 2016, 7, 6604–6616 RSC.
- R. E. Cochran, O. S. Ryder, V. H. Grassian and K. A. Prather, Acc. Chem. Res., 2017, 50, 599–604 CrossRef CAS.
- P. K. Quinn, D. B. Collins, V. H. Grassian, K. A. Prather and T. S. Bates, Chem. Rev., 2015, 115, 4383–4399 CrossRef CAS PubMed.
- B. Graham, P. Guyon, P. E. Taylor, P. Artaxo, W. Maenhaut, M. M. Glovsky, R. C. Flagan and M. O. Andreae, J. Geophys. Res.: Atmos., 2003, 108, 2156–2202 Search PubMed.
- R. C. Chapleski, Y. Zhang, D. Troya and J. R. Morris, Chem. Soc. Rev., 2016, 45, 3731–3746 RSC.
- I. J. George and J. P. D. Abbatt, Nat. Chem., 2010, 2, 713–722 CrossRef CAS PubMed.
- U. Pöschl and M. Shiraiwa, Chem. Rev., 2015, 115, 4440–4475 CrossRef PubMed.
- J. Lu, R. Thomas and J. Penfold, Adv. Colloid Interface Sci., 2000, 84, 143–304 CrossRef CAS PubMed.
- M. D. King, A. R. Rennie, K. C. Thompson, F. N. Fisher, C. C. Dong, R. K. Thomas, C. Pfrang and A. V. Hughes, Phys. Chem. Chem. Phys., 2009, 11, 7699–7707 RSC.
- M. D. King, A. R. Rennie, C. Pfrang, A. V. Hughes and K. C. Thompson, Atmos. Environ., 2010, 44, 1822–1825 CrossRef CAS.
- C. Pfrang, F. Sebastiani, C. O. M. Lucas, M. D. King, I. D. Hoare, D. Chang and R. A. Campbell, Phys. Chem. Chem. Phys., 2014, 16, 13220–13228 RSC.
- F. Sebastiani, R. A. Campbell and C. Pfrang, RSC Adv., 2015, 5, 107105–107111 RSC.
- L. F. Voss, M. F. Bazerbashi, C. P. Beekman, C. M. Hadad and H. C. Allen, J. Geophys. Res.: Atmos., 2007, 112, D06209 Search PubMed.
- M. Strobl, R. Steitz, M. Kreuzer, M. Rose, H. Herrlich, F. Mezei, M. Grunze and R. Dahint, Rev. Sci. Instrum., 2011, 82, 055101 CrossRef CAS PubMed.
- J. Seeliger, F. Evers, C. Jeworrek, S. Kapoor, K. Weise, E. Andreetto, M. Tolan, A. Kapurniotu and R. Winter, Angew. Chem., Int. Ed., 2012, 51, 679–683 CrossRef CAS PubMed.
- I. Varga and R. A. Campbell, Langmuir, 2017, 33, 5915–5924 CrossRef CAS PubMed.
- G. D. Smith, E. Woods, C. L. DeForest, T. Baer and R. E. Miller, J. Phys. Chem. A, 2002, 106, 8085–8095 CrossRef CAS.
- C. R. Flach, Z. Xu, X. Bi, J. W. Brauner and R. Mendelsohn, Appl. Spectrosc., 2001, 55, 1060–1066 CrossRef CAS.
- C. F. Majkrzak, C. Metting, B. B. Maranville, J. A. Dura, S. Satija, T. Udovic and N. F. Berk, Phys. Rev. A, 2014, 89, 033851 CrossRef.
Footnotes |
| † Electronic supplementary information (ESI) available. See DOI: 10.1039/c7ra04900e |
| ‡ Current address: CR Competence AB, P.O. Box 124, 22100 Lund, Sweden. |
|
| This journal is © The Royal Society of Chemistry 2017 |
Click here to see how this site uses Cookies. View our privacy policy here. 
 Open Access Article
 This Open Access Article is licensed under a
  *a,
Benjamin Thomas
*a,
Benjamin Thomas


