 Open Access Article
Creative Commons Attribution 3.0 Unported Licence
T1-Weighted MR/CT dual-modality imaging-guided photothermal therapy using gadolinium-functionalized triangular gold nanoprism†
Wenfei Liua,
Kai Liub,
Ying Zhaoa,
Shuang Zhaoa,
Song Luoa,
Ying Tiana,
Zhaogang Teng *a,
Shouju Wang*a and
Guangming Lu
 *a
*a
aDepartment of Medical Imaging, Jinling Hospital, Medical School of Nanjing University, Nanjing 210002, P. R. China. E-mail: tzg@fudan.edu.cn; shouju.wang@gmail.com; cjr.luguangming@vip.163.com
bNanjing Stomatological Hospital, Medical School of Nanjing University, Nanjing 210008, P. R. China
First published on 9th March 2017
Abstract
Multifunctional nanoagents, in particular those that combine diverse diagnostic and therapeutic functions, have attracted great enthusiasm in oncotherapy. In this work, a triangular gold nanoprism decorated with gadopentetic acid (Gd–DTPA) (TGP–PEG–Gd) was constructed for use in cancer theranostics. TGP–PEG–Gd exhibits uniform morphology, excellent monodispersity and near infrared absorbance properties. The magnetic properties of gadolinium, together with the X-ray attenuation of gold, enable TGP–PEG–Gd to be employed for T1-weighted MR/CT dual-modality imaging. The longitudinal relaxivity (r1) of TGP–PEG–Gd was calculated to be 23.1 mM−1 s−1, and its X-ray absorption coefficient was 959.3 HU L g−1. In addition, TGP–PEG–Gd possesses effective photothermal conversion ability, which was utilized for successful photothermal therapy. Moreover, the excellent biocompatibility of TGP–PEG–Gd was proved both in vitro and in vivo. Biocompatible TGP–PEG–Gd may hold promise for the photothermal therapy of cancers guided by MR/CT dual-modality imaging.
Introduction
Photothermal therapy (PTT) holds promise in the area of anti-tumour therapy owing to its precise delivery of energy, minimal invasiveness, and high spatiotemporal selectivity in comparison to conventional tumour treatment modalities.1–6 Imaging-guided PTT, which combines single or multiple imaging modalities with PTT, has attracted ever-increasing interest.7–10 With the development of nanotechnology, the integration of the detection of lesions, hyperthermal ablation and monitoring of therapeutic efficacy within a single nanoplatform could dramatically simplify and optimize the diagnosis and treatment of tumours.3,7,11–13Among the various tumour imaging modalities, computed tomography (CT) and magnetic resonance imaging (MRI) are the most widely used in clinical applications owing to their high resolution and deep penetration.14,15 Moreover, each of these modalities has its own characteristics. MR imaging provides outstanding soft tissue contrast but has defects in revealing calcifications. On the other hand, CT provides better density resolution and is preferable for the imaging of osseous tissue and calcifications.14,16,17 The combination of MRI and CT could combine their merits and overcome their defects and thus achieve accurate diagnosis of tumours and provide precise guidance for PTT.16,18,19
However, a limited number of studies have investigated the employment of nanoplatforms for PTT guided by MR/CT. One reason for this is that such nanoplatforms need to contain several different components, including X-ray attenuation elements (e.g., iodine and bismuth) for CT, magnetic materials (e.g., iron oxide and manganese selenide) for MR, and photothermal conversion materials (e.g., carbon nanotubes and graphene) for PTT.3,6,7 Their sophisticated assembly, challenging synthesis, and uncertain stability have significantly hindered the employment of these nanoplatforms.19,20 Moreover, most such nanoplatforms are designed for T2-weighted MR imaging.14,18,19 However, T1-weighted MR imaging plays an equally important role in the clinical diagnosis of cancer. Thus, it is urgently necessary to develop novel nanostructures that inherently combine T1-weighted MR/CT imaging and photothermal conversion capacities and have a facile synthesis strategy.
Gold nanostructures have attracted great interest in biomedical applications.21,22 Owing to their strong absorption in the near infrared (NIR) region and outstanding photothermal conversion capacity, gold nanostructures are suitable candidates for PTT.23–26 In addition, as a high-Z element, gold has a large X-ray attenuation coefficient, which enables it to perform CT enhancement.14,15 Moreover, by simple chemical modification gold nanostructures can be decorated with various functional groups, such as gadolinium compounds, to achieve MR imaging.
Here, as shown in Scheme 1, we introduced a multifunctional nanoagent based on triangular gold nanoprisms (TGP) decorated with gadopentetic acid (Gd–DTPA) by simple covalent bonding (denoted as TGP–PEG–Gd). The gold nanoconjugate was proved to display excellent performance in T1-weighted MR and CT enhancement and efficacy in photothermal therapy. Moreover, the nanoconjugate displayed negligible acute toxicity both in vitro and in vivo, which further confirmed its potential for medical applications in PTT guided by T1-weighted MR/CT dual-modality imaging.
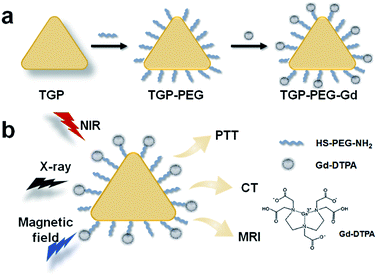 | ||
| Scheme 1 Schematic representation of the fabrication of TGP–PEG–Gd and PTT guided by T1-weighted MR/CT dual-modality imaging. | ||
Experimental
Materials
Hexadecyltrimethylammonium chloride (CTAC) was purchased from TCI (Shanghai, China). Hydrogen tetrachloroaurate trihydrate (HAuCl4·3H2O), potassium iodide (KI), L-ascorbic acid, N-(3-dimethylaminopropyl)-N′-ethylcarbodiimide hydrochloride (EDC), and N-hydroxysulfosuccinimide sodium salt (sulfoNHS) were purchased from Sigma-Aldrich (St. Louis, MO, USA). Sodium hydroxide (NaOH) was purchased from Sinopharm Chemical Reagent Co. Ltd (Shanghai, China). Phosphate-buffered saline (PBS) and cell counting kit-8 (CCK-8) were purchased from Keygen Biotech (China). Thiol–PEG–amine (HS–PEG–NH2, M.W. ≈ 1000 Da) was purchased from Laysan Bio Inc. Gd–DTPA was purchased from Guangzhou Consun Pharmaceutical Group Ltd (China). All chemicals were used without further treatment.Synthesis and purification of TGP
TGP was fabricated by seedless oxidative etching, as previously reported.27,28 Firstly, 240 μL of 25.4 mM HAuCl4 and 61 μL of 0.1 M NaOH were mixed to form solution A. Solution A was added to a 10 mL aqueous solution that contained 16 mM CTAC and 0.75 mM KI. Then, 100 μL of 64 mM ascorbic acid was injected into the resulting solution. Finally, 5 μL of 0.1 M NaOH was injected into the solution with rapid shaking. After the completion of the growth process, purification was carried out by adding 2.5 mL of 0.5 M CTAC to the system to purify TGPs from spherical by-products. After flocculation for 12 h, the supernatant was removed and the precipitates were redispersed in ultrapure water.Preparation of TGP–PEG–Gd
Firstly, 0.5 mL TGP solution with an absorbance of 3 O.D., 0.5 mL of 4 mM HS–PEG–NH2, and 4.5 mL ultrapure water were mixed and vortexed immediately. Then, the mixed solution was sonicated for 30 min to obtain amine-terminated PEGylated TGP, which was collected by centrifugation and redispersed in 1 mL ultrapure water.In addition, 4 mL of 0.1 M Gd–DTPA solution and 1.2 mL of 1 mg mL−1 NHS were added to 4.8 mL PBS buffer and stirred in the dark for 2 h. After the addition of 1.8 mL of 1 mg mL−1 EDC·HCl, the reaction mixture was stirred for 3–4 h in the dark. Finally, 1 mL of the as-prepared solution of amine-terminated PEGylated TGP was added and the mixed solution was stirred overnight in the dark. The solution was centrifuged to collect TGP–PEG–Gd.
Characterization of TGP–PEG–Gd
Transmission electron microscopy images were acquired with a JEOL JEM-2100 microscope (Japan). UV-vis spectra were recorded using a Lambda 35 UV-vis spectrophotometer (PerkinElmer Instruments, USA). Hydrodynamic diameters and zeta potentials were measured with a NanoBrook ZetaPlus zeta potential analyzer (Brookhaven Instruments, USA). Electron-dispersive X-ray (EDX) spectra were recorded using a Tecnai G2 F20 microscope (FEI, Hillsboro, OR) with an EDX detector system. MR images were captured using a 3.0 T MR scanner (MAGNETOM Trio, Siemens, Germany) at room temperature. T1 values were determined from the regions of interest in T1 map MR images. CT images were recorded using a dual-source CT system (Somatom Definition, Siemens Healthcare, Forchheim, Germany) with a slice thickness of 5 mm and a voltage of 120 kVp. The X-ray attenuation was measured in Hounsfield units (HU) on a dedicated workstation (Multi Modality Workplace, Siemens Medical Solutions, Erlangen, Germany). A 660 nm diode-pumped laser source was obtained from Hi-Tech Optoelectronics Co. Ltd (China). Infrared thermal images were acquired using an infrared camera (MAGNITY f15F1, Wuhan VST Light & Technology Co., Ltd (China)).Calculation of photothermal conversion efficiency
The photothermal conversion efficiency was calculated by a previously reported method29 according to the following equation:After the thermal input and output attained equilibrium, the value of hS could be determined according to the following equation:
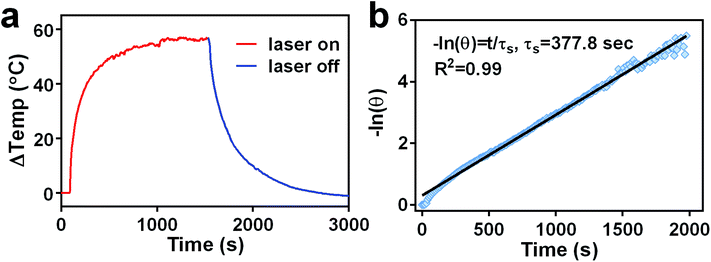
The value of τs was determined during the cooling stage using the following equation:
In vitro cell viability assays
The MDA-MB-231 human breast cancer cell line was chosen for in vitro studies. The cells were cultured in 96-well plates for 24 h. TGP–PEG–Gd was injected into the culture medium at concentrations ranging from 0.6 to 10 μg mL−1, and the cells were incubated for another 24 h. The cell viability was measured by assays with cell counting kit-8 (CCK-8) in accordance with the manufacturer's instructions. The cells were irradiated with an NIR laser (660 nm, 1.0 W cm−2, 5 min), followed by a CCK-8 assay to determine the phototherapeutic efficacy of the nanoconjugate.Evaluation of in vivo biocompatibility
Two groups of nude mice (6–8 weeks old, n = 3) were intravenously injected with 100 μL normal saline and a solution of TGP–PEG–Gd with an Au concentration of 100 μg mL−1, respectively. After 24 h, the mice were sacrificed and their major organs (including hearts, livers, spleens, lungs, and kidneys) were collected for staining with hematoxylin and eosin (H&E). The animal experiments were carried out in accordance with the guidelines of Jinling Hospital, Nanjing, China, and were approved by the Institutional Animal Care and Use Committee of Jinling Hospital.Results and discussion
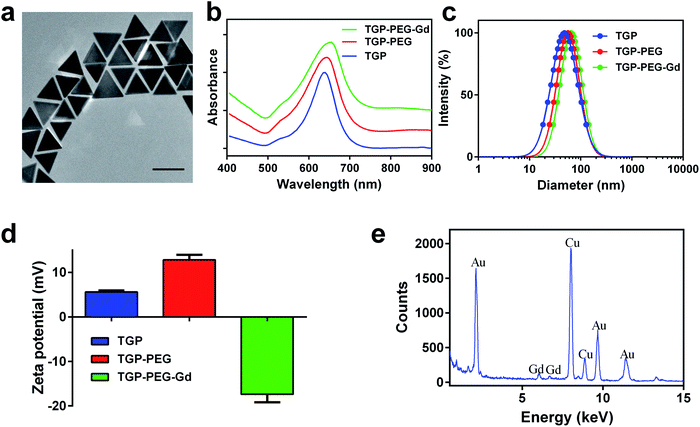
Bare TGP was synthesized by seedless oxidative etching, in which CTAC served as the surfactant. To enable photothermal therapy in the NIR region, the side length of TGP was adjusted to 80.4 ± 4.3 nm (Fig. 1a) by controlling the NaOH concentration. The corresponding localized surface plasmon resonance (LSPR) displayed a peak at 640 nm (Fig. 1b). Bare TGP exhibited a uniform triangular morphology and excellent monodispersity, as shown in the TEM image. The hydrodynamic diameter of bare TGP was determined to be 48.5 ± 1.2 nm by dynamic light scattering measurements (Fig. 1c), which was slightly smaller than the size measured by TEM. This deviation might be attributed to the fact that rotational diffusion of bare TGP was also recorded by DLS measurements (Fig. S1†). This phenomenon has also been reported for other anisotropic particles.26,30 The zeta potential of bare TGP was 5.59 ± 0.32 mV (Fig. 1d).To endow TGP with MR imaging ability, bare TGP was decorated with molecules of Gd–DTPA, which is a widely used commercial MR contrast agent. Firstly, HS–PEG–NH2 (M.W. ≈ 1000 Da) was introduced to obtain amino-functionalized PEGylated TGP (denoted as TGP–PEG). Next, Gd–DTPA was easily conjugated to TGP–PEG via the condensation reaction of amino groups and carboxyl groups (denoted as TGP–PEG–Gd). After conjugation, the UV-vis spectra exhibited a slight shift in the LSPR bands from 640 nm to 655 nm without obvious broadening of the peaks (Fig. 1b). The result suggested that TGP was successfully decorated with Gd–DTPA without obvious aggregation. The hydrodynamic diameter increased to 65.2 ± 1.5 nm (Fig. 1c) and the zeta potential was found to be −17.38 ± 1.79 mV (Fig. 1d) after decoration. The EDX spectrum clearly revealed signals of Au at 2.123, 9.712 and 11.440 keV and signals of Gd at 6.056 and 6.712 keV. The results further confirmed the successful conjugation of Gd–DTPA to TGP (Fig. 1e). The weight ratio of gold![[thin space (1/6-em)]](https://www.rsc.org/images/entities/char_2009.gif) :
:![[thin space (1/6-em)]](https://www.rsc.org/images/entities/char_2009.gif) gadolinium was measured to be 19.6
gadolinium was measured to be 19.6![[thin space (1/6-em)]](https://www.rsc.org/images/entities/char_2009.gif) :
:![[thin space (1/6-em)]](https://www.rsc.org/images/entities/char_2009.gif) 1 by ICP-AES.
1 by ICP-AES.
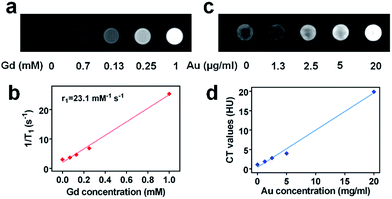
To illustrate the multimodal imaging capacity of TGP–PEG–Gd, we first investigated its ability to perform MR enhancement. T1-Weighted phantom MR images of solutions of TGP–PEG–Gd were captured with a 3.0 T clinical MR scanner. As shown in Fig. 2a, the intensity of the MR signal increased progressively as the concentration of TGP–PEG–Gd increased. The T1 relaxation rate (1/T1) was found to have a linear relationship with the concentration of TGP–PEG–Gd with a longitudinal relaxivity (r1) of 23.1 mM−1 s−1 (Fig. 2b). Thus, TGP–PEG–Gd exhibited excellent capacity for T1-weighted MR enhancement.
On the other hand, as gold has a higher X-ray attenuation coefficient than iodine, which is the most commonly used CT contrast element, it was expected that TGP–PEG–Gd could perform excellent CT enhancement. To investigate its enhancement ability, CT images of dispersions of TGP–PEG–Gd with various concentrations were captured. As shown in Fig. 2c, the CT attenuation of the solutions increased gradually with an increase in the concentration of TGP–PEG–Gd. By a linear fit of the values of the CT attenuation with the concentrations of TGP–PEG–Gd, the X-ray attenuation coefficient was calculated to be 959.3 HU L g−1 (Fig. 2d). The relatively high longitudinal relaxivity and X-ray attenuation coefficient indicated the potential use of TGP–PEG–Gd as a multimodal imaging enhancement medium.
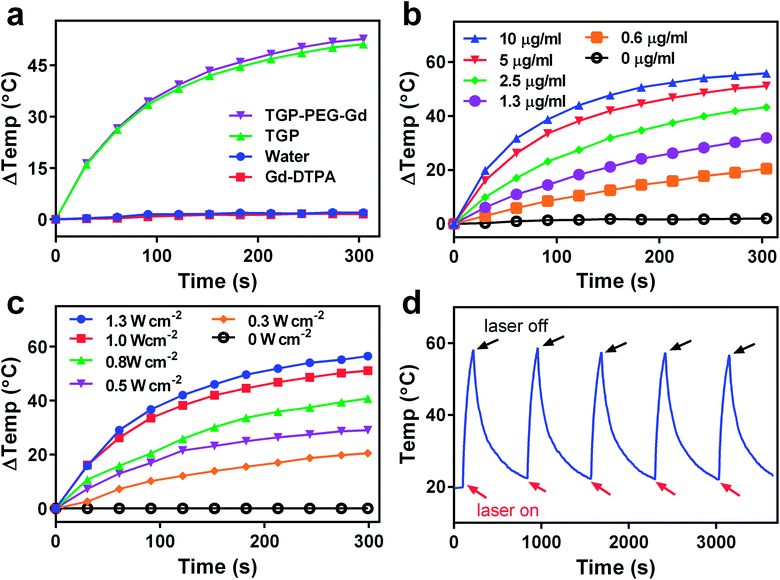
Because photothermal conversion efficiency is critical for performing PTT, the photothermal performance of TGP–PEG–Gd was tested systematically. Under irradiation with a 660 nm laser at 1.0 W cm−2, solutions of TGP and TGP–PEG–Gd underwent rapid heating by similar amounts of 51.2 °C and 52.7 °C, respectively (Fig. 3a). The rises in temperature were sufficient for tumour ablation. Spherical gold nanoparticles (GNP) of a similar size with the same optical density were used as controls. For comparison with TGP and TGP–PEG–Gd, even though the LSPR of GNP was around 520 nm, we used the same NIR laser to irradiate the GNP solution. However, the GNP solution only underwent a rise in temperature of less than 10 °C (Fig. S2†). The Gd–DTPA solution and ultrapure water exhibited a negligible rise in temperature. Thus, the photothermal conversion was mediated by TGP and conjugation would not impair its photothermal performance. In addition, the heating curves of solutions of TGP–PEG–Gd at various concentrations and powers of the laser used for irradiation revealed that the photothermal conversion was dependent on the concentration and laser power (Fig. 3b and c, S3†). Moreover, the excellent photostability of TGP–PEG–Gd was proved by its stable photothermal conversion capacity after five heating–cooling cycles (Fig. 3d). The photothermal conversion efficiency of TGP–PEG–Gd was calculated to be 68.7% by a previously reported method (Fig. 4).
To evaluate the potential of TGP–PEG–Gd for PTT, the therapeutic efficacy of the nanoconjugate was determined using MDA-MB-231 cells. The cells were incubated with TGP–PEG–Gd at different concentrations for 24 h, followed by a CCK-8 assay. Without laser irradiation, TGP–PEG–Gd gave rise to negligible impairment of the viability of MDA-MB-231 cells. Up to 95.3% of cells survived even at the highest concentration used in the assay (Fig. 5a), which indicated that the nanoconjugate itself was harmless to the cells. However, after irradiation with an NIR laser (660 nm at 1.0 W cm−2 for 5 min), as shown in Fig. 5b, a noticeable amount of cell death was revealed by the CCK-8 assay. When the concentration of TGP–PEG–Gd was 10 μg mL−1, only 12.6% of MDA-MB-231 cells survived after irradiation. The above results collectively suggest that TGP–PEG–Gd possesses excellent photothermal therapeutic efficacy and biocompatibility in vitro.
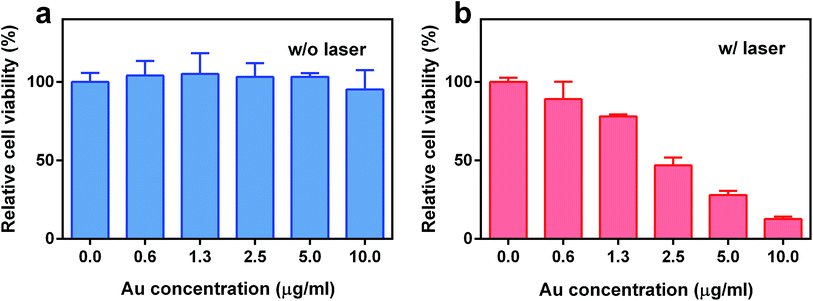 | ||
| Fig. 5 Relative viability of MDA-MB-231 cells treated with TGP–PEG–Gd (a) without and (b) with irradiation (660 nm, 1.0 W cm−2, 5 min). | ||
To further demonstrate the potential of TGP–PEG–Gd for biomedical applications, the in vivo biocompatibility of the nanoconjugate was assessed. Two groups of mice were intravenously injected with 100 μL normal saline and a solution of TGP–PEG–Gd with an Au concentration of 100 μg mL−1, respectively. After 24 h, the mice were sacrificed and their major organs (including hearts, livers, spleens, lungs, and kidneys) collected for histopathological examination. Notably, the organs in both groups retained their normal histological morphology, and no obvious tissue damage or inflammation was observed (Fig. 6). The results proved that TGP–PEG–Gd possesses negligible acute toxicity in vivo at the given concentration.
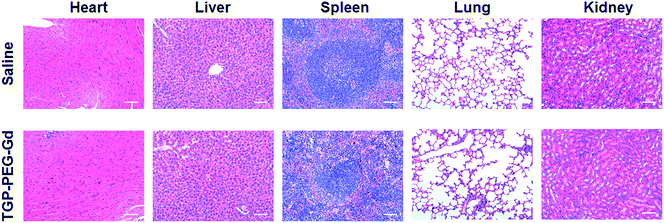 | ||
| Fig. 6 H&E staining images of mouse organs 24 h after injection of saline or a solution of TGP–PEG–Gd (scale bar: 50 μm). | ||
Conclusions
In summary, a multifunctional platform based on triangular gold nanoprisms was constructed via a facile protocol. By decoration with Gd–DTPA, the as-prepared TGP–PEG–Gd was endowed with magnetic properties and T1-weighted MR contrast ability. Owing to the high X-ray absorption coefficient of gold, TGP–PEG–Gd could effectively serve as a CT contrast medium. In addition, TGP–PEG–Gd exhibited high photothermal conversion efficacy, which provided the nanoconjugate with high capability for PTT. Moreover, TGP–PEG–Gd exhibited excellent biocompatibility both in vitro and in vivo. Our results suggest that TGP–PEG–Gd holds considerable promise in the use of PTT guided by MR/CT dual-modality imaging for cancer treatment. The concept of in vitro theranostics may hopefully be extended to in vivo animal experiments in further investigations.Acknowledgements
This research is supported by the National Key Basic Research Program of the P. R. China (Program No. 2014CB744504), the National Natural Science Foundation of China (Program No. 81501588, 81601555 and 81601556), and the Natural Science Foundation of Jiangsu Province (Program No. BK20140734 and BK20160017).References
- M. Aioub, S. R. Panikkanvalappil and M. A. El-Sayed, ACS Nano, 2017, 11, 579–586 CrossRef CAS PubMed.
- H. Lin, X. Wang, L. Yu, Y. Chen and J. Shi, Nano Lett., 2017, 17, 384–391 CrossRef CAS PubMed.
- G. Feng, Y. Fang, J. Liu, J. Geng, D. Ding and B. Liu, Small, 2017 DOI:10.1002/smll.201602807.
- R. Singh and S. V. Torti, Adv. Drug Delivery Rev., 2013, 65, 2045–2060 CrossRef CAS PubMed.
- J. Kim, J. Kim, C. Jeong and W. J. Kim, Adv. Drug Delivery Rev., 2016, 98, 99–112 CrossRef CAS PubMed.
- H. S. Han, K. Y. Choi, H. Lee, M. Lee, J. Y. An, S. Shin, S. Kwon, D. S. Lee and J. H. Park, ACS Nano, 2016, 10, 10858–10868 CrossRef CAS PubMed.
- Z. Li, J. Liu, Y. Hu, K. A. Howard, Z. Li, X. Fan, M. Chang, Y. Sun, F. Besenbacher, C. Chen and M. Yu, ACS Nano, 2016 DOI:10.1021/acsnano.6b05427.
- Y. Cai, P. Liang, Q. Tang, X. Yang, W. Si, W. Huang, Q. Zhang and X. Dong, ACS Nano, 2017, 11, 1054–1063 CrossRef CAS PubMed.
- Y. W. Chen, Y. L. Su, S. H. Hu and S. Y. Chen, Adv. Drug Delivery Rev., 2016, 105, 190–204 CrossRef CAS PubMed.
- Z. Chen, P. Zhao, Z. Luo, M. Zheng, H. Tian, P. Gong, G. Gao, H. Pan, L. Liu, A. Ma, H. Cui, Y. Ma and L. Cai, ACS Nano, 2016, 10, 10049–10057 CrossRef CAS PubMed.
- W. P. Li, C. H. Su, L. C. Tsao, C. T. Chang, Y. P. Hsu and C. S. Yeh, ACS Nano, 2016, 10, 11027–11036 CrossRef CAS PubMed.
- L. Zhang, H. Su, J. Cai, D. Cheng, Y. Ma, J. Zhang, C. Zhou, S. Liu, H. Shi, Y. Zhang and C. Zhang, ACS Nano, 2016, 10, 10404–10417 CrossRef CAS PubMed.
- W. Chen, J. Ouyang, H. Liu, M. Chen, K. Zeng, J. Sheng, Z. Liu, Y. Han, L. Wang, J. Li, L. Deng, Y. N. Liu and S. Guo, Adv. Mater., 2016 DOI:10.1002/adma.201603864.
- Y. Hu, R. Wang, S. Wang, L. Ding, J. Li, Y. Luo, X. Wang, M. Shen and X. Shi, Sci. Rep., 2016, 6, 28325 CrossRef CAS PubMed.
- Y. Tian, S. Luo, H. Yan, Z. Teng, Y. Pan, L. Zeng, J. Wu, Y. Li, Y. Liu, S. Wang and G. Lu, J. Mater. Chem. B, 2015, 3, 4330–4337 RSC.
- H. Zhang, H. Wu, J. Wang, Y. Yang, D. Wu, Y. Zhang, Y. Zhang, Z. Zhou and S. Yang, Biomaterials, 2015, 42, 66–77 CrossRef CAS PubMed.
- J. H. Kim, S. W. Park, S. C. Kim, M. K. Lim, T. Y. Jang, Y. J. Kim, Y. H. Kang and H. Y. Lee, Korean J. Radiol., 2015, 16, 566–574 CrossRef PubMed.
- L. Cheng, S. Shen, S. Shi, Y. Yi, X. Wang, G. Song, K. Yang, G. Liu, T. E. Barnhart, W. Cai and Z. Liu, Adv. Funct. Mater., 2016, 26, 2185–2197 CrossRef CAS PubMed.
- G. Yang, H. Gong, T. Liu, X. Sun, L. Cheng and Z. Liu, Biomaterials, 2015, 60, 62–71 CrossRef CAS PubMed.
- L. Cheng, C. Yuan, S. Shen, X. Yi, H. Gong, K. Yang and Z. Liu, ACS Nano, 2015, 9, 11090–11101 CrossRef CAS PubMed.
- R. Bardhan, S. Lal, A. Joshi and N. J. Halas, Acc. Chem. Res., 2011, 44, 936–946 CrossRef CAS PubMed.
- L. Dykman and N. Khlebtsov, Chem. Soc. Rev., 2012, 41, 2256–2282 RSC.
- S. Wang, Z. Teng, P. Huang, D. Liu, Y. Liu, Y. Tian, J. Sun, Y. Li, H. Ju, X. Chen and G. Lu, Small, 2015, 11, 1801–1810 CrossRef CAS PubMed.
- S. Wang, Y. Tian, W. Tian, J. Sun, S. Zhao, Y. Liu, C. Wang, Y. Tang, X. Ma, Z. Teng and G. Lu, ACS Nano, 2016, 10, 8578–8590 CrossRef CAS PubMed.
- S. Wang, P. Huang, L. Nie, R. Xing, D. Liu, Z. Wang, J. Lin, S. Chen, G. Niu, G. Lu and X. Chen, Adv. Mater., 2013, 25, 3055–3061 CrossRef CAS PubMed.
- X. Ma, Y. Cheng, Y. Huang, Y. Tian, S. Wang and Y. Chen, RSC Adv., 2015, 5, 81682–81688 RSC.
- L. Chen, F. Ji, Y. Xu, L. He, Y. Mi, F. Bao, B. Sun, X. Zhang and Q. Zhang, Nano Lett., 2014, 14, 7201–7206 CrossRef CAS PubMed.
- L. Scarabelli, M. Coronado-Puchau, J. J. Giner-Casares, J. Langer and L. M. Liz-Marzan, ACS Nano, 2014, 8, 5833–5842 CrossRef CAS PubMed.
- D. K. Roper, W. Ahn and M. Hoepfner, J. Phys. Chem. C, 2007, 111, 3636–3641 CAS.
- H. Liu, N. Pierre-Pierre and Q. Huo, Gold Bull., 2012, 45, 187–195 CrossRef CAS.
Footnote |
| † Electronic supplementary information (ESI) available. See DOI: 10.1039/c7ra01101f |
| This journal is © The Royal Society of Chemistry 2017 |


