
 Open Access Article
 This Open Access Article is licensed under a
 Creative Commons Attribution 3.0 Unported Licence
Gum karaya (Sterculia urens) stabilized zero-valent iron nanoparticles: characterization and applications for the removal of chromium and volatile organic pollutants from water†
Vellora Thekkae Padil Vinod *a,
Stanisław Wacławeka,
Chandra Senanb,
Jaroslav Kupčíkc,
Kristýna Peškováa,
Miroslav Černík*a and
H. M. Somashekarappad
*a,
Stanisław Wacławeka,
Chandra Senanb,
Jaroslav Kupčíkc,
Kristýna Peškováa,
Miroslav Černík*a and
H. M. Somashekarappad
aCentre for Nanomaterials, Advanced Technologies and Innovation, Technical University of Liberec, Studentská 1402/2, 461 17 Liberec, Czech Republic. E-mail: vinod.padil@tul.cz; vinodvellorathekkaepadil@gmail.com; miroslav.cernik@tul.cz
bCentre for Water Soluble Polymers, Applied Science, Engineering and Computing, Glyndwr University, Wrexham LL11 2AW, Wales, UK
cInstitute of Inorganic Chemistry of the Czech Academy of Sciences, v. v. i., Husinec-Řež, 1001, 250 68 Řež, Czech Republic
dCARRT, Mangalore University, India-574 199
First published on 2nd March 2017
Abstract
This paper illustrates a method for the stabilization of nanoscale zerovalent iron (NZVI) suspensions with a “green” biopolymer, Gum Karaya (GK). The stability, sedimentation, aggregation behavior and reactivity towards Cr(VI) and volatile organic compounds using NZVI–GK (GK stabilized NZVI) and bare NZVI, were assessed. The stabilization mechanism of NZVI–GK was demonstrated using ATR-FTIR, XRD, XPS, TEM, SEM, TGA and particle size analysis. The NZVI–GK nanoparticle suspension was found to be stable for at least three months, suggesting a superior stability rendering property of GK which forms a scaffold to prevent NZVI from aggregating. Batch experiments, centred on Cr(VI) reduction and degradation of volatile organic compounds, confirmed that NZVI–GK was more reactive than bare NZVI. Furthermore, XPS and ICP-MS results revealed that Cr(VI) was reduced to Cr(III) by NZVI–GK and the remaining Cr(III) in solution was adsorbed onto GK, thereby completely removing chromium from the contaminated water. Our study suggests that an important role is played due to the attributes of GK (which include non-toxicity, biodegradability and cost-effectiveness) in conjunction with the ability of NZVI to remove all chromium viz. [Cr(VI) and Cr(III)] coupled with the total degradation and removal of VOCs (cis-1,2-dichloroethene, perchloroethene and trichloroethene) from water.
1. Introduction
Nanoscale Zero-Valent Iron (NZVI) has been studied as a prospective innovative technology for the remediation of contaminated water and soil for decades. The high reactivity of NZVI towards a broad range of contaminants such as chlorinated organic compounds (chlorinated methanes, ethanes, ethenes, chlorinated aromatic compounds and pesticides); heavy metals; radioactive nuclides; nitro aromatic compounds; nitrates; dyes and phenol has been reported extensively.1–3The major problems facing remediation technology employing NZVI are its susceptibility to aggregation, limited mobility in the subsurface environment and longevity under such conditions.3 To be effectively utilised in aquifer (in situ) remediation, NZVI should remain in suspension for long periods, allowing for slurry preparation, handling and injection into the contaminated site. Furthermore, mobility of NZVI's in the subsurface is the key element governing effective remediation of the contaminated site. However, many studies have demonstrated that the stability and mobility of NZVI was restricted due to the strong tendency of NZVI particles to aggregate in aqueous environments which resulted in lower specific surface area and subsequently in reduced reactivity.4,5 Additionally, the mobility of NZVI can be constrained due to interaction between iron particles and soil grains, causing NZVI deposition onto the porous matrix.3 Many studies have proposed solutions for overcoming the problems of stability and mobility of NZVI in porous media and the requirement is for modification of the surface properties of NZVI using a combination of natural and engineered polymers, together with surfactants, thereby enhancing colloidal stability and NZVI mobility in porous media.6,7 Various natural and synthetic polymeric materials such as guar gum, xanthan gum, starch, agar agar, poly(acrylic acid) (PAA), Tween-20, polyelectrolytes (polystyrene sulphonate and polyaspartate), organic matter and CMC have been used to improve the stability, reactivity and mobility of NZVI in porous media.8–16 These polymers can interact with NZVI particles and prevent aggregation by reducing particle–particle attractive forces which can increase repulsion between the particles and the porous medium.3 Important properties such as stabilizing capacity and shear thinning exhibited by xanthan gum deemed the latter to be a suitable material for NZVI particle mobility and aggregation studies.17 The first applications of NZVI in contaminated fields were conducted by injecting non-stabilized particles at a concentration of 1 g L−1 but the results were unsatisfactory.18 The enhancement of electrosteric and kinetic properties of NZVI in the presence of both guar gum and xanthan gum have been reported.8,12 Modification and stabilization of NZVI using natural gums such as guar gum and xanthan gum were shown to be effective in improving colloidal stability, reactivity and mobility of NZVI.3 Furthermore, the viscosity of the overall mixture was found to have increased at higher concentrations of guar gum, thereby limiting sedimentation of NZVI and hindering particle aggregation by virtue of reducing the frequency of collisions among particles, owing to the shear-thinning behavior of this gum.17
Gum Karaya (GK), a natural hydrocolloid gum obtained from the karaya tree has been used as a food additive and pharmaceutical ingredient for centuries. The importance of polymeric surfactants based on natural hydrocolloids is increasing due to their non-toxicity, biodegradability, availability and superior physico-chemical properties. GK (Sterculia urens), a rhamno-galacturonoglycan (pectic) type gum, is a partially acetylated polysaccharide, with a branched structure and a high molecular mass of 16 × 106 Da.19,20 GK, a commercial tree gum, is widely used as a food additive and pharmaceutical ingredient, as well as an agent for promoting emulsification, stabilization and thickening.19 The properties, structural arrangement and composition of GK solutions have been studied extensively,21,22 neutral sugars such as rhamnose, galactose, arabinose and acidic sugar moieties of uronic acids (galacturonic and glucuronic) being the main constituents.23 The presence of various functional groups (viz. sugars, proteins, lipids and tannin) are indicative of its usefulness as a natural bio-sorbent.23,24 Hydroxyl (–OH) groups present in arabinose and rhamnose and carboxylic (COOH) groups found in glucuronic acid play a crucial role in the binding of toxic metal ions (e.g. Hg2+) from aqueous solutions to the gum biopolymer structure.25
For effective contaminant remediation by NZVI, it is imperative that a stable, well dispersed and highly concentrated NZVI suspension (with enhanced mobility and reactivity in the porous media) is developed. To achieve these objectives, extensive laboratory experiments and rigorous field tests should be performed. The major points to be addressed in this study relate to selecting the most appropriate stabilizing agent. Adoption of a stabilization approach will help to reduce particle aggregation; aid the development of biodegradable and environmentally-friendly polymeric surfactants as stabilizing agents and lead to an improvement in the mobility and reactivity of NZVIs.
In light of the above perspectives, a natural, tree-based polymer such as GK was chosen as the stabilizing agent for NZVI. A detailed investigation of the NZVI–GK composite was carried out in order to evaluate the changes in stability, particle aggregation and reactivity towards Cr(VI) and volatile organic compounds (VOCs) viz. cis-1,2-dichloroethene (cis-1,2-DCE), perchloroethene (PCE) and trichloroethene (TCE) that are present in ground water from the Pisecna location (Czech Republic).
2. Materials and methods
2.1. Materials
Commercial gum karaya (GK), K2CrO4, 1,5-diphenylcarbazide, HCl, HNO3 and NaOH were purchased from Sigma-Aldrich, USA. Deionised water (18.2 MΩ cm−1) was prepared by an ELGA purelab flex system (ELGA, Veolia Water, Marlow, UK) and used in all experiments. NANOFER STAR (air – stable NZVI powder consisting of an iron oxide layer) was purchased from NANO IRON, s.r.o., Czech Republic. Polluted groundwater was taken from the Pisecna location (Czech Republic). Water from the location was taken from a depth of 10 meters beneath the ground surface; collected in 20 litre cylinders; transferred to the laboratory and stored at 4 °C under anoxic conditions. The contaminant composition was determined prior to the tests; (cis-1,2-DCE: 378 μg L−1; PCE: 18![[thin space (1/6-em)]](https://www.rsc.org/images/entities/char_2009.gif) 530 μg L−1; TCE: 13040 μg L−1, respectively).26
530 μg L−1; TCE: 13040 μg L−1, respectively).26
2.2. Purification of gum karaya (GK)
GK powder was purified by dissolution, filtration and dialysis as reported earlier.20 The estimated molar mass distributions (weight average, Mw; number average, Mn and z-average, Mz) and rms radius moments (Rn, Rw and Rz, all in nm) of GK (1.827 × 10⁶ g mol−1) was determined using GPC/MALLS and fitted with first-order polynomials using the Zimm method as reported.202.3. Activation of NANOFER STAR
Nanoparticles of zero-valent iron, produced by unique technology of the NANO IRON, s.r.o. company, exhibited an average particle size of 50–100 nm; an average surface area of 20–25 m2 g−1; a narrow particle size distribution of 20–100 nm and a high iron content in the range of 80–90 wt%. NANOFER STAR (NF) was produced and delivered in a form of dry powder with a surface protective oxide shell that required activation prior to application. Standard activation protocols are based on preparation of the 20% slurry (20 g of air-stable NZVI NF STAR dispersed in 100 mL of distilled water). The whole mixture was homogenized and dispersed for 2 min using a IKA ULTRA-Turrax basic T 25 powder mixer at 15000 rpm and left for approximately 48 hours at room temperature without additional mixing. The solution was mixed again as described above. After the activation process, the slurry was diluted to obtain the final concentration for the experiment. During activation, the NANOFER STAR's surface washes and disintegrates and in so doing, the Fe(0) becomes available for reduction.
2.4. Preparation of NZVI–GK nanoparticle suspension
Activated NZVI particles (200.0 g L−1) with purified GK (20.0 g L−1) were mixed in various wt/wt ratios (1:1, 1:2 and 1:3 of GK and NZVI, respectively) to produce NZVI–GK suspensions. The latter were again blended for 10 min and finally sonicated for the same duration. The solution pH of the NZVI–GK slurry was adjusted with 1.0 N NaOH or HCl, respectively.
2.5. Characterization of NZVI–GK nanoparticles
:1, 1:2 and 1:3 ratios of wt/wt concentrations of 200 g L−1 (NZVI) to 20 g L−1 (GK) and various amounts of Cr(VI) from 5.0–100 mg L−1 were added. The suspensions was stirred vigorously for finite reaction periods (10 min to 3 h) with the pH (2–10) being adjusted by 0.1 M HCl or NaOH. Aliquots of the samples were taken at designated time intervals, centrifuged and filtered using 0.45 μm filters. The ensuing filtered solutions were later analyzed.In addition, the vials were transferred to the CombiPAL autosampler (CTC Analytics AG, Switzerland) of the Varian CP-3800 Gas Chromatograph (GC)/Saturn 2200 ion trap mass spectrometer. The headspace analytical technique was used for determination of VOCs. Samples were incubated in the autosampler at defined temperatures, times and agitation intensities. The autosampler conditions adopted were as follows: syringe temperature, 90 °C; agitator temperature, 80 °C and incubation time of the sample in the agitator, 5 min. After the establishment of interfacial (vapour–liquid) equilibrium, the samples were withdrawn by the autosampler needle from the headspace vials and injected into the GC system. The capillary column used (60 m in length, 0.32 mm in diameter and 1.8 μm in film thickness) was equipped with a VF-624ms and procured from Agilent Technologies. The temperature programme of the GC commenced at 50 °C (4 min) at a heating rate of 8 °C min−1. The final temperature of 220 °C was maintained for 4.75 min. Helium was employed as the carrier gas with a flow rate of 1.0 mL min−1. Calibration was undertaken utilizing an external standard method by preparing known concentrations of VOCs. To accomplish this, EPA 502/524.2 VOC Mix 200 μg mL−1 in methanol (Sigma-Aldrich Company, USA) was used. Calibration was performed by measuring the calibration solutions at a minimum of five concentration levels in the range of linear response of the detector.
3. Results and discussion
3.1. SEM/EDX analysis
Morphologies of GK, NZVI, NZVI–GK as well as Cr adsorbed NZVI–GK were analyzed using SEM and their corresponding EDX profiles are presented in Fig. 1 which shows the EDX analysis of GK representing the various elements present (viz. Ca, Na, Mg, Al and Cl) in GK. Lyophilized GK, with observable fibrous structures (inset Fig. 1a), can easily interact with NZVI to form a NZVI–GK composite (Fig. 1c) and NZVI particles were found inside the network of GK scaffolds. The NZVI particles (20–100 nm in diameter) with particular characteristics were observed (Fig. 1b). The EDXA profile shows Fe peaks (Fig. 1c) while the Cr/NZVI–GK composite exhibits extremely rough surfaces, possibly due to interaction of NZVI–GK with Cr to bring about a surface precipitation reaction between chromate and iron ions (Fig. 1d). The EDX sketch furnishes the adsorbed Cr peaks on the surface of NZVI–GK (inset Fig. 1d). | ||
| Fig. 1 SEM images of (a) lyophilized sample of GK, (b) NZVI, (c) NZVI–GK composite and (d) Cr-adsorbed NZVI–GK and their corresponding EDX profiles. | ||
3.2. TEM and HRTEM analysis
The core–shell structure consisting of a core layer of Fe0 and a shell layer of iron oxides was observed in bare NZVI (Fig. 2c). Fig. 2b clearly indicated that NZVI particles were stabilized on the GK network structure, and that the particle size was ∼20–100 nm. Compared with bare NZVI particles, NZVI on the GK polymer dispersed homogeneously. These effects were due to the inhibiting effect of GK on NZVI aggregation. Fig. 1b showed that the NZVI particles were not simply mixed or blended with GK. Instead, they were protected on the GK network structure as depicted in Fig. 5. Selected area diffraction patterns (inset Fig. 2a & b) were suggested the formation of crystalline structures of NZVI in the bare NZVI as well as in NZVI–GK composite. A TEM image of the NZVI particles revealed that bare NZVI was aggregated with iron nanoparticles, resulting from magnetic interactions between NZVI particles (Fig. 2a). Association of GK with NZVI particles reduced the magnetic interactions between them. The HRTEM image of the NZVI particles (Fig. 2c) illustrated an apparent iron oxide layer formed on the surface of the bare NZVI. However, no distinct iron oxide layer could be discerned on the surface of the NZVI–GK (Fig. 2d). Clear lattice fringes in the HRTEM images of NZVI–GK (Fig. 2d) implied the generation of crystalline NZVI particles. | ||
| Fig. 2 TEM images of (a) bare NZVI, (b) NZVI–GK stabilized particles, and inset figures of (a) and (b) representing the selected area of diffraction patters of nanoparticles, which suggests the polycrystalline structures of NZVI. HRTEM mirographs of (c) bare NZVI and, (d) NZVI–GK stabilized nanoparticles. | ||
3.3. Particle size analysis
Particle size distributions of bare NZVI and NZVI–GK analyzed by CPS are presented in Fig. 3. The mean particle sizes of bare NZVI particles were found to be 770, 920, 1090, 1260 and 2010 nm, respectively for the blank and the samples after one week, two weeks, one month and three months storage at room temperature (Fig. 3a). However, the comparative mean particle sizes of NZVI–GK were 730, 730, 870, 870 and 1240 nm, respectively for the blank and the samples (stored for and under identical conditions to the ones mentioned above) (Fig. 3b). Clearly, the NZVI–GK appeared to be more stable in comparison with the bare NZVI particles and the particle size measurements corresponded with TEM analytical data (Fig. 2a and b). Particle size measurement data obtained by CPS methods and TEM analysis were found to vary by ±10–20%, as reported earlier.28 | ||
| Fig. 3 Particle size distributions of (a) bare NZVI and (b) NZVI–GK particles after one week, one month and three months storage under room temperature. | ||
3.4. Sedimentation experiments
To further examine aggregation capabilities of GK, NZVI and the NZVI–GK composite, at various designated times (viz. 0, 5 min, 30 min, one week, one month and three months) the respective sedimentation tests were performed as presented in Fig. 4a–c. The bare NZVI particles started to settle at the bottom of the tube after 30 min and completely precipitated after one week (Fig. 4b). In contrast, the NZVI–GK particles remained in suspension even after three months, without any sedimentation or flocculation occurring (Fig. 4c). It was observed that NZVI–GK particles remained stable even after 3 months, as determined by particle size analysis (Fig. 3). | ||
| Fig. 4 Sedimentation experiments with (a) GK, (b) bare NZVI and (c) NZVI–GK particles for 0, 5 min, 30 min, one week, one month and there months storage periods under room temperatures. | ||
3.5. Zeta potential analysis
The surface potential charges of GK, NZVI and NZVI–GK particles were determined using zeta potential (ζ) analysis. The ζ values for GK, NZVI and NZVI–GK particles were found to be −40 ± 1, +0.74 ± 0.4 and −23 ± 0.5 mV respectively at pH 7. The magnitude of the surface potential generally determines the level of electrostatic repulsion between particles. The NZVI particles were slightly positive at pH 7 while GK registered a zeta potential −40 ± 1 mV, indicating a highly negative surface charge. Furthermore, the most important properties of GK as a stabilizing agent are as follows: nontoxicity, biodegradability, high viscosity and extensively available functional groups such as –OH, –CO–, CH3CO– and –COOH.24,25 A low zeta potential is a useful advantage in groundwater remediation processes. In normal environmental conditions, the mobility of the NZVI particles is restricted due to the positive charge and attraction towards aquifer materials resulting in limited mobility in ground water.29,30 In combination with GK, the NZVI particle surface charges became more negative (ζ = −23 ± 0.5 mV at pH = 7) and this could enhance the mobility of NZVI–GK in ground water. Moreover, highly negatively charged surroundings were provided by the dissociation of carboxylic acid groups present in the GK and the steric repulsion due to the latter's high molecular mass.253.6. Interaction between GK and NZVI
The major advantages of selecting gum karaya for the stabilization of NZVI are due to its properties such as biodegradability, non-toxicity, inexpensiveness and wide availability. GK provides NZVI with stability via surface charge/electrosteric stabilization. The high molecular weight of GK (1.827 × 10⁶ g mol−1) induces steric hindrance arising from bulky moieties of the GK that resist interparticle interactions of the NZVI by counteracting particle–particle attractive forces leading to limited particle aggregation. In addition, GK contains multiple functional groups e.g. carbonyl (CO–), hydroxyl (OH) and carboxylic acid (COOH) entities, by virtue of which it functions as a stabilizer, emulsifier and thickener. Negative surface charges (ζ = −40 ± 1 mV), molecular structures and high densities of charged functional groups all increase the likelihood of GK interacting with NZVI. The resulting stabilization enhances the dispersion of NZVI particles by adsorption of charged GK molecules to the core metal. This creates an electrical double layer and culminates in coulombic repulsion between the GK–NZVI particles. Furthermore, the elevated molecular weight and high degree of substitution of GK with varieties of functional groups (viz. OH, –COO, –CO and –CH3CO) produce well dispersed NZVI particles with narrow size distribution ranges. Besides, GK has proved to be an effective adsorbent of toxic heavy metals and nanoparticulates due to various mechanisms such as ion-exchange, surface precipitation, chemisorption and physisorption.24,25,31In the present study, we have demonstrated that GK bound to the surface of NZVI facilitates the formation of gel networks through hydrogen bonding and polymer entanglements, thereby preventing particle agglomeration. In addition, bidentate bridging (between GK and NZVI via the carboxylic group) resists aggregation through both electrostatic and steric repulsion (Fig. 5). Inherent properties of higher viscosity, molecular weight and the variety of functional groups present in the GK polymer all aid in stabilizing NZVI, thus arresting the particle aggregation processes. The current interpretations and overviews are compared with latest developments concerning numerous polymers such as CMC, xanthan gum, guar gum and starch, all used for the stabilization of NZVI.8,12,32–36
 | ||
| Fig. 5 The schematic presentation of NZVI interaction with GK polymer to form NZVI–GK. | ||
3.7. Cr(VI) reduction
Fig. 6 displays the kinetic profiles of Cr(VI) obtained when various concentrations of both NZVI and NZVI–GK were mixed with Cr(VI) solutions at an initial concentration of 10 mg L−1. As apparent in Fig. 6, there is a fast reduction of Cr(VI) by NZVI and NZVI–GK. After 30 minutes of reaction time, the complete removal of Cr(VI) up to 10 mg L−1 of the initial concentration (with the use of NZVI–GK at a dosage of 1 g L−1) was observed. Furthermore, it was observed that NZVI–GK exhibited greater degradation efficiency towards Cr(VI) in comparison to bare NZVI added at the same dosage. One of the possible explanations for this phenomenon could be the fact that in addition to enhancing NZVI longevity, GK can serve as an electron donor (reducing agent) for many oxidation/reduction reactions and even help stabilize metal or metal oxide nanoparticles, as reported in the literature.25,37,38 However, introduction of GK alone did not cause significant Cr(VI) reduction (data not shown). Additionally, GK's wide range of functional groups can enhance contaminant sorption more efficiently compared to bare NZVI, consequently promoting the reductive action of NZVI in juxtaposition with GK.39 However, ICP analysis confirmed that a part of the total Cr was adsorbed onto the surface of NZVI. Although GK alone has not contributed significantly to the decrease in chromium concentration in the presented timeframe, NZVI–GK has shown tremendous improvement in the removal of the total Cr [Fig. 7]. | ||
| Fig. 6 Chromium(VI) decontamination with NZVI and NZVI–GK (Cr(VI) = 10 ppm, temp. = 23 °C, stirring rate = 200 rpm, n = 3). | ||
 | ||
| Fig. 7 Total chromium decontamination with GK, NZVI and NZVI–GK (Cr conc. = 10 mg L−1, GK conc. = 0.5 g L−1, NZVI conc. = 1 g L−1, NZVI–GK conc. = 1 g L−1, temp. = 23 °C, stirring rate = 200 rpm, n = 3). | ||
The residual total Cr concentration was determined to be higher than the residual Cr(VI) concentration in the experiment. This indicates that there was Cr(III) present in the solution due to the reduction of Cr(VI) to Cr(III) by interaction of Cr(VI) with NZVI–GK. The present data clearly shows that Cr(VI) was reduced to Cr(III) by NZVI–GK and that the residual Cr(III) in the solution was adsorbed onto the GK functional groups. This result was also confirmed by XPS analysis (Fig. 10). Furthermore, our findings are in agreement with Cr(VI) reduction using many renewable, economical adsorbents such as gum kondagogu, Cupressus lusitanica bark, chitosan stabilized NZVI and pectin stabilized NZVI.37,40–43
3.8. Degradation of PCE, TCE and cis-1,2-DCE
It can be observed that stabilized and unstabilized NZVI can readily decrease the concentration of selected pollutants (Fig. 8). The reduction of chlorinated aliphatics by NZVI takes place mainly by β-elimination.44 The mechanism was established by calculating the chlorine number (please see below). Only negligible concentrations of vinylchloride (VC) were detected during the tests with NZVI. As mentioned earlier, β-elimination is the main NZVI dechlorination mechanism. However, the latter does not contribute to the formation of TCE, DCE and VC. | ||
| Fig. 8 Removal of VOCs (perchloroethene (PCE), trichloroethene (TCE) and cis-1,2-DCE (cis-1,2-dichloroethene)) from effluent at the Pisecna site with GK, NZVI and NZVI–GK (temp. = 23 °C, GK conc. = 0.5 g L−1, NZVI conc. = 5 g L−1, NZVI–GK conc. = 5 g L−1). | ||
Furthermore, to estimate the importance of direct removal, calculation of the chlorine number was undertaken.45 The chlorine number (weighted average number of Cl atoms per molecule of ethene) of the groundwater ranged from 3.1 to 4 during the experimental period (ESI Fig. S1†). The chlorine number remained almost constant without showing any decrease which proves that (i) simultaneous degradation of all chlorinated hydrocarbons has occurred and (ii) no lower chlorinated hydrocarbons had been formed. The fluctuations of the chlorine number are attributable to a low measured concentration of some ethenes (close to the detection limit).
The sum of chlorinated hydrocarbon concentrations (in the blank test) was observed not to have decreased more than 15%. According to the literature from many sources the major product of reductive dechlorination is ethene (an alkene that was not measured in this study).46 Moreover, chlorine number calculations (as described earlier) have confirmed the complete dechlorination of contaminants without significant formation of less chlorinated hydrocarbons. This can be elucidated by the fact that NZVI serves as an efficacious electron donor from the iron surface to the hydrocarbon for reductive dehalogenation of VOCs. Similar to work presented by Fu et al.,47 the degradation ability of VOCs by surface modified NZVI can significantly increase in comparison to conventional NZVI. Moreover, large differences in degradation efficacy towards chlorinated hydrocarbons (as well as chromium) suggest that stabilization with GK can enhance not only the NZVI surface reactivity per unit area but also increase the sorption area of the resultant nanoparticles.
3.9. NZVI-biopolymer stabilization and degradation of environmental pollutants
Table 1 summarizes comparative results of different biopolymers used for the stabilization of NZVI and their efficiencies towards the degradation of the pollutants.16,35,43,48–60 Extensive studies have demonstrated that both polymers and surfactants are effective in inhibiting NZVI aggregation and enhancing mobility in the subsurface for emplacement. The major factors which influence stabilization of NZVI, namely surface modification, emulsification and conjugation with polymer, have also proved able to provide protection to NZVI against aggregation and surface oxidation, in addition to promoting transport in subsurface environments. The stabilization methods not merely increase the mobility but also the reactivity of NZVI towards hazardous/toxic environmental contaminants. It is difficult to categorically state that a particular biopolymer is the best one, both to stabilize the NZVI and to enhance its ability to speedily degrade environmental pollutants. However, with regard to the biodegradability, non-toxicity and economic viability of these natural products (coupled with their physicochemical characteristics that confer stability to NZVIs) there is no doubt that the sustainability of natural polymer stabilized NZVIs would be highly sought after, in the field of environmental remediation. It has been observed that polymer stabilized NZVIs have a higher degradation efficiency, compared to non-stabilized NZVIs, towards the various pollutants (Table 1) tested. For example, Cr(VI) removal efficiency of CMC-stabilized NZVI is approximately four times higher than non-stabilized NZVI.51 Similarly, trichloroethylene degradation efficiency of CMC-stabilized bimetallic NZVI/Pd was reported to be 17 times higher than its non-stabilized counterparts, in terms of TCE degradation rate constants.57 The use of MZVI (microsized zerovalent nanoparticles) rather than NZVI has been reported.48,49 The major benefits of using MZVI rather than NZVI are the lower costs (1/20 to 1/3 for MZVI compared to NZVI), lower corrosion rates (10 to 30 times lower than NZVI) and easier handling of microsized particles compared to nanosized ones.59| Stabilizing agent | Optimum concentration of NZVI-stabilized polymer (g L−1) | Type of pollutants | Initial concentration of pollutants (mg L−1) | Removal efficiency (%) | Reference |
|---|---|---|---|---|---|
| a mZVI = micro size zerovalent iron particles, NA – not analysed. | |||||
| Guar gum (GG) | 10 (mZVI-GG)a | Perchloroethylene (PCE) | 3.5 | 94 | 48 |
| Trichloroethylene (TCE) | 0.7 | 96 | 48 | ||
| cis-Dichloroethene (cDCE) | 0.5 | 100 | 48 | ||
| Xanthan gum (XG) | 10 (mZVI-XG)a | Trichloroethylene (TCE) | 10 | 30.3 | 49 |
| Xanthan gum-Brij-35/Pd/Fe | 1.0 | Polychlorinated biphenyls (PCB) | 46.3 | 50 | 50 |
| Agar-agar | 1.0 | Trichloroethylene (TCE) | 10 | 100 | 16 |
| Carboxyl methyl (CM) cellulose | 0.15 | Cr(VI) | 10 | 100 | 51 |
| CM-cellulose | 0.3 | As(III) | 0.25–10 | 35.6 | 52 |
| 0.3 | As(V) | 0.25–10 | 38.2 | 52 | |
| CM-cellulose | NA | Perchloroethylene (PCE) | 9.6 | 80 | 53 |
| Trichloroethylene (TCE) | 15 | 100 | 53 | ||
| Chitosan | 5 | Cr(VI) | 20 | 82 | 54 |
| 0.2 | Cr(VI) | 40 | 74.0 | 43 | |
| Chitosan fiber | 0.18 | As(III) | 0.01 to 5 | >80 | 35 |
| As(V) | >80 | 35 | |||
| Calcium alginate | NA | Nitrate (NO3−) | 100 | 73 | 55 |
| Starch | NA | Trichloroethylene (TCE) | 25 | 98 | 56 |
| Polychlorinated biphenyls (PCB) | 2.5 | 80 | 56 | ||
| Starch | NA | Tetracycline (TC) | 500 | 99 | 57 |
| Cellulose acetate | NA | Trichloroethylene (TCE) | 80 | 53 | 58 |
| GK (gum karaya) | 1.0 | Cr(VI) | 10 | 100 | Present study |
| 5.0 | Trichloroethene (TCE) | 13.0 | 100 | Present study | |
| 5.0 | Perchloroethene (PCE) | 18.5 | 100 | Present study | |
| 5.0 | cis-1,2-Dichloroethene (c DCE) | 0.37 | 100 | Present study | |
3.10. XRD analysis
XRD patterns of GK, NZVI, NZVI–GK, and Cr/NZVI–GK are presented in Fig. 9. GK is amorphous in nature and there were no peaks observed in its XRD pattern (Fig. 9). The presence of NZVI–GK was confirmed by strong peaks at 2θ = 44.7° corresponding to the (110) plane of Fe0 nanoparticles, suggesting that GK stabilized NZVI via air oxidation (Fig. 9). Similar observations were reported for chitosan stabilized NZVI.41 The XRD patterns of the Cr/NZVI–GK composite showed peaks at γ-Fe2O3 (2θ = 36°), Fe3O4 (2θ = 36/57/62.5°) and Cr2FeO4 (2θ = 35.50°) after Cr interaction with NZVI–GK, suggesting the possible occurrence of redox reactions between NZVI and Cr(VI). These results were supported by XPS analysis where Cr(VI) is reduced to Cr(III) during the interaction between Cr(VI) with NZVI–GK in which the NZVI particles acted as the reductant. Similar findings were reported for NZVI supported multi-walled carbon nanotubes for the removal of Cr(VI) from waste water.60 | ||
| Fig. 9 XRD patterns of (a) bare NZVI, (b) Cr/NZVI–GK, (c) NZVI–GK and (d) GK. | ||
3.11. X-ray photoelectron analysis
The XPS technique is a useful tool for characterizing the ligand effect in transition metal complexes and electron-donating ligands will lower the binding energy (BE) of the core-level electrons while electron-withdrawing ligands will do the reverse. The technique is also employed to identify the existence of a particular element in a material and to distinguish the different oxidation states of the same element.61 The XPS survey scan (Fig. 10) shows the binding energy peaks of carbon and oxygen in GK and in the case of NZVI–GK, the Fe 2p spectrum for Fe(0). The 2p3/2 peak is centred at a binding energy of 710.2 eV while the 2p1/2 peak has a BE of 732.8 eV, representing γ-Fe2O3.62–65 The satellite peak at 706.69 eV suggests that Fe(0) is present on the surface of the NZVI–GK composite.63,65 The XPS spectra for GK, before and after metal adsorption of total chromium, are shown in Fig. 10. As can be seen from the spectra, the XPS survey scans for GK show binding energy peaks characteristic of carbon and oxygen. The spectrum of the metal adsorbed onto GK indicates the presence of chromium (Fig. 10c) on the surface of the polymer, obviously after metal biosorption. This is in addition to carbon and oxygen. High-resolution narrow scans of C 1s core-level spectra of GK samples before and after metal adsorption comprise three peaks corresponding to binding energies of 284.59, 286.36 and 288.29 eV – assigned to C–H, C–O and C![[double bond, length as m-dash]](https://www.rsc.org/images/entities/char_e001.gif) O that were identified via the deconvolution.66,67 The observed C 1s binding energy peaks were assigned to the C–C, C–O and CO functional groups present in GK. This is in agreement with the observations made by ATR-FTIR (Fig. 11). The peaks for C–O and CO can be assigned to hydroxyl and carboxylate groups present in GK. The O 1s high-resolution narrow scans could be deconvoluted into binding energy peaks at 531.8 and 532.7 eV which can be ascribed correspondingly to the O in the CO and alcoholic C–O groups. The CO group may be present due to the carboxylate groups inherent in GK. Chromium adsorbed onto GK was also analyzed by XPS to confirm the presence of Cr and its oxidation states.
O that were identified via the deconvolution.66,67 The observed C 1s binding energy peaks were assigned to the C–C, C–O and CO functional groups present in GK. This is in agreement with the observations made by ATR-FTIR (Fig. 11). The peaks for C–O and CO can be assigned to hydroxyl and carboxylate groups present in GK. The O 1s high-resolution narrow scans could be deconvoluted into binding energy peaks at 531.8 and 532.7 eV which can be ascribed correspondingly to the O in the CO and alcoholic C–O groups. The CO group may be present due to the carboxylate groups inherent in GK. Chromium adsorbed onto GK was also analyzed by XPS to confirm the presence of Cr and its oxidation states.
 | ||
| Fig. 10 X-ray photoelectron spectroscopy of (a) GK – full survey showing the major oxygen (1s) and carbon (1s) peaks, (b) NZVI–GK composite and (c) Cr/NZVI–GK. | ||
 | ||
| Fig. 11 ATR-FTIR characterization of (a) GK, (b) NZVI–GK and (c) Cr/NZVI–GK. | ||
Low-resolution XPS spectra of the Cr-free GK indicated that apart from C and O, there were no significant contributions from other elements associated with the GK structure. High-resolution spectra of the Cr-loaded NZVI–GK revealed that there were significant inputs from the Cr bound onto the NZVI–GK (Fig. 10c). Significant bands appeared at binding energies of 578 and 587 eV, the former corresponding to the Cr 2p3/2 orbital, the latter to the 2p1/2 orbital. The deconvoluted binding energy peaks for Cr 2p3/2 at 578.2 eV and Cr 2p1/2 at 587.4 eV were assigned to Cr2O3 for Cr3+ compounds while Cr6+ displayed characteristic peaks at higher binding energies (viz. 580.6 and 589.7 eV) ascribed to Cr 2p3/2 at 578.2 eV and Cr 2p1/2, respectively.68–70 Thus, the spectra for Cr adsorbed onto NZVI–GK implied the existence of Cr3+ on the surface of NZVI–GK. The presence of Cr6+ on the GK structure is also feasible, although no sorption of Cr6+ onto GK was observed during the degradation tests. It was previously reported that Cr6+ could be bound to an oat by-product which was easily reduced to Cr3+ by positively charged functional groups and subsequently adsorbed by the available carboxyl groups.71 Sheng et al.72 found that Cr6+ was completely reduced to Cr3+ by contact with the biomass of the brown seaweed Ecklonia below pH 5. XPS spectra of Cr-bound GK revealed that most of the Cr-bound on the surface of GK was in the Cr3+ state. This was confirmed by ICP analysis. Murphy et al.73 showed that Cr binding altered the relative quantities of carbonyl and alcohol groups in seaweed biomass polysaccharides, thus underscoring the importance of these functional groups in binding and reduction of Cr6+ to Cr3+. The XPS methods demonstrate that metal ion interactions with GK in several forms involve various changes in the metal oxidation state, as well as in the chemical state of the reactive sites of GK.
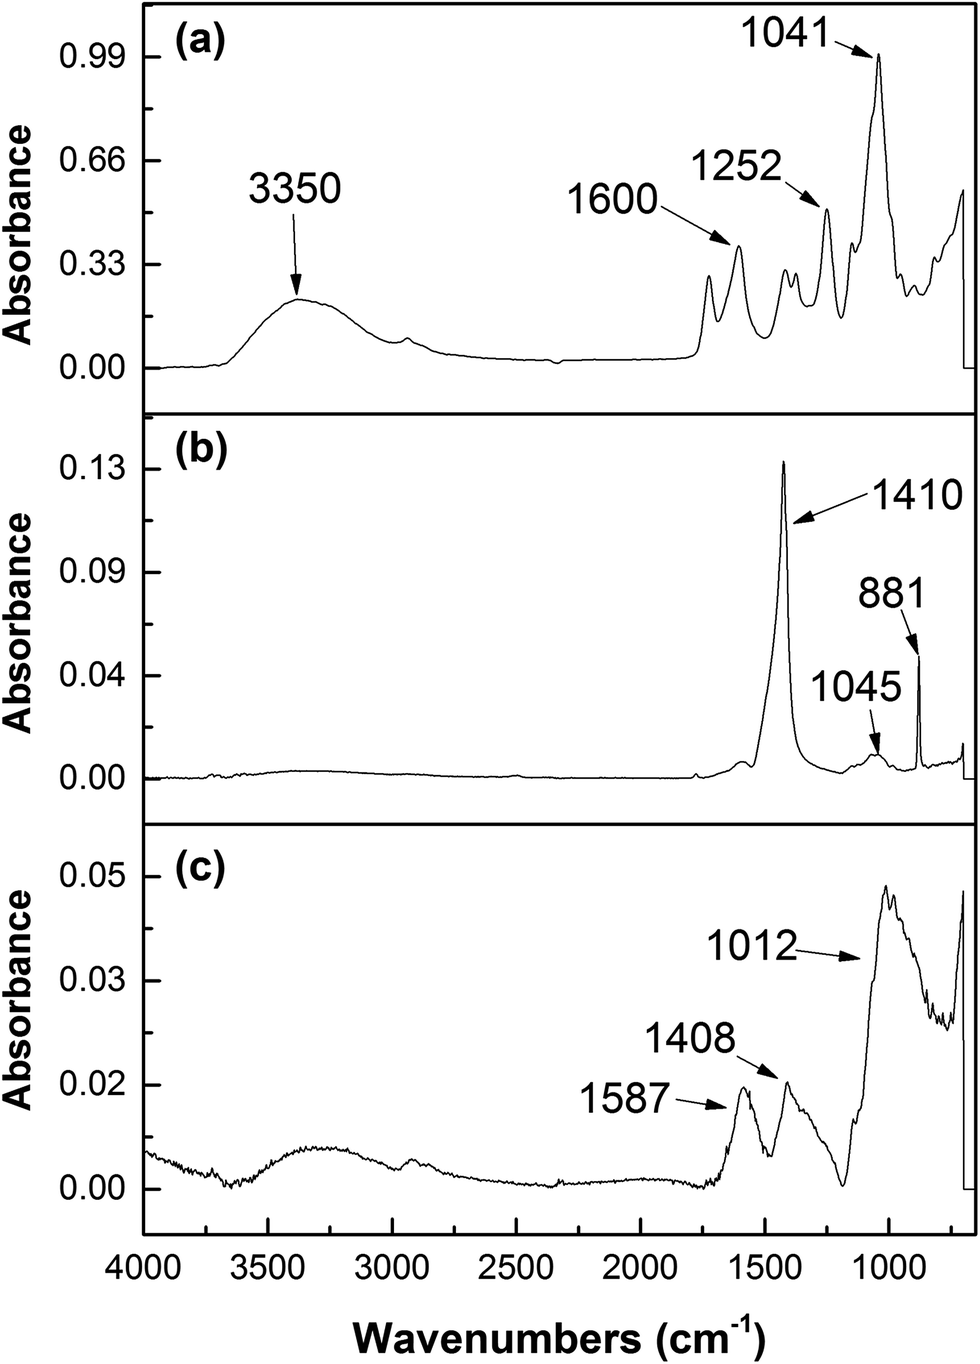
3.12. ATR-FTIR analysis
To identify the functional groups that participate in NZVI–GK chemistry, FTIR characterization was carried out. High intensity peaks in the region of 1040 cm−1 could be ascribed to the binding of NZVI particles onto the surface of the GK matrix (Fig. 11b).The intensity of O–H stretching at 3359 cm−1 for the NZVI–GK composite (Fig. 11b) was lower than that for the native structure of GK (Fig. 11a). The peaks at 1721 cm−1 and 1252 cm−1 (CH3CO group) present in the GK spectra shown (in Fig. 11a) were also displayed by NZVI–GK (Fig. 11b) suggesting that the acetyl groups played an important role in the formation of the NZVI–GK composite. Another peak shift (from 1408 cm−1 to 1370 cm−1) was observed in the case of NZVI–GK, implying that both the carbonyl and hydroxyl functional groups of GK had a strong affinity to bind onto the NZVI nanoparticles. The lower peak at 1600 cm−1 in NZVI–GK (compared to the peak for GK) indicated that the negatively charged COO− groups bound to positive sites on the surface of the NZVI. FTIR spectra for Cr-NZVI–GK (Fig. 11c) revealed perceptible changes (compared to that shown by NZVI–GK) implying that Cr adsorption had taken place. The spectra comprised two new peaks at 774 and 904 cm−1, attributed respectively to the Cr–O and CrO bonds (from the Cr species) suggesting that Cr was adsorbed onto the surface of NZVI–GK, as has previously been reported for Cr adsorption onto chitosan/Fe(II)/PVA nanofibers and cross-linked xanthated chitosan.74,75
3.13. Thermal analysis
Fig. 12 displays the thermal decomposition profiles of the GK and NZVI–GK particles, respectively. After heating beyond 250 °C, weight loss occurred sharply and GK appeared to have decomposed completely when the temperature exceeded 700 °C (Fig. 12). On the other hand, over the same temperature range, the NZVI–GK particles yielded more than 60% of the initial weight. The remaining residue of the NZVI–GK can be attributed mainly to the iron based species developed on the GK scaffold. The thermal decomposition behaviour of GK is in close agreement with that exhibited by gum arabic – a natural biopolymer, very similar to the GK.76 In the case of GK–NZVI, a weight loss of ∼35% was observed at ∼300 °C, due to the decomposition of GK but no further weight loss occurred. By means of TG analysis, approximately 65% of the NZVI particles were estimated to be located in the NZVI–GK composite. This result was corroborated by thermal analysis data of chitosan stabilized NZVI in the literature.41 | ||
| Fig. 12 TGA curves of GK and NZVI–GK, indicating thermal decomposition from 100–800 °C under nitrogen atmosphere. | ||
4. Conclusions
In this study it was demonstrated that using 10 g L−1 of GK, a “green” tree polysaccharide could stabilize NZVI particles at a concentration of 200 g L−1 in the mixture (comprising a 1:1 GK:NZVI ratio) over a duration of three months. No aggregation or sedimentation of stabilized NZVI particles was observed. The improved reactivity of the NZVI–GK composite towards Cr reduction and degradation of VOCs was found to be superb in comparison to the bare NZVI particles. Furthermore, XPS and ICP-MS results revealed that Cr(VI) was reduced to Cr(III) by NZVI–GK and the Cr(III) remaining in solution was adsorbed onto the GK polymer. Thus the total removal of chromium from the contaminated water was achieved. The work presents GK as an inexpensive and environmentally friendly material for NZVI stabilization that can adequately serve large scale remediation of contaminated water and soil.
Conflict of interests
The authors declare no conflict of interests.Acknowledgements
The research reported in this paper was financially supported by the Ministry of Education, Youth and Sports in the framework of the targeted support of the “National Programme for Sustainability I” (LO 1201) and the OPR&DI project “Extension of CxI facilities” (CZ.1.05/2.1.00/19.0386). The authors also acknowledge the assistance provided by the Research Infrastructure NanoEnviCz, supported by the Ministry of Education, Youth and Sports of the Czech Republic under Project No. LM2015073.Notes and references
- D. O'Carroll, B. Sleep, M. Krol, H. Boparai and C. Kocur, Adv. Water Resour., 2013, 51, 104 CrossRef.
- R. A. Crane and T. B. Scott, J. Hazard. Mater., 2012, 211–212, 112 CrossRef CAS PubMed.
- T. Tosco, M. P. Papini, C. C. Viggi and R. Sethi, J. Cleaner Prod., 2014, 77, 10 CrossRef CAS.
- T. Tosco, M. Coisson, D. Xue and R. Sethi, in Nanoparticles Featuring Electromagnetic properties: From Science To Engineering, ed. A. Chioerio and P. Allia, Research Signpost, Kerala, 2012, pp. 201–223 Search PubMed.
- F. He and D. Y. Zhao, Environ. Sci. Technol., 2005, 39, 3314 CrossRef CAS PubMed.
- N. Saleh, T. Phenrat, K. Sirk, B. Dufour, J. Ok, T. Sarbu, K. Matyjaszewski, R. D. Tiilton and G. V. Lowry, Nano Lett., 2005, 5, 2489 CrossRef CAS PubMed.
- N. D. Berge and C. A. Ramsburg, Environ. Sci. Technol., 2009, 43, 5060 CrossRef CAS PubMed.
- A. Tiraferri, K. L. Chen, R. Sethi and M. Elimelech, J. Colloid Interface Sci., 2008, 324, 71 CrossRef CAS PubMed.
- E. Dalla Vecchia, M. Luna and R. Sethi, Environ. Sci. Technol., 2009, 43, 8942 CrossRef CAS PubMed.
- H. Dong and I. M. C. Lo, Water Res., 2013, 47, 419 CrossRef CAS PubMed.
- M. M. Krol, A. J. Oleniuk, C. M. Kocur, B. E. Sleep, P. Bennett, Z. Xiong and D. M. O'Carroll, Environ. Sci. Technol., 2013, 47, 7332 CrossRef CAS PubMed.
- S. Comba, D. Dalmazzo, E. Santagata and R. Sethi, J. Hazard. Mater., 2011, 185, 598 CrossRef CAS PubMed.
- D. Xue and R. Sethi, J. Nanopart. Res., 2012, 14, 1239 CrossRef.
- T. L. Kirschling, P. L. Golas, J. M. Unrine, K. Matyjaszewski, K. B. Gregory, G. V. Lowry and R. D. Tilton, Environ. Sci. Technol., 2011, 45, 5253 CrossRef CAS PubMed.
- F. Gastone, T. Tosco and R. Sethi, J. Colloid Interface Sci., 2014, 421, 33 CrossRef CAS PubMed.
- M. Velimirovic, D. Schmid, S. Wagner, V. Micic, F. von der Kammer and T. Hofmann, Sci. Total Environ., 2015, 563–564, 713 Search PubMed.
- S. Comba and R. Sethi, Water Res., 2009, 43, 3717 CrossRef CAS PubMed.
- D. W. Elliott and W. X. Zhang, Environ. Sci. Technol., 2001, 35, 4922 CrossRef CAS PubMed.
- D. Verbeken, S. Dierchx and K. Dewettinck, Appl. Microbiol. Biotechnol., 2003, 63, 10–21 CrossRef CAS PubMed.
- V. T. P. Vinod, C. Senan and M. Černík, Dodecenyl succinic anhydride derivatives of gum karaya (Sterculia urens), J. Agric. Food Chem., 2015, 63, 3757 CrossRef PubMed.
- D. M. W. Anderson, C. G. A. McNab, C. G. Anderson, P. M. Braown and M. A. Pringuer, International Tree Crops Journal, 1982, 2, 147 CrossRef.
- D. Le Cerf, F. Irinei and G. Muller, Carbohydr. Polym., 1990, 13, 375 CrossRef CAS.
- A. C. F. Brito, M. R. Sierakowski, F. Reicher, J. P. A. Feitosa and R. C. M. de Paula, Food Hydrocolloids, 2005, 19, 861 CrossRef.
- V. T. P. Vinod and M. Černík, Int. J. Nanomed., 2013, 8, 889 Search PubMed.
- V. T. P. Vinod, R. B. Sashidhar, N. Sivaprasad, U. V. M. Sarma, N. Satyanarayana, R. Kumaresan, T. Nagaeswara Rao and P. Raviprasad, Desalination, 2011, 272, 270 CrossRef CAS.
- S. Wacławek, J. Nosek, L. Cádrová, V. Antoš and M. Černík, Ecol. Chem. Eng. S, 2015, 22, 4 Search PubMed.
- HACH, DR/2400 Method 8023, Chromium, hexavalent(1,5-diphenyl carbohydrazide method), Laboratory manual, Standard Methods for the Examination of Water and Wastewater, Loveland, CO, 5th edn, 2008 Search PubMed.
- D. J. Fyfe, Rapid, automated and cost-effective analyses of hexavalent chromium for WEEE/RoHS using the Varian Cary 50 UV-Vis Microplate Reader System, Varian Inc, 2014, application note 00533 Search PubMed.
- Y. P. Sun, X.-Q. Li, W.-X. Zhang and H. P. Wang, Colloids Surf., A, 2007, 308, 60–66 CrossRef CAS.
- W. Stumm and J. J. Morgan, Aquatic chemistry, John Wiley & Sons, New York, 3rd edn, 1996 Search PubMed.
- V. V. T. Padil and M. Černík, J. Hazard. Mater., 2016, 287, 102 CrossRef PubMed.
- X. Zhao, W. Liu, Z. Cai, B. Han, T. Qian and D. Zhao, Water Res., 2016, 100, 245 CrossRef CAS PubMed.
- T. Phenrat, N. Saleh, K. Sirk, H. J. Kim, R. D. Tilton and G. V. Lowry, J. Nanopart. Res., 2008, 10, 795 CrossRef CAS.
- R. Singh and V. Misra, Handbook of nanoparticles, Springer Int. Publishing, Switzerland, 2015 Search PubMed.
- N. Sakulchaicharoen, D. M. O'Carroll and J. E. Herrera, J. Contam. Hydrol., 2010, 118, 117 CrossRef CAS PubMed.
- A. Tiraferri and R. Sethi, J. Nanopart. Res., 2009, 11, 635 CrossRef CAS.
- V. T. P. Vinod, R. B. Sashidhar and B. Sreedhar, J. Hazard. Mater., 2010, 178, 851 CrossRef CAS PubMed.
- V. V. T. Padil, S. Wacławek and M. Cernik, Ecol. Chem. Eng. S, 2016, 23, 533 CAS.
- V. V. T. Padil, N. H. A. Nguyen, A. Sevcu and M. Cernik, J. Nanomater., 2015, 750726, DOI:10.1155/2015/750726.
- A. R. Netzahuati-Munoz, Md. C. Cristiani-Urbina and E. Cristiani-Urbina, PLoS One, 2015, 10, e0137086 Search PubMed.
- N. Horzum, M. M. Demir, M. Nairat and T. Shahwan, RSC Adv., 2013, 3, 7828 RSC.
- D. Chen, K. Yang, H. Wang, J. Zhou and H. Zhang, RSC Adv., 2015, 5, 65068 RSC.
- B. Geng, Z. Jin, T. Li and X. Qi, Sci. Total Environ., 2009, 407, 4994 CrossRef CAS PubMed.
- M. Tobiszewski and J. Namieśnik, Environ. Sci. Pollut. Res. Int., 2012, 19, 1994 CrossRef CAS PubMed.
- J. Němeček, P. Pokorný, O. Lhotský, V. Knytl, P. Najmanová, J. Steinová, M. Černík, A. Filipová, J. Filip and T. Cajthaml, Sci. Total Environ., 2016, 563, 822 CrossRef PubMed.
- L. Di Palma, P. De Filippis, D. Lausdei and E. Petrucci, Environ. Eng. Manage. J., 2015, 14, 2713 Search PubMed.
- F. Fu, D. D. Dionysiou and H. Liu, J. Hazard. Mater., 2014, 267, 194 CrossRef CAS PubMed.
- M. Luna, F. Gastone, T. Tosco, R. Sethi, M. Velimirovic, J. Gemoets, R. Muyshond, H. Sapion, N. Klaas and L. Bastiaens, J. Contam. Hydrol., 2015, 181, 46 CrossRef CAS PubMed.
- J. Xin, J. Han, X. Zheng, H. Shao and O. Kolditz, J. Environ. Manage., 2015, 150, 420 CrossRef CAS PubMed.
- G. Fan, L. Cang, W. Qin, C. Zhou, H. I. Gomes and D. Zhou, Sep. Purif. Technol., 2013, 114, 64 CrossRef CAS.
- Q. Wang, H. Qian, Y. Yang, Z. Zhang, C. Naman and X. Xu, J. Contam. Hydrol., 2010, 114, 35 CrossRef CAS PubMed.
- M. Mosaferi, S. Nemati, A. Khataee, S. Nasseri and A. A. Hashemi, J. Environ. Health Sci. Eng., 2014, 12, 74 CrossRef PubMed.
- F. He, D. Zhao and C. Paul, Water Res., 2010, 44, 2360 CrossRef CAS PubMed.
- T. Liu, L. Zhao, D. Sun and X. Tan, J. Hazard. Mater., 2010, 184, 724 CrossRef CAS PubMed.
- A. N. Bezbaruah, S. Krajangpan, B. J. Chisholm, E. Khan and J. J. Elorza Bermudez, J. Hazard. Mater., 2009, 166, 1339 CrossRef CAS PubMed.
- F. He and D. Zhao, Environ. Sci. Technol., 2005, 39, 3314 CrossRef CAS PubMed.
- Y. Fu, L. Peng, Q. Zeng, Y. Yang, H. Song, J. Shao, S. Liu and J. Gu, Chem. Eng. J., 2015, 270, 631 CrossRef CAS.
- L. Wu, M. Shamsuzzoha and S. M. C. Ritchie, J. Nanopart. Res., 2005, 7, 469 CrossRef CAS.
- M. Velimirovic, L. Carniato, Q. Simons, G. Schoups, P. Seuntjens and L. Bastiaens, J. Hazard. Mater., 2014, 270, 18 CrossRef CAS PubMed.
- X. Lv, J. Xu, G. Ji and X. Xu, Chemosphere, 2011, 85, 1204 CrossRef CAS PubMed.
- L. Dambies, C. Guimon, S. Yiacoumis and E. Guibal, Colloids Surf., A, 2001, 177, 203 CrossRef CAS.
- R. M. Cornell and U. Schwertmann, The Iron Oxides: Structure, Properties, Reactions, Occurrences and Uses, Wiley-VCH. Weinheim, 2nd edn, 2003 Search PubMed.
- G. S. Allen, M. T. Curtis, A. J. Hooper and P. M. Tucker, Dalton Trans., 1974, 14, 1525 RSC.
- K. Asami and K. Hashimoto, Corros. Sci., 1977, 17, 559 CrossRef CAS.
- J. T. Nurmi, P. G. Tratnyek, V. Sarathy, D. R. Baer, J. E. Amonette, K. Pecher, C. Wang, J. C. Linehan, D. W. Matson, R. Lee Penn and M. D. Driessen, Environ. Sci. Technol., 2005, 39, 1221 CrossRef CAS PubMed.
- L. H. Dubois, B. R. Zegarski and R. G. Nuzzo, Langmuir, 1986, 2, 412 CrossRef CAS.
- M. Wuhn, J. Weckesser and C. Woll, Langmuir, 2001, 17, 7605 CrossRef.
- E. Frydman, H. Cohen, R. Maoz and J. Sagiv, Langmuir, 1997, 13, 5089 CrossRef CAS.
- X. Q. Li, J. Cao and W. X. Zhang, Ind. Eng. Chem. Res., 2008, 47, 2131 CrossRef CAS.
- B. A. Manning, J. R. Kiser, H. Kwon and S. R. Kanel, Environ. Sci. Technol., 2007, 41, 586 CrossRef CAS PubMed.
- J. L. Gardea-Torresdey, K. J. Tiemann, V. Armendariz, L. Bess-Oberto, R. R. Chianelli, J. Rios, J. G. Parsons and G. Gamez, J. Hazard. Mater., 2000, 80, 175 CrossRef CAS PubMed.
- P. X. Sheng, Y. P. Ting, J. P. Chen and L. Hong, J. Colloid Interface Sci., 2004, 275, 131 CrossRef CAS PubMed.
- V. Murphy, S. A. M. Tofail, H. Hughes and P. McLoughlin, Chem. Eng. J., 2009, 148, 425 CrossRef CAS.
- D. Chauhan, J. Dwivedi and N. Sankararamakrishnan, RSC Adv., 2014, 4, 54694 RSC.
- N. Sankararamakrishnan, A. Dixit, L. Iyengar and R. Sanghi, Bioresour. Technol., 2006, 97, 2377 CrossRef CAS PubMed.
- S. S. Banerjee and D. H. Chen, J. Hazard. Mater., 2007, 147, 792 CrossRef CAS PubMed.
Footnote |
| † Electronic supplementary information (ESI) available. See DOI: 10.1039/c7ra00464h |
| This journal is © The Royal Society of Chemistry 2017 |