 Open Access Article
Achieving electroreduction of CO2 to CH3OH with high selectivity using a pyrite–nickel sulfide nanocomposite†
Siqi Zhao,
Sijie Guo,
Cheng Zhu,
Jin Gao,
Hao Li,
Hui Huang*,
Yang Liu* and
Zhenhui Kang *
*
Jiangsu Key Laboratory for Carbon-Based Functional Materials & Devices, Institute of Functional Nano & Soft Materials (FUNSOM), Soochow University, 199 Ren'ai Road, Suzhou, 215123, Jiangsu, PR China. E-mail: zhkang@suda.edu.cn; yangl@suda.edu.cn; hhuang0618@suda.edu.cn
First published on 5th January 2017
Abstract
Electrochemical reduction of carbon dioxide (CO2) to methanol (CH3OH) catalyzed by transition metals has been proved feasible and effective in aqueous electrolytes. In this work, we introduce a FeS2/NiS nanocomposite electrocatalyst synthesized by traditional hydrothermal method, which selectively reduces CO2 to CH3OH with an unprecedented overpotential of 280 mV and a high faradaic efficiency up to 64% at the potential of −0.6 V vs. reversible hydrogen electrode (RHE). The FeS2/NiS nanocomposite electrocatalyst exhibits a stable current density of 3.1 mA cm−2 over a 4 hour stability test. The high selectivity towards CO2 electroreduction to CH3OH may be attributed to the special ladder structure of the FeS2/NiS nanocomposite. The active sites are located at the interface between FeS2 and NiS which can effectively suppress the side reaction hydrogen evolution reaction and facilitate the CO2 reduction reaction.
Introduction
Electrochemical reduction of CO2 to carbon-containing fuels is a feasible process which is conducive to solving the serious environmental problems caused by excess CO2 such as iceberg melting, sea level rise and coastal delta subsidence.1–3 However, the main defects of electroreduction CO2 are the high overpotential required to drive the reaction, the low selectivity towards various products and the high cost of catalysts.4,5 The high overpotential increases the consumption of energy and makes it difficult to achieve the sustainable transformation of CO2. As for the selectivity, in addition to the major side reaction hydrogen evolution reaction (HER), the direct electroreduction of CO2 in aqueous solution is able to generate diversiform carbon-containing chemicals.5 The complex products increase the challenges towards generating target product. Transition metals are commonly proposed in CO2 reduction reaction (CO2RR) because of their vacant orbits and active d electrons.5 Among them, Au,6–9 Ag,1,10,11 and Pd12,13 have been explored comprehensively, while the expensive price limits the substantial application of noble metals in industry.14 Moreover, the main product from noble metals is carbon monoxide (CO), which leads to the second pollution at the cost of CO2 consumption.CH3OH, as an ideal chemical, is an important intermediate of paint, plastics, and other common products.15 Besides, CH3OH with high energy density can be stored as liquid under ambient conditions.16,17 The standard potential of CO2 electroreduction to CH3OH is only 0.016 V (vs. RHE). However, the 6 e− process of CO2 reduction to form CH3OH over the full reaction is kinetically unfavorable. Significant efforts towards selectively converting CO2 into CH3OH have been made since early 1983 over semiconductor materials (p-GaP and p-GaAs) with a low current density (<1 mA cm−2).18 Lately, Frese et al. firstly observed Teflon-supported Ru electrodes could selectively reduce CO2 to CH3OH with a low faradaic efficiency (FE) of 42%.19 Fe,20 Ni,21 Cu22 and their associated complexes23–26 have been widely investigated in the yield of CO2RR as their rich distribution and low cost. Among them, copper is demonstrated as the effective catalyst for the electroreduction of CO2 to hydrocarbon and alcohols.27,28 Le et al. reported that electrodeposited cuprous oxide thin films could directly reduce CO2 to CH3OH with a rate of 43 μmol cm−2 h−1 and low FE of 38%.29 Therefore, it is urgent to seek for a highly active, selective and effective catalyst towards electroreduction CO2 to CH3OH.
Herein, we fabricated a low-cost FeS2/NiS nanocomposite by traditional hydrothermal method as an excellent electrocatalyst. FeS2/NiS nanocomposite displays incomparable operation in its low overpotential of 280 mV and high selectivity with a CH3OH FE up to 64% at the potential of −0.6 V (vs. RHE). The stability test of FeS2/NiS nanocomposite was performed for 4 hours, showing a stable current density of 3.1 mA cm−2 at −0.6 V (vs. RHE). There is no obvious degradation of the electrocatalyst after the long-time test. The following experiments reveal the insight mechanism of CO2RR catalyzed by FeS2/NiS nanocomposite. As a comparison, we synthesized the single FeS2 and NiS nanocrystals and applied in CO2RR, respectively. The FeS2 nanocrystal shows a negative onset potential at −0.45 V (vs. RHE) and a maximum current density of 4.2 mA cm−2 at −0.68 V (vs. RHE). The NiS nanocrystal shows a more negative onset potential at −0.5 V (vs. RHE) and extremely low current density of 1.0 mA cm−2 at −0.68 V (vs. RHE). Therefore, it can speculate that the active sites of the catalyst towards the process locate at the interface of FeS2 and NiS. Besides, the FeS2/NiS nanocomposite with an average diameter of 14 nm greatly increases the specific surface areas and the number of active sites.
Experiments
1. Materials
Ferric oxide (Fe2O3, 99%), nickel nitrate (Ni(Ac)2, 99%), sulfur powder (99%), 1-octanol (99%), 1-octylamine (99%), ethanol (99.5%), KHCO3 (99.7%) and Nafion perfluorinated resin solution (5 wt%) were purchased from Sigma-Aldrich and Adamas-beta; Nafion® 212 membrane was purchased from Dupont. Deionized water (purified by a Milli-Q system) was used to prepare all solutions and to rinse samples and glassware.2. Instruments
The crystal structure of the catalyst was measured by X-ray diffraction (XRD) using an X'Pert-ProMPD (Holand) D/max-γAX-ray diffractometer with Cu Kα radiation (λ = 0.154178 nm). The high-resolution transmission electron microscopy (HRTEM) and scanning transmission electron microscopy (STEM) images were obtained using a FEI/Philips Tecnai G2 F20 TWIN transmission electron microscope. The Raman spectra were acquired with an HR 800 Raman spectroscope (J Y, France) equipped with a synapse CCD detector and a confocal Olympus microscope. X-ray photoelectron spectroscopy (XPS) was measured using a KRATOS Axis ultra-DLD X-ray photoelectron spectrometer with a monochromatised Mg Kα X-ray source (hν = 1283.3 eV). Scanning electron microscopy (SEM) images and energy dispersive X-ray (EDX) spectroscopy were performed by Carl Zeiss Supra 55 scanning electron microscope with an acceleration voltage of 20 kV. The electro-catalysis activities were measured by a Model CHI 660C workstation (CH Instruments, Chenhua, China).3. Synthesis of catalyst
![[thin space (1/6-em)]](https://www.rsc.org/images/entities/char_2009.gif) :
:![[thin space (1/6-em)]](https://www.rsc.org/images/entities/char_2009.gif) 1. Fe2O3 (2.5 mmol), Ni(Ac)2 (2.5 mmol) and sulphur (50 mmol) were dissolved in 30.0 ml 1-octylamine and 30.0 ml 1-octanol at room temperature. Then, the mixture was transferred into a 150 ml stainless steel autoclave and heated to 260 °C for 3 hours under nitrogen atmosphere. When cooled to room temperature, the black precipitate was collected by centrifugation and thoroughly washed with ethanol for several times.
1. Fe2O3 (2.5 mmol), Ni(Ac)2 (2.5 mmol) and sulphur (50 mmol) were dissolved in 30.0 ml 1-octylamine and 30.0 ml 1-octanol at room temperature. Then, the mixture was transferred into a 150 ml stainless steel autoclave and heated to 260 °C for 3 hours under nitrogen atmosphere. When cooled to room temperature, the black precipitate was collected by centrifugation and thoroughly washed with ethanol for several times.![[thin space (1/6-em)]](https://www.rsc.org/images/entities/char_2009.gif) :
:![[thin space (1/6-em)]](https://www.rsc.org/images/entities/char_2009.gif) 1.5.
1.5.4. Electrochemical measurements
The electrocatalytic activity measurements were performed in a standard three-electrode system. Saturated calomel electrode (SCE) was acted as the reference electrode with a standard electrode potential of 0.242 V (vs. RHE) and platinum wire was acted as the counter electrode. The working electrode was the catalyst modified glassy carbon disk electrode (GCE, 3.0 mm diameter CH Instruments) and 0.5 M KHCO3 solution saturated with CO2 was used as electrolyte. The cyclic voltammetry and linear sweep voltammetry were performed at a range from 0.7 to −0.7 V (vs. RHE) by a Model CHI 660C workstation under ambient condition. All the potentials reported here were versus Hg/HgCl2 and were converted to the RHE scale using the Nernst equation:ERHE is the converted potential versus RHE. EHg/HgCl2 is the external potential measured against the Hg/HgCl2 reference electrode.
 is the standard potential of Hg/HgCl2 at 25 °C (0.242 V).
5. CO2 reduction measurements and products quantification
The CO2 reduction measurements were performed in an airtight electrochemical H-type cell under ambient temperature. The cathode compartment was consist of working electrode and reference electrode, while the anode compartment was composed of platinum wire. Apply dots of FeS2/NiS nanocomposite catalyst (dissolved in 0.5% Nafion) to modified carbon fiber paper electrode (0.7 cm × 0.7 cm), then connect the carbon fiber paper to the cathode electrode. Each of the compartments loaded 75.0 ml 0.5 M KHCO3 saturated with CO2 and 40.0 ml carbon dioxide in the headspace. There is a slice of proton exchange membrane (Nafion® 212) at the connector to separate the two compartments in case the electroreduction products diffused to the anode. The electrolytic measurements were carried out under different potentials for 1 hour, respectively. The durability test was measured in an open electrolytic cell with 0.5 M KHCO3 solution (saturated with CO2) for 4 hours at −0.6 V. During the measurement, carbon dioxide was bubbled into water continuously with a uniform velocity. The carbon-contained gas products (CO, CH4, C2H4, and C2H6) and major by-product (H2) were tested by a thermal conductivity detector (TCD) with helium as the carrier gas. The liquid phase products were qualified by a NMR (Bruker AVANCEAV III 400) spectroscopy, in which 0.5 ml electrolyte was mixed with 0.1 ml D2O (deuterated water) and 0.05 μl dimethyl sulfoxide (DMSO, Sigma, 99.99%) was added as an internal standard.The calculation of faradaic efficiency:
For CH3OH,
For H2,
Results and discussion
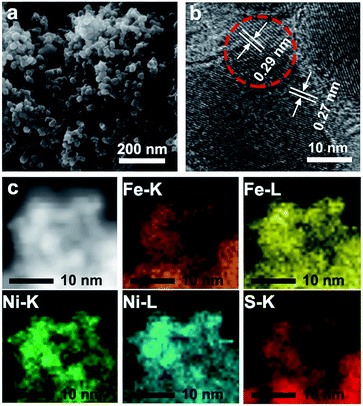
To explore the surface morphology of the FeS2/NiS nanocomposite, the SEM measurement was carried out as shown in Fig. 1a. The acquired products are made up of uniform and even nanoparticles with an average diameter of approximately 14 nm. The small and even size of the electrocatalyst confirms high specific surface area and incremental active sites, which effectively improve the catalysis activity. The HRTEM image of FeS2/NiS nanocomposite is shown in Fig. 1b. The characteristic lattice spacing of 0.27 nm is corresponding to the (200) plane of FeS2 whose XRD peak is located at 2θ = 33.0.30 The lattice spacing of 0.29 nm is indexed to the (100) plane of the NiS which matches to the XRD peak at 2θ = 46.0.31 Fig. 1c shows the STEM image and corresponding chemical mappings of Fe–K, Fe–L, Ni–K, Ni–L and S–K for FeS2/NiS nanocomposite. A homogeneous distribution of Fe, Ni, and S is reviewed in the nanocomposite. Furthermore, the HRTEM image concludes that the germination of FeS2/NiS nanocomposite arranges intimately rather than the simple physical mixture of the two compounds. Thus, we proposed that the active sites of CO2 electroreduction locate at the interface between FeS2 (200) and NiS (100).In order to identify the crystallinity and structure of the FeS2/NiS nanocomposite, the XRD measurements were performed. Fig. 2a shows the XRD patterns of FeS2/NiS nanocomposite (brown trace), FeS2 standard card (blue trace) and NiS standard card (red trace). The phanic peaks can be completely matched to the FeS2 (JCPDS no. 42-1340) and NiS (JCPDS no. 02-1280) standard diffraction peaks. In details, the predominant peaks at 46.0, 53.7, 30.2 and 34.7 degree correspond to the (100), (202), (101) and (102) planes of NiS, respectively. The peaks at 33.0, 56.4, 37.1 and 47.5 degree are assigned to the (200), (311), (210) and (211) planes of FeS2, respectively. There are no impurity peaks from other crystal structures. The average size of FeS2/NiS nanocomposite is ∼14 nm from the line width analysis of the diffraction peak calculated by Scherer equation, which is consistent with the SEM observation. FeS2/NiS nanocomposite was further characterized with Raman spectrum and showed in Fig. 2b. The peaks at 340 and 378 cm−1 can be well attributed to Raman vibrations of pyrite FeS2 and no other impurity peaks from marcasite and troilite.30 The peaks at 222 and 285 cm−1 are matching with NiS completely.32 The peaks assigned to NiS at 335 and 376 cm−1 are not emerged in the diagram obviously, which is resulted by the overlap with the peaks of pyrite FeS2.
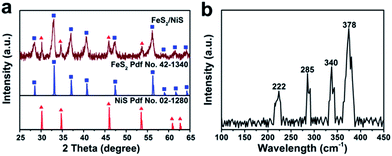 | ||
| Fig. 2 (a) The large-angle XRD patterns of FeS2/NiS nanocomposite (brown trace), FeS2 (blue trace) and NiS (red trace). (b) Raman spectrum of FeS2/NiS nanocomposite. | ||
The XPS measurement was introduced to confirm the element proportion and valence state of the FeS2/NiS nanocomposite. Besides the Fe, Ni and S elements from FeS2/NiS nanocomposite, C and O elements are also detected in the full spectrum (as shown in Fig. 3a). The elements of C and O may attribute to the carbonization of the solvents. The high resolution spectra of C 1s and O 1s are shown in Fig. S1.† The binding energy at 284.8, 286.4 and 288.8 eV of C 1s are consistent with graphite carbon, C–OH and C![[double bond, length as m-dash]](https://www.rsc.org/images/entities/char_e001.gif) O, respectively.33 The O 1s peaks at 531.9 and 532.9 eV from oxygen atoms are attributed to C
O, respectively.33 The O 1s peaks at 531.9 and 532.9 eV from oxygen atoms are attributed to C![[double bond, length as m-dash]](https://www.rsc.org/images/entities/char_e001.gif) O and O–C, respectively.34 The carbonized solvents with oxygenic functional groups may not only improve the stability of the catalyst but also act as a support.35 The high resolution scan spectra of the Fe 2p, Ni 2p and S 2p are presented in Fig. 3b–d. The atomic ratio of Fe to Ni is equal to 2 according to the XPS calculation. The result is consistent with the EDX spectroscopy measurement (as shown in Fig. S2†). The binding energy at 706.8 and 719.5 eV are conformed to the Fe 2p3/2 and Fe 2p1/2 which are characterized of pyrite.36 The Ni 2p3/2 and Ni 2p1/2 peaks are observed at 853.6 and 871.8 eV, exist two satellite peaks at 858.7 and 878.1 eV respectively,32 indicating that the nickel existed in bivalent states. There are four peaks in the high resolution XPS spectra of S. The S 2p3/2 and S 2p1/2 peaks located at 161.9 and 162.8 eV are consistent with S2−,31 while the peaks at 162.5 and 163.7 eV are identified with the S 2p3/2 and S 2p1/2 of S22−.37 These results indicate that both S22− and S2− are existed. Thus, we integrate the peak areas respectively and acquire the ratio of S22− to S2− is 2, which is also consistent with the previously calculated ratio of iron to nickel.
O and O–C, respectively.34 The carbonized solvents with oxygenic functional groups may not only improve the stability of the catalyst but also act as a support.35 The high resolution scan spectra of the Fe 2p, Ni 2p and S 2p are presented in Fig. 3b–d. The atomic ratio of Fe to Ni is equal to 2 according to the XPS calculation. The result is consistent with the EDX spectroscopy measurement (as shown in Fig. S2†). The binding energy at 706.8 and 719.5 eV are conformed to the Fe 2p3/2 and Fe 2p1/2 which are characterized of pyrite.36 The Ni 2p3/2 and Ni 2p1/2 peaks are observed at 853.6 and 871.8 eV, exist two satellite peaks at 858.7 and 878.1 eV respectively,32 indicating that the nickel existed in bivalent states. There are four peaks in the high resolution XPS spectra of S. The S 2p3/2 and S 2p1/2 peaks located at 161.9 and 162.8 eV are consistent with S2−,31 while the peaks at 162.5 and 163.7 eV are identified with the S 2p3/2 and S 2p1/2 of S22−.37 These results indicate that both S22− and S2− are existed. Thus, we integrate the peak areas respectively and acquire the ratio of S22− to S2− is 2, which is also consistent with the previously calculated ratio of iron to nickel.
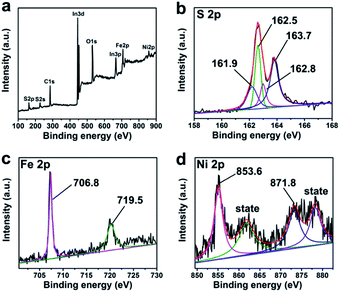 | ||
| Fig. 3 (a) The full XPS spectrum of FeS2/NiS nanocomposite and the high-resolution XPS spectra of (b) S 2p, (c) Fe 2p and (d) Ni 2p. | ||
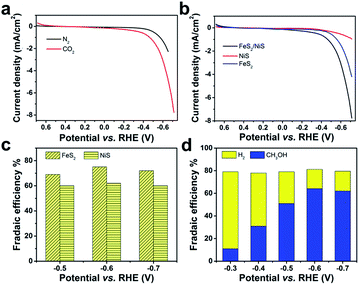
In typical experiments, the electrolytic activities were measured in a three-electrode system in 0.5 M KHCO3 aqueous solution. The curves of Linear Sweep Voltammetry (LSV) for the FeS2/NiS nanocomposite are shown in Fig. 3a. The black curve shows the catalytic activity for HER under N2 atmosphere (pH = 8.5), which presents a high overpotential over 450 mV and a low current density of 2.5 mA cm−2 with the applied potential up to −0.68 V. In comparison, an obvious enhancement of current density of 7.8 mA cm−2 is observed at the potential of −0.68 V when the electrolyte is saturated with CO2 (pH = 7.5). The onset potential performs more positive at −0.30 V, indicating a low overpotential less than 280 mV (confirmed by GC and 1H NMR). The results reveal that the electrocatalyst can selectively reduce CO2 and suppress the HER efficiently under CO2 atmosphere.
As a comparison, we investigated the electrocatalytic performances of FeS2 nanocrystal and NiS nanocrystal for CO2 electroreduction, respectively. The detailed synthetic process is shown in Experiment section. The specific characterizations including XRD, SEM and TEM of the as-prepared FeS2 and NiS nanocrystals are shown in Fig. S3 and S4.† The LSVs of FeS2, NiS and FeS2/NiS were measured in CO2-saturated 0.5 M KHCO3 solution. As showed in Fig. 4b, both the single FeS2 and NiS nanocrystals show poor activities towards CO2RR compared with FeS2/NiS nanocomposite, in which the FeS2 shows an onset potential at −0.45 V for HER and the maximum current density of 4.2 mA cm−2 at −0.68 V. While the NiS nanocrystal performs even worse, which shows an extremely low current density of 1 mA cm−2 at −0.68 V (red trace). It is generally known that FeS2 is feasible towards HER.38,39 For FeS2/NiS nanocomposite (black trace), more positive onset potential at −0.3 V as well as higher current density of 7.8 mA cm−2 can be achieved towards CO2RR.
To further compare the electrocatalytic performance of FeS2 nanocrystal, NiS nanocrystal and FeS2/NiS nanocomposite for CO2 reduction, the electrolytic reduction reaction of CO2 was carried out in an electrochemical airtight H-type cell at the potential range from −0.3 to −0.7 V. The gas products were detected by gas chromatography (GC). The liquid-phase products were detected by 1H NMR and the DMSO was added as an internal standard. As shown in Fig. S5,† the reduced products are CH3OH after CO2 electroreduction catalyzed by FeS2/NiS nanocomposite for 2 hours and 4 fours. For FeS2 and NiS nanocrystals, H2 is the only product in gas phase and no hydrocarbon products are detected in both gas and liquid phases. As shown in Fig. 4c, the FEs vs. the applied potentials (−0.5, −0.6, −0.7 V) of H2 for FeS2 and NiS nanocrystals show a stable tendency at different potentials. For FeS2/NiS nanocomposite, the FEs vs. the applied potentials (−0.3, −0.4, −0.5, −0.6, −0.7 V) for CH3OH (left axis) and H2 (right axis) are shown in Fig. 4d. The CH3OH FEs show an overall growth tendency at the range from −0.3 V to −0.6 V but reach a plateau of 64% approximately at −0.6 V. After that, it maintains a stable tendency. We further compared the FEs for CH3OH in the literatures and showed in Table S1.† To reach the same FE of CH3OH, FeS2/NiS nanocomposite shows a moderate potential compared with those noble metal electrocatalysts. The H2 FEs for FeS2/NiS nanocomposite show an opposite tendency compared with CH3OH. The FEs of H2 continuously decreases and decreases to a minimum of 17% at the applied potential of −0.6 V. Moreover, the total FEs for the generation of CH3OH and H2 are maintained at 81% over the whole process. These results demonstrate that single FeS2 and NiS nanocrystals can hardly reduce CO2 into hydrocarbon products, whereas the FeS2/NiS nanocomposite can achieve an efficient and selective electroreduction process for CO2. Thus, we propose the active sites for CO2RR locate at the interface between FeS2 and NiS.
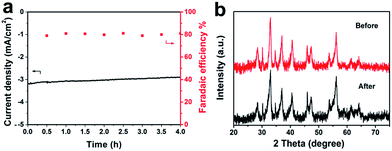
To further prove the stability of the FeS2/NiS nanocomposite, the continuous tendency test was measured in a standard three-electrode cell as shown in Fig. 5a. A stable current density of 3.1 mA cm−2 is observed over the 4 hours electroreduction at the potential of −0.6 V. Besides, the FE of the products (CH3OH and H2) for the FeS2/NiS nanocomposite is maintained at about 81% over the 4 hours electrolysis. It can observe no obvious deactivation of FeS2/NiS nanocomposite for CO2 reduction throughout the entire process. Then, the XRD measurement was performed on the reacted FeS2/NiS nanocomposite as shown in Fig. 5b. The XRD analysis indicates that there is no transformation taking place upon the catalyst during the whole electroreduction. These results fully confirm that FeS2/NiS nanocomposite is excellently stable and efficient for CO2 electroreduction.
To understand the highly efficient electrocatalysis activity of FeS2/NiS nanocomposite, we further compared the performances of CO2RR catalysed by FeS2/NiS nanocomposite, pure FeS2 and NiS nanocrystals. The single FeS2 and NiS nanocrystals show poor activities towards CO2RR. The FeS2 nanocrystal shows a negative onset potential at −0.45 V and the maximum current density of 4.2 mA cm−2 at −0.68 V. Then, the NiS nanocrystal shows a more negative onset potential at −0.5 V and extremely low current density of 1 mA cm−2 at −0.68 V. Furthermore, a physical mixture of FeS2 and NiS nanocrystals with the same ratio as FeS2/NiS nanocomposite was fabricated. The electrocatalytic activity for CO2 reduction was measured and showed in Fig. S6.† The current density presents a slight increasement under CO2 atmosphere compared with N2 atmosphere. Then, a 2 h-electrolysis in 0.5 M CO2-saturated KHCO3 for the physical mixture was performed at the potential of −0.6 V. Only H2 was detected in the both gas phase and liquid phase products. The increasement of current density may be ascribed to the effect of pH. In contrast, the FeS2/NiS nanocomposite exhibits excellent activity for CO2RR. It achieves an unprecedented overpotential of 280 mV and a stable current density of 3.1 mA cm−2 at the potential of −0.6 V. Comparing the electrocatalytic performances of CO2RR in FeS2 nanocrystal, NiS nanocrystal, physical mixture of FeS2 and NiS nanocrystals and FeS2/NiS nanocomposite, it can speculate that the active sites of the catalyst locate at the interface between FeS2 (200) and NiS (100) (as shown in Fig. 6). On the other hand, many researches have evidenced that the electroreduction of CO2 to CH3OH is a complex process which includes the transformation of 6 e− and 6 H+.5,37–40 Still, more experimental and theoretical calculations are needed to unravel the detailed mechanism of this multistep reaction.
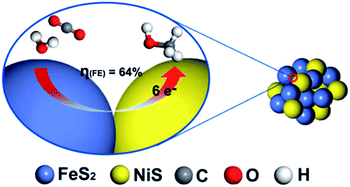 | ||
| Fig. 6 The proposed reaction mechanism of electroreduction CO2 by FeS2/NiS nanocomposite electrocatalyst. | ||
Conclusion
We synthesized the FeS2/NiS nanocomposite with a traditional hydrothermal method. It was demonstrated that FeS2/NiS nanocomposite can catalyze CO2RR at an unprecedented overpotential of 280 mV and a high CH3OH faradaic efficiency up to 64% at the potential of −0.6 V. Moreover, the catalyst performs a stable current density of 3.1 mA cm−2 over the 4 hours stability test and there is no obvious degradation after electroreduction from XRD observation. In experiments, the FeS2 nanocrystals, NiS nanocrystals and the physical mixture of FeS2 and NiS nanocrystals all show poor activity towards CO2RR, while the FeS2/NiS nanocomposite exhibits excellent activity towards the process. Thus, the high activity and selectivity towards CO2 electroreduction to CH3OH is probably attributed to the special ladder structure of the FeS2/NiS nanocomposite. The active sites may locate at the interface between FeS2 and NiS which could effectively suppress the side reaction of HER and facilitate the CO2RR. The low-cost FeS2/NiS nanocomposite is an efficient alternative to expensive materials for the application of CO2 electroreduction in industry.Acknowledgements
This work is supported by the Collaborative Innovation Center of Suzhou Nano Science and Technology, the National Natural Science Foundation of China (51422207, 51132006, 51572179, 21471106, 21501126), the Specialized Research Fund for the Doctoral Program of Higher Education (20123201110018), a Suzhou Planning Project of Science and Technology (ZXG2012028), and a project funded by the Priority Academic Program Development of Jiangsu Higher Education Institutions (PAPD).Notes and references
- Q. Lu, J. Rosen, Y. Zhou, G. S. Hutchings, Y. C. Kimmel, J. G. Chen and F. Jiao, Nat. Commun., 2014, 5, 3242 Search PubMed.
- R. Reske, H. Mistry, F. Behafarid, B. Roldan Cuenya and P. Strasser, J. Am. Chem. Soc., 2014, 136, 6978–6986 CrossRef CAS PubMed.
- J. Wu, R. M. Yadav, M. Liu, P. P. Sharma, C. S. Tiwary, L. Ma, X. Zou, X.-D. Zhou, B. I. Yakobson, J. Lou and P. M. Ajayan, ACS Nano, 2015, 9, 5364–5371 CrossRef CAS PubMed.
- J. O. Bockris, J. Electrochem. Soc., 1989, 136, 2521 CrossRef CAS.
- J. Qiao, Y. Liu, F. Hong and J. Zhang, Chem. Soc. Rev., 2014, 43, 631–675 RSC.
- W. Zhu, R. Michalsky, Ö. Metin, H. Lv, S. Guo, C. J. Wright, X. Sun, A. A. Peterson and S. Sun, J. Am. Chem. Soc., 2013, 135, 16833–16836 CrossRef CAS PubMed.
- S. Back, M. S. Yeom and Y. Jung, ACS Catal., 2015, 5, 5089–5096 CrossRef CAS.
- H. Mistry, R. Reske, Z. Zeng, Z.-J. Zhao, J. Greeley, P. Strasser and B. R. Cuenya, J. Am. Chem. Soc., 2014, 136, 16473–16476 CrossRef CAS PubMed.
- W. Zhu, Y.-J. Zhang, H. Zhang, H. Lv, Q. Li, R. Michalsky, A. A. Peterson and S. Sun, J. Am. Chem. Soc., 2014, 136, 16132–16135 CrossRef CAS PubMed.
- J. Rosen, G. S. Hutchings, Q. Lu, S. Rivera, Y. Zhou, D. G. Vlachos and F. Jiao, ACS Catal., 2015, 5, 4293–4299 CrossRef CAS.
- S. Ma, R. Luo, J. I. Gold, A. Z. Yu, B. Kim and P. J. A. Kenis, J. Mater. Chem. A, 2016, 4, 8573–8578 CAS.
- D. Gao, H. Zhou, J. Wang, S. Miao, F. Yang, G. Wang, J. Wang and X. Bao, J. Am. Chem. Soc., 2015, 137, 4288–4291 CrossRef CAS PubMed.
- X. Wang, H. Shi, J. H. Kwak and J. Szanyi, ACS Catal., 2015, 5, 6337–6349 CrossRef CAS.
- Y. Gong, Y. Zhao, Y. Chen, Y. Wang and C. Sun, RSC Adv., 2016, 6, 43185–43190 RSC.
- J. Albo, M. Alvarez-Guerra, P. Castaño and A. Irabien, Green Chem., 2015, 17, 2304–2324 RSC.
- C. Zhai, M. Zhu, F. Pang, D. Bin, C. Lu, M. C. Goh, P. Yang and Y. Du, ACS Appl. Mater. Interfaces, 2016, 8, 5972–5980 CAS.
- C. Zhai, M. Zhu, D. Bin, F. Ren, C. Wang, P. Yang and Y. Du, J. Power Sources, 2015, 275, 483–488 CrossRef CAS.
- D. Canfield and K. W. Frese, J. Electrochem. Soc., 1983, 130, 1772 CrossRef CAS.
- K. W. Frese and S. Leach, J. Electrochem. Soc., 1985, 132, 259–260 CrossRef CAS.
- K. Hara, A. Kudo and T. Sakata, J. Electroanal. Chem., 1995, 386, 257–260 CrossRef.
- A. Kudo, S. Nakagawa, A. Tsuneto and T. Sakata, J. Electrochem. Soc., 1993, 140, 1541–1545 CrossRef CAS.
- K. Hara, A. Tsuneto, A. Kudo and T. Sakata, J. Electrochem. Soc., 1994, 141, 2097–2103 CrossRef CAS.
- S. Bagherzadeh and N. P. Mankad, J. Am. Chem. Soc., 2015, 137, 10898–10901 CrossRef CAS PubMed.
- G. Kyriacou and A. Anagnostopoulos, J. Electroanal. Chem., 1992, 322, 233–246 CrossRef CAS.
- J. B. Varley, H. A. Hansen, N. L. Ammitzbøll, L. C. Grabow, A. A. Peterson, J. Rossmeisl and J. K. Nørskov, ACS Catal., 2013, 3, 2640–2643 CrossRef CAS.
- A. B. Bocarsly, Q. D. Gibson, A. J. Morris, R. P. L'Esperance, Z. M. Detweiler, P. S. Lakkaraju, E. L. Zeitler and T. W. Shaw, ACS Catal., 2012, 2, 1684–1692 CrossRef CAS.
- H. Mistry, A. S. Varela, C. S. Bonifacio, I. Zegkinoglou, I. Sinev, Y.-W. Choi, K. Kisslinger, E. A. Stach, J. C. Yang, P. Strasser and B. R. Cuenya, Nat. Commun., 2016, 7, 12123 CrossRef CAS PubMed.
- D. Raciti, K. J. Livi and C. Wang, Nano Lett., 2015, 15, 6829–6835 CrossRef CAS PubMed.
- M. Le, M. Ren, Z. Zhang, P. T. Sprunger, R. L. Kurtz and J. C. Flake, J. Electrochem. Soc., 2011, 158, E45 CrossRef CAS.
- B.-B. Yu, X. Zhang, Y. Jiang, J. Liu, L. Gu, J.-S. Hu and L.-J. Wan, J. Am. Chem. Soc., 2015, 137, 2211–2214 CrossRef CAS PubMed.
- J. Yuan, J. Wen, Y. Zhong, X. Li, Y. Fang, S. Zhang and W. Liu, J. Mater. Chem. A, 2015, 3, 18244–18255 CAS.
- J. S. Chen, J. Ren, M. Shalom, T. Fellinger and M. Antonietti, ACS Appl. Mater. Interfaces, 2016, 8, 5509–5516 CAS.
- L. Bai, S. Qiao, Y. Fang, J. Tian, J. Mcleod, Y. Song, H. Huang, Y. Liu and Z. Kang, J. Mater. Chem. C, 2016, 4, 8490–8495 RSC.
- B. Y. Yu and S.-Y. Kwak, J. Mater. Chem., 2012, 22, 8345 RSC.
- H. Li, X. Zhang and D. R. MacFarlane, Adv. Energy Mater., 2015, 5, 1401077 CrossRef.
- F. Jiang, L. T. Peckler and A. J. Muscat, Cryst. Growth Des., 2015, 15, 3565–3572 CAS.
- R. Morrish, R. Silverstein and C. A. Wolden, J. Am. Chem. Soc., 2012, 134, 17854–17857 CrossRef CAS PubMed.
- D.-Y. Wang, M. Gong, H.-L. Chou, C.-J. Pan, H.-A. Chen, Y. Wu, M.-C. Lin, M. Guan, J. Yang, C.-W. Chen, Y.-L. Wang, B.-J. Hwang, C.-C. Chen and H. Dai, J. Am. Chem. Soc., 2015, 137, 1587–1592 CrossRef CAS PubMed.
- D. Jasion, J. M. Barforoush, Q. Qiao, Y. Zhu, S. Ren and K. C. Leonard, ACS Catal., 2015, 5, 6653–6657 CrossRef CAS.
- A. Roldan and N. H. de Leeuw, Faraday Discuss., 2016, 188, 161–180 RSC.
Footnote |
| † Electronic supplementary information (ESI) available: The supplementary figures are shown. See DOI: 10.1039/c6ra26868d |
| This journal is © The Royal Society of Chemistry 2017 |


