Correlation between stress relaxation dynamics and thermochemistry for covalent adaptive networks polymers†
Xiao
Kuang
ab,
Guoming
Liu
a,
Xia
Dong
a and
Dujin
Wang
*ab
aBeijing National Laboratory for Molecular Sciences, CAS Key Laboratory of Engineering Plastics, Institute of Chemistry, Chinese Academy of Sciences, Beijing, 100190, China. E-mail: djwang@iccas.ac.cn; Fax: +86-10-82618533; Tel: +86-10-82618533
bUniversity of Chinese Academy of Sciences, Beijing 100049, China
First published on 19th August 2016
Abstract
Smart polymers based on covalent adaptive networks (CANs) with reversible covalent bonds have drawn tremendous attention in the past few years. The relaxation properties of CANs polymers play an important role because of their stimuli-responsive capability. Here, we elucidate the correlation between the stress relaxation dynamics and reaction thermochemistry of CANs polymers. Diels–Alder (DA) reaction based cross-linked elastomers are utilized as model CANs polymers. In situ FTIR data reveals the dynamic reaction kinetics and thermodynamics in the solid state. The influence of cross-linking density on the temperature-dependent stress relaxation time of the CANs polymers well above the gel point can be normalized by the relative distance to the gel point conversion. Combining the Semenov–Rubinstein theory and Arrhenius' law, a simple scaling relationship between normalized relaxation time and reaction kinetics is established for CANs polymers.
1 Introduction
Covalent adaptive networks (CANs) polymers refer to networks containing sufficient reversible cross-links.1–3 CANs polymers combine the desirable attributes of conventional thermosets with the capability of responding to selective stimuli. A variety of smart polymers, such as self-healing,4–11 shape memory12–18 and recyclable thermosets,19–24 have been developed based on CANs polymers. On the basis of a network rearrangement mechanism and dynamic reactions, the CANs are grouped into two categories: reversible addition/condensation reactions and reversible exchange reactions. The bond exchange reactions, such as transesterification, follow a simultaneous bond-forming and bond-breaking process without a decrease in cross-linking density during the transition. However, the network rearrangement of the reversible addition reaction, such as the Diels–Alder (DA) reaction, follows a bond-breaking, bond-forming reaction sequence. For example, increasing the temperature favours the endothermic retro Diels–Alder (rDA) reaction and the reaction shifts toward the reactants, thereby decreasing the amount of adducts and the cross-links.25–29It is well known that the time–temperature superposition (TTS) principle is a powerful tool for understanding the temperature-dependent mechanical properties of polymers. In regard to dynamic polymers, TTS has been used with success on materials when bond dynamics and conversion are not strong functions of temperature.30–32 The relaxation properties of CANs based on a reversible exchange bond, such as transesterification, have been extensively studied.33–37 The temperature-dependent relaxation dynamics were revealed by Arrhenius' law. The network rearrangement and relaxation for transesterification-type CANs are dominated by reaction kinetics, and their temperature-dependent relaxation properties are described by TTS.34 In DA-type CANs, however, both the reaction kinetics and cross-linking density are influenced by temperature. The superposition concept is inappropriate for such CANs with temperature-dependent equilibrium chemical structures.28 Moreover, the influence of the network structure, such as the cross-linking density, on the relaxation properties has not yet been well understood in CANs polymers. Therefore, deeper insight into the relaxation behaviour of CANs polymers at a molecular scale is urgently needed.
Recently, the direct relationship between the bond lifetime and the relaxation behaviour for associating polymers (such as amphiphilic systems and ionomers) was obtained by applying the Semenov–Rubinstein (SR) model.38–40 This model also provides an appropriate description of the linear dynamics for a DA network near the gel point.41 The maximum relaxation time (τmax) of the associating network with many reversible stickers corresponds to the rheological lifetime of the cluster (τ1) (eqn (1)), which is proportional to the bond lifetime (τb) and the relative distance to the Flory gel point in conversion (ε) (eqn (2)).
| τmax = τ1 ≅ Cτbε | (1) |
 | (2) |
 | (3) |
The prediction of pgel is described by the Flory–Stockmayer equation.42 In eqn (3), r is the stoichiometric ratio of maleimide to furan moieties (r ≤ 1); fM and fF are the degree of functionality for the maleimide and furan monomers, respectively. The dynamic polymers well above gel point conversion, i.e. ε ≫ 0, are not further discussed by SR theory. Such CANs polymers with long relaxation times are hard to measure by a conventional dynamic rheological test. Whether SR theory can be applied to CANs polymers well above the gel point remains unknown.
In this study, we aim to elucidate the correlation between the relaxation dynamics and reaction thermochemistry for CANs polymers well above the gel point. Specifically, the influences of temperature and cross-linking density on the stress relaxation time of DA-type CANs elastomers were investigated. The in situ FTIR was utilized to measure the reaction kinetics and thermodynamics in the solid state. Tensile stress relaxation tests were conducted to evaluate the relaxation properties of DA-type CANs polymers with different cross-linking densities. We took advantage of Arrhenius' law and Semenov–Rubinstein theory to analyse the temperature-dependent stress relaxation time of CANs polymers and demonstrated the relaxation mechanism at a molecular scale.
2 Results and discussion
2.1 Modification and cross-linking of SBR
An styrene-butadiene rubber (SBR) with reactive vinyl double bonds was modified by furfuryl mercaptan through thermal-initiated thiol–ene addition (Scheme 1a).25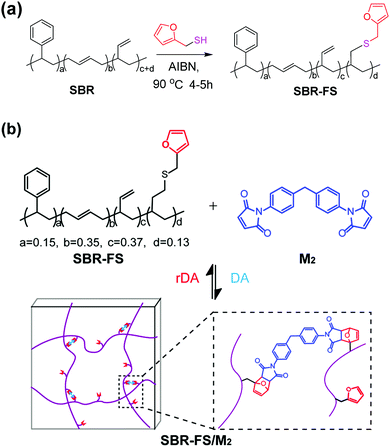 | ||
| Scheme 1 (a) Modification of SBR with furfuryl mercaptan by thiol–ene addition. (b) Synthesis of Diels–Alder type CANs polymers (SBR-FS/M2). | ||
The furfuryl functional SBR (SBR-FS) was characterized by 1H NMR analysis. As shown in Fig. S1 (ESI†) the peaks at δ = 7.34, 6.29, and 6.16 ppm are ascribed to the protons of the furan ring attached on the polymer chain. The peak at δ = 3.68 ppm is attributed to the methylene protons of furfuryl. The degree of furan substitution (DS) was calculated to be 13.2% by eqn (S1) (ESI†). The 13C NMR spectrum also confirms the successful modification of SBR, with corresponding peaks of the furfuryl group (Fig. S2, ESI†). From the GPC results, the molecular weight distribution of SBR-FS is very narrow, suggesting a negligible cross-linking reaction during the modification (Table S1, ESI†). In addition, the average functionality of the furfuryl functional SBR was evaluated to be 116–119.
The chemical modification was further followed by FTIR spectroscopy. As shown in Fig. 1a, the appearance of the furan ring COC bands (νasCOC = 1071 cm−1, and νsCOC = 1009 cm−1), the C![[double bond, length as m-dash]](https://www.rsc.org/images/entities/char_e001.gif) C stretching vibration of the furan ring (νsCC = 1505 cm−1), the CH in-plane deformation of furan (δipCH = 1150 cm−1), and the CH out-of-plane deformation vibration of furan (δopCH = 731 cm−1) clearly indicate the presence of furan groups on the polymer chain after modification.43 Moreover, the decrease in the vinyl C
C stretching vibration of the furan ring (νsCC = 1505 cm−1), the CH in-plane deformation of furan (δipCH = 1150 cm−1), and the CH out-of-plane deformation vibration of furan (δopCH = 731 cm−1) clearly indicate the presence of furan groups on the polymer chain after modification.43 Moreover, the decrease in the vinyl C![[double bond, length as m-dash]](https://www.rsc.org/images/entities/char_e001.gif) C stretching vibration (νsCC = 1639 cm−1) intensity confirms the grafting of the furan group to the chain of SBR via a thiol–ene reaction.44
C stretching vibration (νsCC = 1639 cm−1) intensity confirms the grafting of the furan group to the chain of SBR via a thiol–ene reaction.44
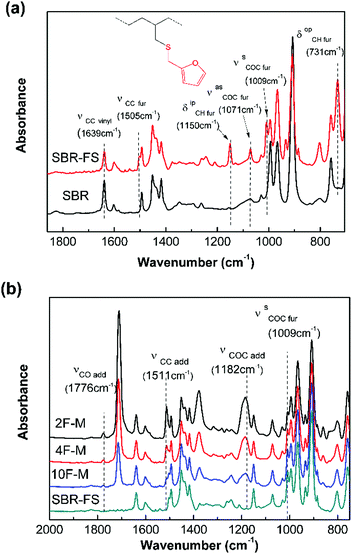 | ||
| Fig. 1 FTIR absorption spectra of (a) pristine SBR and SBR-FS samples, (b) SBR-FS and cross-linked rubbers with different furan/maleimide ratios. | ||
The cross-linked samples with different furan/maleimide molar ratios (F/M = x/1, x = 2, 4 and 10) are denoted as xF–M. The cross-linking reaction between SBR-FS and a bismaleimide (M2) cross-linker was also characterized by FTIR spectroscopy. As shown in Fig. 1b, the formation of the DA adduct is evidenced by the appearance of adduct bands (νCOC = 1182 cm−1, νCNC = 1194 cm−1, νCO = 1777 cm−1), and furan C![[double bond, length as m-dash]](https://www.rsc.org/images/entities/char_e001.gif) C stretching (νCC = 1511 cm−1) in all the cross-linked polymers with different furan/maleimide (F/M) ratios.45,46 The samples with lower F/M ratios (higher cross-linker content) show stronger band intensity. Meanwhile, the amount of furan moieties, as indicated by the band at 1009 cm−1 (νsCOC), decreases with an increasing amount of M2 cross-linking agent. The equilibrium-controlled DA reaction is not complete for a stoichiometric ratio of F/M moietie (F/M = 1).47 With sufficient furan moieties (F/M > 1), however, nearly complete conversion of maleimide was achieved, as indicated by the absence of a maleimide characteristic band (δCC = 827 cm−1).
C stretching (νCC = 1511 cm−1) in all the cross-linked polymers with different furan/maleimide (F/M) ratios.45,46 The samples with lower F/M ratios (higher cross-linker content) show stronger band intensity. Meanwhile, the amount of furan moieties, as indicated by the band at 1009 cm−1 (νsCOC), decreases with an increasing amount of M2 cross-linking agent. The equilibrium-controlled DA reaction is not complete for a stoichiometric ratio of F/M moietie (F/M = 1).47 With sufficient furan moieties (F/M > 1), however, nearly complete conversion of maleimide was achieved, as indicated by the absence of a maleimide characteristic band (δCC = 827 cm−1).
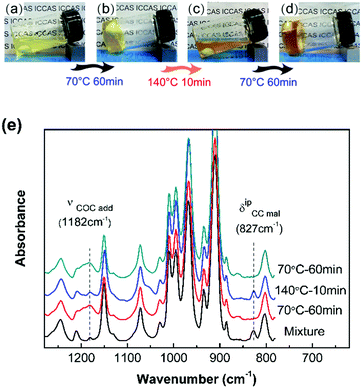
The DA reaction between the furan moieties in modified polymer chains and the maleimide moieties in the cross-linker produces a thermally reversible network (Scheme 1b). Solubility tests were used to determine the cross-linking and de-cross-linking effects of the reversible network. The initial reaction mixture solution (Fig. 2a) changed into a gel quickly after thermal treatment at a mild temperature (70 °C) (Fig. 2b). Upon heating to 140 °C, the resulting polymer gel was completely reversed to a clear and fluid solution (Fig. 2c). Annealing the above solution at 70 °C led to gel formation again (Fig. 2d). The heat-induced sol–gel transition results from the reversible DA/rDA reactions, which were depicted by FTIR in the solid state.
The 10F–M sample was subjected to repeated DA (70 °C)–rDA (140 °C)–DA (70 °C) reaction cycles and tested by FTIR (Fig. 2e). In the original reactive mixture, the presence of free unreacted maleimide was reflected by the C![[double bond, length as m-dash]](https://www.rsc.org/images/entities/char_e001.gif) C deformation of maleimide at 827 cm−1. The maleimide signal nearly disappeared after treating at 70 °C for 1 h via a DA reaction, accompanied by the appearance of an adduct signal at 1182 cm−1. When the sample was treated at 140 °C, the band at 827 cm−1 nearly recovered its initial value and the band at 1182 cm−1 decreased obviously via an rDA reaction. Thus, both of these two bands can be utilized to evaluate the DA/rDA reaction.
C deformation of maleimide at 827 cm−1. The maleimide signal nearly disappeared after treating at 70 °C for 1 h via a DA reaction, accompanied by the appearance of an adduct signal at 1182 cm−1. When the sample was treated at 140 °C, the band at 827 cm−1 nearly recovered its initial value and the band at 1182 cm−1 decreased obviously via an rDA reaction. Thus, both of these two bands can be utilized to evaluate the DA/rDA reaction.
2.2 Thermal analysis
The DSC method offers useful insights into characterizing materials with thermally responsive properties. The DSC heating curves of all the CANs polymers show a glass transition and a broad endothermic process attributed to the rDA reaction (Fig. 3a). The glass transition temperature (Tg) ranging from −12 to 0 °C, increases with the amount of cross-linker. The rDA reaction with peak temperature (TrDA) is located at 119 °C for all the samples. The reaction enthalpy (ΔHrDA) increases with the M2 content, indicating increasing amounts of DA adducts. It should be noted that the rDA reactions of endo and exo stereoisomers connected to aromatic structures take place at close temperatures, which are hard to separate by DSC.48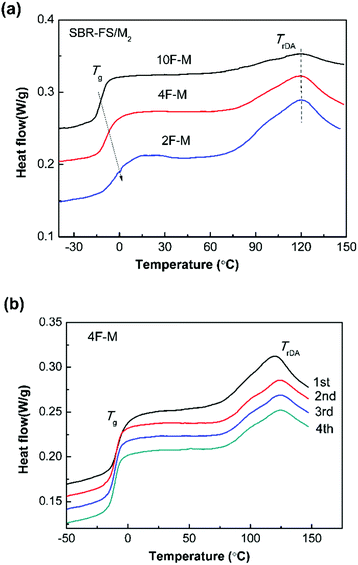 | ||
| Fig. 3 (a) DSC heating curves for CANs polymers with different furan/maleimide ratios. (b) Four repeated DSC heating traces of 4F–M samples. The scan rate was 10 °C min−1. | ||
As shown in Fig. 3b, the rDA reaction enthalpy decreases in the second heating run. This means that DA adduct formation is incomplete over the short duration of the cooling process. The repeated thermal cycles show comparable peak area and no obvious peak shift, indicating the excellent thermal reversibility of the investigated systems. The thermal properties of the DA-type CANs elastomers in cyclic tests are summarized in Table 1.
| Sample | T g (°C) | T rDA (°C) (1st) | ΔHrDA (J g−1) (1st) | T rDA (°C) (2nd) | ΔHrDA (J g−1) (2nd) |
|---|---|---|---|---|---|
| 10F–M | −11.8 | 118.9 | 3.20 | 122.6 | 2.96 |
| 4F–M | −6.9 | 119.1 | 9.39 | 122.3 | 5.88 |
| 2F–M | −0.4 | 118.3 | 11.52 | 121.8 | 9.73 |
2.3 Dynamic mechanical thermal analysis
The thermal mechanical properties of the CANs elastomers were tested by dynamic mechanical thermal analysis (DMTA) in tensile mode. As shown in Fig. 4a, an obvious rubber plateau was observed in the CANs elastomers after the glass transition. The rubber plateau modulus is enhanced with increasing cross-linker content. However, the storage modulus starts to drop over 100 °C as a result of de-cross-linking via the rDA reaction. The single glass transition becomes broader with higher M2 content (Fig. 4b).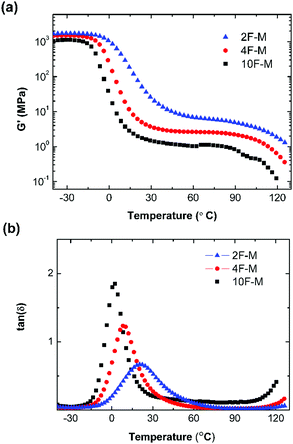 | ||
Fig. 4 (a) Storage modulus (G′) and (b) tan![[thin space (1/6-em)]](https://www.rsc.org/images/entities/char_2009.gif) δ as a function of temperature for CANs polymers with different cross-linking densities. δ as a function of temperature for CANs polymers with different cross-linking densities. | ||
The cross-linking density (ν) was evaluated using rubber theory by the following equation (eqn (4)):49
 | (4) |
The calculated apparent cross-linking densities in the range 130–701 mol m−3 increase with the cross-linker content for CANs elastomers (Table 2). These values are comparable to the DA adduct densities determined by chemical analysis. This result suggests that the cross-links are uniformly distributed throughout the material. The small discrepancy between the calculated values and the experimental results is not surprising. For one thing, CANs polymers cross-linked by M2 cross-linker do not form an ideal network. For another thing, the maleimide conversion was not 100% at the reference temperature (60 °C), leading to a decrease in cross-linking density. The molecular weight of the polymer chain between cross-linkers, Mc, was also obtained from the experimental cross-linking density.
2.4 Thermochemistry
By means of in situ FTIR spectra, the characteristic peaks of maleimide at 827 cm−1 (C![[double bond, length as m-dash]](https://www.rsc.org/images/entities/char_e001.gif) C deformation) and the adduct at 1182 cm−1 (C–O–C stretching) were utilized to evaluate the DA/rDA reactions. Maleimide or adduct conversion (p) was calculated from the following equation:
C deformation) and the adduct at 1182 cm−1 (C–O–C stretching) were utilized to evaluate the DA/rDA reactions. Maleimide or adduct conversion (p) was calculated from the following equation: | (5) |
![[double bond, length as m-dash]](https://www.rsc.org/images/entities/char_e001.gif) C deformation in maleimide) or the 1182 cm−1 band (C–O–C stretch in the adduct) at the measurement temperature or time; I100% and I0 represent the corresponding peak intensities of 100% and 0 of maleimide or adduct contents, respectively.
C deformation in maleimide) or the 1182 cm−1 band (C–O–C stretch in the adduct) at the measurement temperature or time; I100% and I0 represent the corresponding peak intensities of 100% and 0 of maleimide or adduct contents, respectively.
Comparable DA/rDA reaction conversion can be derived from eqn (5) using these two characteristic bands (Fig. S3, ESI†). For simplicity, the reaction conversion was evaluated from the band at 827 cm−1, which doesn't overlap with other bands. When testing the samples at elevated temperatures, it's better to use the band at 1182 cm−1 to calculate the conversion results, due to the irreversible side reaction of maleimide homo-polymerization. This side reaction becomes apparent at high temperatures for long residence times. However, we found that this side reaction would be significantly mitigated by adding a bit of antioxidant.
The DA reaction between a maleimide (M) and a furan (F) gives an adduct (A), and the rDA reaction proceeds to recover its reactants. A nonlinear least-squares fit of the concentration data by using adduct conversion p to a kinetic model (eqn (6)) was utilized to estimate the reverse rate constant kr corresponding to the measurement. More details about the calculation are found in ESI.†
 | (6) |
Fig. 5a is the evolution of adduct conversion as a function of heating time for 10F–M at 100 °C. The adduct conversion increases sharply within 8 min and levels off at 31% for an extended time. The reverse reaction rate constant (kr) was fitted to be 0.144 min−1, and the corresponding adduct half-life (ln(2)/kr) is 289 s. The kr was determined at 100, 110, 120, 130 and 140 °C (Fig. S4, ESI†). By an Arrhenius plot, the pre-exponential factor (k0) and activation energy (Ea,r) for the rDA reaction were determined to be 2.82 × 10¹³±1 min−1 and 101 ± 7 kJ mol−1, respectively. The value of Ea,r is higher than the reported results of 88–95.2 kJ mol−1.28,50 The more difficult diffusion of functional groups between pre-polymer and cross-linker in the solid state reaction should be considered responsible for this result.
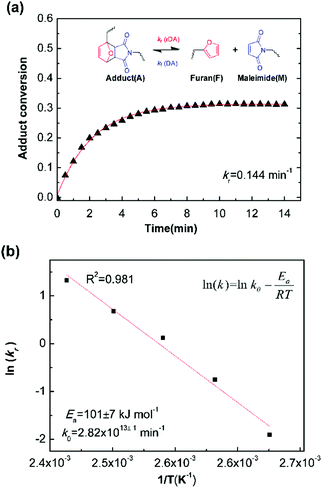 | ||
| Fig. 5 (a) Example kinetic parameters for 10F–M at 100 °C. The lines represent fits to eqn (6). Inserted was the Diels–Alder and retro Diels–Alder reactions between furan and maleimide moieties. (b) Arrhenius plot of rDA reaction kinetics for 10F–M sample. | ||
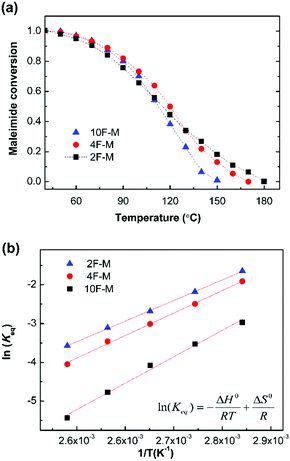
The equilibrium temperature–conversion relationship was also revealed by FTIR analysis. The equilibrium constant (Keq) is written in terms of the maleimide equilibrium conversion peq (eqn (7)).
 | (7) |
As shown in Fig. 6a, the equilibrium conversion of maleimide (peq) in all CANs polymers decreases with an increase in temperature. This result suggests that the adducts formed would gradually reverse into reactants at increasing temperatures. The equilibrium shift is negligible below 60 °C, but becomes obvious over 80 °C. Meanwhile, the gel point temperatures (Tgel) can be obtained at peq = pgel, and are summarized in Table 3.
Fig. 6b shows the Van't Hoff plots, i.e., the natural logarithm of Keqversus inverse temperature, for the CANs polymers. The Keq increases with decreasing F/M ratios. This is consistent with the general reaction behaviour that adding one of the reactants would drive the equilibrium towards the products. The enthalpy of reaction (ΔH0r) and entropy of reaction (ΔS0r) are determined from the slope and intercept of the Van't Hoff plots, respectively (Fig. S5, ESI†). The corresponding thermodynamic parameters are summarized in Table 3. The measured ΔH0r value of −55 to −71 kJ mol−1 is comparable to the reported results of −60 to −73 kJ mol−1.28,41
2.5 Stress relaxation
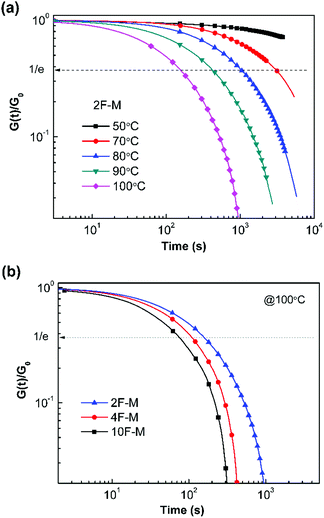
The time- and temperature-dependent stress relaxation properties of the CANs polymers were measured by tensile stress relaxation tests. The relaxation time (τ) was determined as the time required to relax to 1/e of the initial modulus.Fig. 7a depicts the stress relaxation curves of the 2F–M sample from 50 °C to 100 °C. The relaxation modulus was normalized and plotted on a double logarithmic scale. Obviously, the modulus decreases at a faster rate when the temperature is higher. For instance, the stress relaxation process is sufficiently accelerated from 50 °C to 100 °C, as evidenced by the change in τ from over 104 s to 154 s. In addition, the cross-linking density has a great effect on the relaxation time of the CANs polymers. The CANs elastomers with higher cross-linking densities possess longer relaxation times at the same temperature (Fig. 7b). Therefore, all the chemically cross-linked CANs polymers show relaxation rendered by the dynamic DA/rDA reaction.
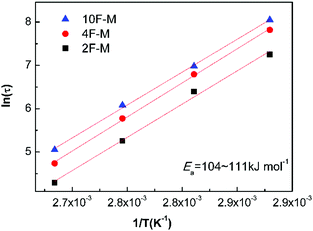
As shown in Fig. 8, the value of τ as a function of the inverse temperature follows Arrhenius' law, which is given by eqn (8):
 | (8) |
The CANs polymers with different F/M ratios showed similar relaxation dynamics, characterized by a comparable activation energy (Ea) of 104–111 kJ mol−1. This value is in the same range as the rDA reaction activation energy (Ea,r) mentioned above. More details about the relaxation properties can be found in Fig. S6 and S7 (ESI†).
A previous study suggests that the superposition concept is invalid in the DA reaction based reversible network near the gel point.28 The relaxation tests in our research were performed at temperatures much lower than Tgel. In addition, the cross-linking density as indicated by the maleimide conversion changes within 25% in the temperature range 50–100 °C. Using a stress relaxation time of the 10F–M sample at 70 °C as a reference, the shift factor (aT) was calculated for different tests. An approximately linear correlation between the shift factor ln(aT) and inverse temperature was obtained (Fig. S8, ESI†). Thus, the temperature-dependent relaxation for these DA-type CANs well above the gel point can be roughly described by the TTS principle. However, the influence of cross-linking density on the relaxation time cannot be interpreted by this phenomenological analysis. A molecular relaxation mechanism should be considered.
Based on classical gelation theory, Semenov–Rubinstein (SR) theory successfully predicts the relaxation of a transient network.38,39 The characteristic cut-off cluster is the largest “typical” cluster which can achieve complete conformation relaxation.51 The lifetime of a cluster is defined as the time taken to break into two parts of comparable size. Above gel point conversion (p > pgel) or below Tgel (T < Tgel), the network is formed by the largest cluster with a stand size comparable to a “typical” cluster. In the CANs polymers well above the gel point, the largest cluster is so large that its conformation cannot relax completely before the breaking of the “typical” cluster. No matter how far away from the gel point conversion in the post-gel region, from the molecular standpoint, the relaxation of such reversible polymer networks is dominated by the lifetime of the “typical” cluster. Hence it is reasonable to expand SR theory to CANs polymers well above the gel point.
The actual stress relaxation time (τ), comparable to the lifetime of the cut-off cluster, is proportional to the lifetime of the adduct (τb) and the relative distance to the gel point in terms of conversion (ε). As τb is determined by the dynamic chemistry itself, it is expected that the stress relaxation time of CANs polymers with different cross-linking densities can be normalized according to eqn (9):
 | (9) |
Fig. 9 shows all the measurements located on the same relaxation master curve. As expected, the temperature-dependent relaxation can be described by a simple relationship between the relaxation time and reaction kinetics for DA-type CANs polymers.
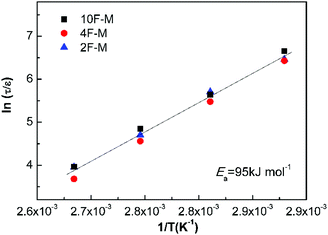 | ||
| Fig. 9 Normalized stress relaxation time versus inverse temperature based on eqn (9). | ||
As shown in Table 4, the rise in cross-linking densities obviously decreases the value of pgel. The maleimide equilibrium conversions (peq) are comparable at the same temperatures among the samples with different F/M ratios, especially at mild temperatures. Consequently, the relative distance to the gel point in terms of conversion (ε) increases with cross-linking densities. The temperature affects the relaxation time in two aspects. On one hand, higher temperatures lead to shorter bond lifetimes (τb); on the other hand, increasing the temperature would decrease the cross-linking density, contributing to a lower ε.
| Sample | p gel | T (°C) | p eq | ε | ln(τ) | ln(τ/ε) |
|---|---|---|---|---|---|---|
| 10F–M | 0.29 | 70 | 0.94 | 2.20 | 7.25 | 6.46 |
| 80 | 0.88 | 1.99 | 6.39 | 5.71 | ||
| 90 | 0.80 | 1.74 | 5.26 | 4.71 | ||
| 100 | 0.70 | 1.40 | 4.29 | 3.95 | ||
| 4F–M | 0.18 | 70 | 0.93 | 4.05 | 7.82 | 6.43 |
| 80 | 0.88 | 3.81 | 6.79 | 5.48 | ||
| 90 | 0.81 | 3.43 | 5.77 | 4.56 | ||
| 100 | 0.72 | 2.96 | 4.74 | 3.68 | ||
| 2F–M | 0.13 | 70 | 0.91 | 5.92 | 8.05 | 6.65 |
| 80 | 0.84 | 5.42 | 6.98 | 5.64 | ||
| 90 | 0.76 | 4.79 | 6.08 | 4.85 | ||
| 100 | 0.66 | 4.02 | 5.05 | 3.96 | ||
The relaxation master curve obtained by SR theory and the Arrhenius' equation is dominated by the kinetics of dynamic chemistry, instead of the network structure in CANs polymers. The influence of network structure, i.e. cross-linking density, on the temperature-dependent relaxation time can be normalized by the distance parameter ε. It is noted that half of the activation energy for the forward reaction (ca. 20 kJ mol−1) is lower than the binding energy of the DA adduct (ca. 60 kJ mol−1). According to SR theory, the mean time during which the initial DA adduct will find a new partner is the same as the DA bond lifetime.38 The apparent relaxation activation energy of the master curve is anticipated to be the same as the activation energy of the rDA reaction (eqn (9)). Thus, the relaxation master curve derived from stress relaxation tests can allow for the determination of reaction kinetics of dynamic chemistry in the solid state. Therefore, within the temperature range of Tg ∼ Tgel, SR theory provides a direct relationship between the bond lifetime and the relaxation time for CANs polymers.
From the above results, the mechanism of the DA-type CANs well above the gel point was proved to be very similar to that of reversible exchange bond systems. When a DA/rDA reaction equilibrium is approached at a specific temperature, the maleimide conversion or cross-linking density remain constant with time. The relaxation of the DA-type CANs at a relatively mild temperature is determined by the kinetics of dynamic chemistry. The primary distinctions between the relaxation of transesterification-type CANs and DA-type CANs are the different magnitude of τb (or 1/kr) and the variation in cross-linking density. For instance, the rDA reaction shows a much higher kinetic rate constant (100 min−1) than the transesterification enhanced by catalysts (10−4 min−1) at 120 °C.35 The cross-linking density and the relative distance parameter ε remain constant for transesterification-type CANs, but decrease with increasing temperature for DA-type CANs. Despite the above differences, the relaxation mechanism for all CANs polymers is due to the limited lifetime of the dynamic bonds.
This result provide a paradigm to choose the type of dynamic bonds and tune their relaxation behaviour for the rational design of smart materials. For instance, with a relatively weak dynamic bond, increasing the temperature or adding a catalyst, fast local relaxation behaviour can be obtained and efficient healing is possible. For recyclable thermosets, dynamic bonds with lower lifetimes lead to more efficient reprocessing.
3 Conclusions
In summary, we have elucidated the relaxation molecular mechanism of Diels–Alder type CANs polymers well above the gel point by a simple scaling relationship between normalized relaxation time and reaction kinetics. In situ FTIR tests indicate that increasing the temperature results in a shorter lifetime of the dynamic covalent bonds and lower maleimide conversion. The influence of cross-linking density on the temperature-dependent relaxation time can be normalized with the distance from the Flory gel point in terms of conversion. On the basis of the Semenov–Rubinstein theory and Arrhenius' law, a simple scaling relationship between normalized relaxation time and reaction kinetics is established. This scaling relationship is anticipated to have wide applicability to both bond exchange and reversible addition reaction type CANs polymers. We believe our results provide a valuable toolkit for better understanding the structure–property relationship of CANs polymers, thus showing new insight into the responsiveness of smart CANs materials at a molecular scale.Acknowledgements
The authors wish to thank Yanshan Branch, SINOPEC Beijing Research Institute of Chemical Industry for providing the SBR samples.Notes and references
- C. J. Kloxin and C. N. Bowman, Chem. Soc. Rev., 2013, 42, 7161 RSC.
- C. J. Kloxin, T. F. Scott, B. J. Adzima and C. N. Bowman, Macromolecules, 2010, 43, 2643 CrossRef CAS PubMed.
- Y. Jin, C. Yu, R. J. Denman and W. Zhang, Chem. Soc. Rev., 2013, 42, 6634 RSC.
- X. Chen, M. A. Dam, K. Ono, A. Mal, H. Shen, S. R. Nutt, K. Sheran and F. Wudl, Science, 2002, 295, 1698 CrossRef CAS PubMed.
- F. Wang, M. Z. Rong and M. Q. Zhang, J. Mater. Chem., 2012, 22, 13076 RSC.
- B. Ghosh and M. W. Urban, Science, 2009, 323, 1458 CrossRef CAS PubMed.
- X. Kuang, G. M. Liu, X. Dong, X. G. Liu, J. J. Xu and D. J. Wang, J. Polym. Sci., Part A: Polym. Chem., 2015, 53, 2094 CrossRef CAS.
- Y. Amamoto, H. Otsuka, A. Takahara and K. Matyjaszewski, Adv. Mater., 2012, 24, 3975 CrossRef CAS PubMed.
- Y.-X. Lu and Z. Guan, J. Am. Chem. Soc., 2012, 134, 14226 CrossRef CAS PubMed.
- P. Zheng and T. J. McCarthy, J. Am. Chem. Soc., 2012, 134, 2024 CrossRef CAS PubMed.
- J. J. Cash, T. Kubo, A. P. Bapat and B. S. Sumerlin, Macromolecules, 2015, 48, 2098 CrossRef CAS.
- C. Zeng, H. Seino, J. Ren and N. Yoshie, ACS Appl. Mater. Interfaces, 2014, 6, 2753 CAS.
- B. T. hermalMichal, C. A. Jaye, E. J. Spencer and S. J. Rowan, ACS Macro Lett., 2013, 2, 694 CrossRef.
- Q. Zhao, W. Zou, Y. Luo and T. Xie, Sci. Adv., 2016, 2, e1501297 Search PubMed.
- X. Mu, N. Sowan, J. A. Tumbic, C. N. Bowman, P. T. Mather and H. J. Qi, Soft Matter, 2015, 11, 2673 RSC.
- X. Kuang, G. Liu, X. Dong and D. Wang, Polymer, 2016, 84, 1 CrossRef CAS.
- L.-T. T. Nguyen, T. T. Truong, H. T. Nguyen, L. Le, V. Q. Nguyen, T. Van Le and A. T. Luu, Polym. Chem., 2015, 6, 3143 RSC.
- Z. Pei, Y. Yang, Q. Chen, E. M. Terentjev, Y. Wei and Y. Ji, Nat. Mater., 2014, 13, 36 CrossRef CAS PubMed.
- Z. Q. Lei, H. P. Xiang, Y. J. Yuan, M. Z. Rong and M. Q. Zhang, Chem. Mater., 2014, 26, 2038 CrossRef CAS.
- R. Long, H. J. Qi and M. L. Dunn, Soft Matter, 2013, 9, 4083 RSC.
- K. Yu, P. Taynton, W. Zhang, M. Dunn and H. J. Qi, RSC Adv., 2014, 4, 10108 RSC.
- X. Kuang, G. Liu, L. Zheng, C. Li and D. Wang, Polymer, 2015, 65, 202 CrossRef CAS.
- P. Taynton, K. Yu, R. K. Shoemaker, Y. Jin, H. J. Qi and W. Zhang, Adv. Mater., 2014, 26, 3938 CrossRef CAS PubMed.
- O. R. Cromwell, J. Chung and Z. Guan, J. Am. Chem. Soc., 2015, 137, 6492 CrossRef CAS PubMed.
- X. Kuang, G. Liu, X. Dong and D. Wang, Macromol. Mater. Eng., 2016, 301, 535 CrossRef CAS.
- B. J. Adzima, H. A. Aguirre, C. J. Kloxin, T. F. Scott and C. N. Bowman, Macromolecules, 2008, 41, 9112 CrossRef CAS PubMed.
- G. Rivero, L.-T. T. Nguyen, X. K. D. Hillewaere and F. E. Du Prez, Macromolecules, 2014, 47, 2010 CrossRef CAS.
- R. J. Sheridan and C. N. Bowman, Macromolecules, 2012, 45, 7634 CrossRef CAS.
- A. Gandini, Prog. Polym. Sci., 2013, 38, 1 CrossRef CAS.
- L. L. De Lucca Freitas and R. Stadler, Macromolecules, 1987, 20, 2478 CrossRef CAS.
- P. Cordier, F. Tournilhac, C. Soulie-Ziakovic and L. Leibler, Nature, 2008, 451, 977 CrossRef CAS PubMed.
- W. C. Yount, D. M. Loveless and S. L. Craig, J. Am. Chem. Soc., 2005, 127, 14488 CrossRef CAS PubMed.
- L. Imbernon, S. Norvez and L. Leibler, Macromolecules, 2016, 49, 2172 CrossRef CAS.
- K. Yu, P. Taynton, W. Zhang, M. L. Dunn and H. J. Qi, RSC Adv., 2014, 4, 48682 RSC.
- M. Capelot, M. M. Unterlass, F. Tournilhac and L. Leibler, ACS Macro Lett., 2012, 1, 789 CrossRef CAS.
- D. Montarnal, M. Capelot, F. Tournilhac and L. Leibler, Science, 2011, 334, 965 CrossRef CAS PubMed.
- H. Yang, K. Yu, X. Mu, Y. Wei, Y. Guo and H. J. Qi, RSC Adv., 2016, 6, 22476 RSC.
- M. Rubinstein and A. N. Semenov, Macromolecules, 1998, 31, 1386 CrossRef CAS.
- A. N. Semenov and M. Rubinstein, Macromolecules, 1998, 31, 1373 CrossRef CAS.
- D. Stauffer, Phys. Rep., 1979, 54, 1 CrossRef.
- R. J. Sheridan, B. J. Adzima and C. N. Bowman, Aust. J. Chem., 2011, 64, 1094 CrossRef CAS.
- P. J. Flory, J. Am. Chem. Soc., 1941, 63, 3083 CrossRef CAS.
- L. M. Polgar, M. van Duin, A. A. Broekhuis and F. Picchioni, Macromolecules, 2015, 48, 7096 CrossRef CAS.
- E. Passaglia and F. Donati, Polymer, 2007, 48, 35 CrossRef CAS.
- C.-D. Varganici, O. Ursache, C. Gaina, V. Gaina, D. Rosu and B. C. Simionescu, Ind. Eng. Chem. Res., 2013, 52, 5287 CrossRef CAS.
- Y. Zhang, A. A. Broekhuis and F. Picchioni, Macromolecules, 2009, 42, 1906 CrossRef CAS.
- A. Gandini, D. Coelho and A. J. D. Silvestre, Eur. Polym. J., 2008, 44, 4029 CrossRef CAS.
- J. Canadell, H. Fischer, G. De With and R. A. T. M. van Benthem, J. Polym. Sci., Part A: Polym. Chem., 2010, 48, 3456 CrossRef CAS.
- M. J. He, W. X. Chen and X. X. Dong, Polymer physics, Fudan University Press, Shanghai, 2nd edn, 2000 Search PubMed.
- G. Scheltjens, M. M. Diaz, J. Brancart, G. Van Assche and B. Van Mele, React. Funct. Polym., 2013, 73, 413 CrossRef CAS.
- H. J. Herrmann, Phys. Rep., 1986, 136, 153 CrossRef CAS.
Footnote |
| † Electronic supplementary information (ESI) available: Experimental procedures; NMR, FTIR, and stress relaxation graphics. See DOI: 10.1039/c6qm00094k |
| This journal is © the Partner Organisations 2017 |

