Well-structured holographic polymer dispersed liquid crystals by employing acrylamide and doping ZnS nanoparticles†
Mingli
Ni
a,
Guannan
Chen
a,
Hongwei
Sun
b,
Haiyan
Peng
*ac,
Zhifang
Yang
a,
Yonggui
Liao
a,
Yunsheng
Ye
a,
Yingkui
Yang
d and
Xiaolin
Xie
*ae
aKey Laboratory for Material Chemistry of Energy Conversion and Storage, Ministry of Education, School of Chemistry and Chemical Engineering, Huazhong University of Science and Technology, Wuhan 430074, China. E-mail: xlxie@mail.hust.edu.cn
bNorth Huajin Chemical Industries Group Corporation, Panjin 124021, China
cShenzhen Institutes of Advanced Technology, Chinese Academy of Sciences, Shenzhen 518055, China. E-mail: hypeng@hust.edu.cn
dKey Laboratory for Green Preparation and Application of Functional Materials, Ministry of Education, School of Materials Science and Engineering, Hubei University, Wuhan 430062, China
eNational Anticounterfeit Engineering Research Center, Wuhan 430074, China
First published on 4th August 2016
Abstract
High diffraction efficiency and low driving voltage are typically considered to be prerequisites for the practical applications of holographic polymer dispersed liquid crystals (HPDLCs), which are especially critical for their use in the state-of-the-art low-threshold mirrorless tunable lasers. Nevertheless, high driving voltages are usually resulted for HPDLCs upon increasing the holographic diffraction efficiency via optimizing the monomer/LC formulations. Herein, we present that doping nanoparticles into HPDLCs with controlled distribution is a facile and efficient approach to circumvent the aformentioned issues. Zinc sulfide (ZnS) nanoparticle doped HPDLCs with high diffraction efficiency (94.0 ± 2.1%), and a low threshold driving voltage of 2.5 V µm−1 that is decreased from 11.6 V µm−1 for the pristine form, are achieved by doping 8 wt% ZnS nanoparticles into the HPDLCs based on an acrylamide monomer, N,N-dimethylacrylamide, that contributes significantly to the high diffraction efficiency up to 98.2 ± 1.4%.
1. Introduction
The integration of liquid crystals (LCs) into polymers with ordered micro/nanostructures holds great promise to afford lightweight and flexible optical and optoelectronic devices in a large area for a myriad of applications such as photonic crystals,1,2 microlenses,3,4 mirrorless tunable lasers,5–7 data storage and 3D image storage,8–10 and 3D displays.11 Holographic photopolymerization induced phase separation,8–16 compared to other techniques, has become a more prevalent approach in the last few decades to construct ordered polymer/LC composites owing to the ease of device construction in a single-step as well as the distinct capability of arbitrary 3D construction with desired spatial accuracy. During the holographic photopolymerization induced phase separation, photopolymerization is triggered to take place in the bright regions of interference patterns generated by coherent laser beams, subsequently driving monomers to diffuse from dark areas into the bright regions to participate in the polymerization reaction, while the LCs are squeezed to diffuse toward the dark regions, finally yielding holographic polymer dispersed liquid crystals (HPDLCs) with periodical distribution of polymers and LCs.High diffraction efficiency HPDLCs with well-defined structures are desired for their practical applications, especially for their use in low-threshold mirrorless tunable lasers, as the uniformity of gratings strongly affects the laser emission performance.17 Photonic bandgap gratings with high spatial resolution, high quality periodic structures, and uniform interfaces are desired as the interfaces work as “mirrors” for laser interference and energy confinement between the antinodes.17–19 Toward this end, considerable research efforts have been paid to control the micromorphology of HPDLCs by tuning the photopolymerization kinetics, gelation and phase separation process.8,9,20,21 Different types of monomers,13,22 monomer functionalities,21,23,24 LC contents,24,25 recording temperatures20 and light intensities,24,25 together with the photoinitiating systems26 have been considered. Recently, our group disclosed a novel photoinitibitor composed of 3,3′-carbonylbis(7-diethylaminocoumarin) (KCD) and N-phenylglycine (NPG),8,9,27 in which, amino-alkyl radicals for initiation and ketyl radicals for polymerization inhibition were simultaneously generated upon exposure to a monochromatic visible light source, as a useful protocol to tailor the phase separation structure and consequent diffraction efficiency.8,9 Though high diffraction efficiency HPDLCs with well-defined phase separation structures have been afforded by carefully taloring the formulations,8,13 HPDLC gratings with high diffraction efficiency are always accompanied by high driving voltage,9,13,20–22,28 limiting their practical applications as electro-optical devices. Thus, it remains a formidable challenge albeit a necessary pursuit to lower down the driving voltage of HPDLCs while maintaining their high diffraction efficiency and well-defined phase separation structures.
To lower down the switching voltage of HPDLC gratings, either decreasing the surface anchoring energy or increasing the conductivity ratio of polymers to LCs has been implemented.8,9 We recently disclosed that the photoinitibitor composed of KCD and NPG was not only able to increase the phase separation and consequent diffraction efficiency of holograms,9,27 but also enabled the decrease of the driving voltage of HPDLCs based on a hyperbranched monomer because of the decreased surface anchoring energy;8 nevertheless, the threshold driving voltage is still as high as 4.6 V µm−1. Nanomaterials have been playing a central role in almost every aspect of both academia and industry, and exhibit special characteristics in photocatalysis,29 sensing, imaging, drug delivery and therapy,30,31 energy conversion and storage,32–35 and many other areas. The extremely active research on organic–inorganic hybrid systems provides the possibility of realizing HPDLCs with both high diffraction efficiency and low driving voltage, owing to their unique electric and optical properties.36–38 Inorganic components on the nanoscale, such as silica,39,40 titanium dioxide,41 graphene,42 graphene oxide,43 carbon nanotubes,44 gold,45 silver,45,46 and polyhedral oligomeric silsesquioxane,47 have been employed to tailor the diffractive and electro-optical properties of HPDLCs. Kim and co-workers revealed that the driving voltage of HPDLC transmission gratings could be decreased when doped with graphene or graphene oxide because of the increased conductivity of polymer matrices.42,43 However, the diffraction efficiency in these HPDLCs was also depressed with a more than 0.1 wt% doping. Braun's group incorporated functionalized and unfunctionalized silica nanoparticles into HPDLC reflection gratings, respectively, and demonstrated via transmission electron microscopy that the functionalized silica nanoparticles predominantly located in the polymer-rich regions while the non-functionalized silica was primarily distributed in the LC-rich regions.39 The unfunctionalized silica located in the LC regions deteriorated the switching capability of LCs in HPDLCs, while the functionalized silica located in the polymer rich regions was able to afford lower driving voltage. Despite the extensive research, HPDLCs doped with nanoparticles are far beyond full understanding, and few reports successfully achieved HPDLCs with both high diffraction efficiency and low driving voltage.
In this contribution, a useful strategy is employed to lower down the driving voltage of HPDLC gratings by doping synthesized ZnS nanoparticles. ZnS nanoparticles with a small size of less than 10 nm capable of avoiding light scattering can be easily synthesized from cheap raw materials.48 The negligible light scattering is profitable to enhance the laser pump efficiency and lasing output in mirrorless tunable lasers.7 In addition, the semiconductor nature of ZnS49 is expected to be capable of increasing the conductivity of the polymer matrix and thus decreasing the driving voltage if located in the polymer-rich regions of HPDLCs. To form well-dispersed mixtures for holography, an acrylamide monomer, i.e. N,N-dimethylacrylamide (DMAA), is utilized to disperse and stabilize the ZnS nanoparticles.27,50,51 Acrylamide monomers and their polymers present vast adaptability in broad fields of electrodes,52 hydrogels,53 and high refractive index materials50,51 due to their good solubility, hydrophilicity, and stable performance. Furthermore, DMAA is able to dissolve the solid photoinitiating system due to its polar nature, and leads to simplified processing by substituting N-vinylpyrrolidone (NVP) that is indispensable in previous reports.8,9,13,54
Through a systematic study, HPDLC nanocomposites with well-defined microstructures, a high diffraction efficiency of 94.0 ± 2.1% and a low driving voltage of 2.5 V µm−1 are successfully achieved, which show great promise to be used in mirrorless tunable lasers and other functional electro-optical applications.
2. Experimental
2.1 Materials
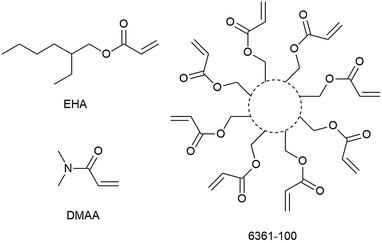
N,N-Dimethylacrylamide (DMAA, purity: 98%) was supplied by J&K Scientific. 2-Ethylhexyl acrylate (EHA, purity: >99%) was received from Acros Organics. 6361-100, an acrylate monomer with a functionality of eight, was donated by Eternal Chemical Co., Ltd, China. LC P0616A (Δn = 0.20, ne(589nm,293K) = 1.72, TNI = 331 K) was purchased from Shijiazhuang Chengzhi Yonghua Display Materials Co., Ltd, China. 3,3′-Carbonylbis(7-diethylaminocoumarin) (KCD, purity: 99%) was purchased from Aldrich. N-Phenylglycine (NPG, purity: 98%) was received from Aladdin. All chemicals were used as received. ZnS nanoparticles with a diameter of ∼5 nm were synthesized as previously reported.272.2 Fabrication and characterization of HPDLC gratings
Monomers DMAA, EHA and 6361-100 (Scheme 1), LC P0616A, ZnS nanoparticles as well as the photoinitibitor composed of KCD and NPG were added into amber glass bottles, and ultrasonicated at 303 K for 30 min to obtain homogeneous holographic mixtures. The formulation for each entry is listed in Table 1, in which the loading of KCD and NPG is kept as 0.6 wt% and 1.3 wt%, respectively, of the total mass of LCs, monomers and ZnS nanoparticles. Then the holographic mixtures were added to a LC cell consisting of two pieces of inner ITO-coated glass (24 mm × 26 mm), and 10 µm thick glass spaces. Two equal-intensity laser beams, coming from one 442 nm He–Cd laser source, were used to irradiate the samples at an external angle of 32°, which was supposed to generate holograms with a period of 802 nm in line with the Bragg law.13 The light intensity of each laser beam was 10 mW cm−2 and the exposure time was set as 20 seconds. All samples were flood cured for 5 min using a mercury lamp after holographic recording.| Entry | DMAA (wt%) | EHA (wt%) | 6361-100 (wt%) | ZnS (wt%) | P0616A (wt%) |
|---|---|---|---|---|---|
| a The average monomer functionality was fixed at 3.3 for each entry. b 5 wt% NVP was added to dissolve the photoinitibitor. | |||||
| 1#b | 0 | 39.7 | 22.3 | 0 | 33.0 |
| 2# | 7.5 | 37.2 | 22.3 | 0 | 33.0 |
| 3# | 14.9 | 29.8 | 22.3 | 0 | 33.0 |
| 4# | 22.3 | 22.3 | 22.3 | 0 | 33.0 |
| 5# | 29.8 | 14.9 | 22.3 | 0 | 33.0 |
| 6# | 37.2 | 7.5 | 22.3 | 0 | 33.0 |
| 7# | 44.7 | 0 | 22.3 | 0 | 33.0 |
| 8# | 43.3 | 0 | 21.7 | 2 | 33.0 |
| 9# | 42.0 | 0 | 21.0 | 4 | 33.0 |
| 10# | 40.7 | 0 | 20.3 | 6 | 33.0 |
| 11# | 39.3 | 0 | 19.7 | 8 | 33.0 |
A 2 mW 633 nm He–Ne laser (Thorlabs, USA) was utilized to non-destructively measure the diffraction efficiency of HPDLC gratings, and a liquid crystal display parameter tester (LCT-5016C, North LC Engineering Research and Development Centre, China) was used to characterize the electro-optical properties of HPDLC gratings.9,13 4–6 independent samples in parallel were characterized to give the average number of diffraction efficiency.
2.3 Differential scanning calorimetry analysis
A differential scanning calorimeter (P-DSC, Q2000, TA) with photo-cure accessories was employed to measure the photopolymerization rate and double-bond conversion in the holographic mixtures. About 10 mg of the sample was added to a T-zero aluminum pan, then placed on one DSC sample holder. An empty T-zero aluminum pan was put on another sample holder as reference simultaneously. After being purged by a 50 mL min−1 nitrogen flow at 303 K for 5 min, the pans were irradiated for 20 min from the top by two independent light beams with an intensity of 10 mW cm−2 for each, guided from a high pressure mercury lamp (S2000, Omnicure) and filtered by a pair of 442 nm filters. The photopolymerization rate and double-bond conversion were calculated according to the reported method.9,13,27The PDLC samples obtained after the P-DSC test were used to estimate the phase separation degree of LCs. Before characterization, all samples were irradiated by 20 mW cm−2 365 nm light for 20 min for fully curing the samples. Then, the samples were heated from 303 to 353 K with a 5 K min−1 ramping rate under 50 mL min−1 nitrogen protection. The fraction of LCs in the form of nematic droplets was calculated according to the following equation,21
 | (1) |
2.4 Characterization of viscosity, gelation and volume shrinkage
The viscosities of holographic mixtures were tested using a rotational rheometer (MCR 302, Anton-Paar). The holographic mixtures were sandwiched by two parallel plates with a diameter of 25 mm and a gap of 0.5 mm under 303 K. The shear rate was ramped from zero to 100 s−1.The photopolymerization induced volume shrinkage of holographic mixtures with different content of ZnS nanoparticles was measured by the rotational rheometer (MCR 302, Anton-Paar) equipped with photo-cure accessories as reported.27,55,56 The normal force was kept as 0 N and the initial gap was set as 0.5 mm. Before testing, samples were purged with nitrogen for 5 min, and then irradiated with 190 mW cm−2 320–500 nm light (S2000, Omnicure). High light intensity was employed here to fully cure the thick samples. The volume shrinkage was calculated according to the thickness decrease of sandwiched samples during light exposure.
The gelation time of holographic mixtures was also measured using the rotational rheometer with photo-cure accessories. The samples were irradiated with 10 mW cm−2 monochromatic 442 nm light subsequent to the nitrogen purge for 5 min. The frequency, strain and gap were set as 1 Hz, 15% and 0.1 mm, respectively.
2.5 Micromorphology characterization
The micromorphology of HPDLC gratings was characterized using a scanning electron microscope (SEM, Sirion 200, FEI). Before the test, the HPDLC gratings were soaked in n-hexane for 72 hours to remove LCs, followed by drying at room temperature and platinum spraying. EDAX tests of the Zn, C, O, and N elements were implemented to estimate the ZnS nanoparticle content in the polymer matrix after LC removal.3. Results and discussion
3.1 Effects of DMAA content on photopolymerization kinetics, gelation and bulk phase separation
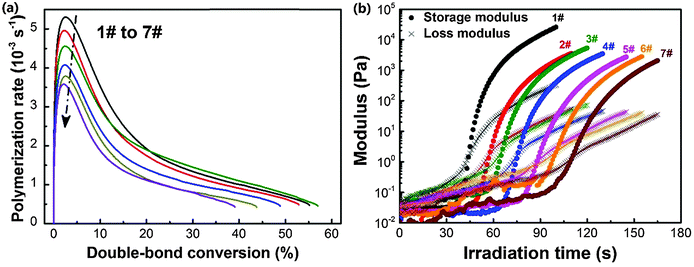
The diffractive and electro-optical performances of HPDLC gratings are highly dependent on the monomers since the polymerization rate, gelation and phase separation process are significantly influenced by the chemical properties of monomers. Thus, the performances of HPDLC gratings can be tuned by changing the monomer formulations in holographic mixtures. To isolate the DMAA influence, we only changed the DMAA and EHA contents while fixing the average monomer functionality at 3.3 (Table 1).The influence of the DMAA monomer on the photopolymerization kinetics of holographic mixtures is illustrated in Fig. 1a. When the DMAA content increases from zero to 44.7 wt%, the double-bond conversion at the maximum photopolymerization rate is almost identical at 2.5% for each entry, and the maximum photopolymerization rate decreases by 32% (i.e., from 5.3 × 10⁻³ to 3.6 × 10⁻³ s−1). As the standard enthalpy of double-bond reaction is identical for EHA and DMAA,21,57 the depressed reaction rate at a fixed double-bond conversion on substituting EHA with DMAA is supposed to be caused by the lower reactivity of acrylamides compared to acrylates, in line with the photopolymerization kinetics equation.8 This interpretation is confirmed by the fact that the propagation rate constant is 11![[thin space (1/6-em)]](https://www.rsc.org/images/entities/char_2009.gif) 000 L mol−1 s−1 for DMAA58 and ∼25
000 L mol−1 s−1 for DMAA58 and ∼25![[thin space (1/6-em)]](https://www.rsc.org/images/entities/char_2009.gif) 400 L mol−1 s−1 for EHA59 at 323 K, respectively, while the termination constant is almost the same.58,60
400 L mol−1 s−1 for EHA59 at 323 K, respectively, while the termination constant is almost the same.58,60
The photorheology results are displayed in Fig. 1b. It can be seen that the storage and loss moduli of holographic mixtures increase when irradiated by light because of the molecular weight increase during photopolymerization. The time at the crossover of storage and loss moduli is considered as the gelation time.9,27,61 When increasing the DMAA content from zero to 44.7 wt%, the gelation time increases by 1.5 times (i.e., from 44 to 111 s). The decreased photopolymerization kinetics is suspected to be the major factor contributing to the gelation time delay.
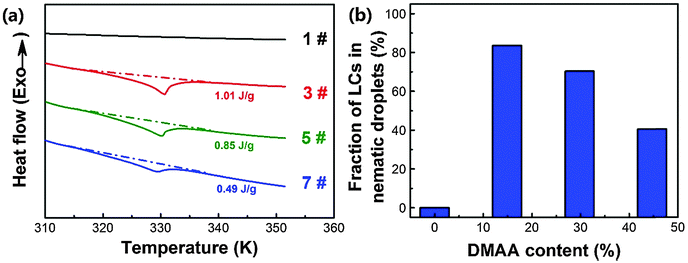
As the performances of HPDLC gratings are significantly influenced by the degree of phase separation between the polymer and LCs during photopolymerization, we investigated the effect of the DMAA monomer on the phase separation. The fraction of nematic LC droplets formed in PDLCs can be used to predict the degree of bulk phase separation. The heat flow curves of PDLC samples when heated from room temperature to 353 K are illustrated in Fig. 2a, which shows that there is no detectable phase transition near 331 K (nematic–isotropic phase transition point of the LC P0616A) for entry 1# without DMAA. When incorporating a 14.9 wt% DMAA monomer, the phase transition enthalpy of LCs in the PDLCs increases to 1.01 J g−1. However, upon further increasing the DMAA content, the phase transition enthalpy dramatically decreases, which is only 0.49 J g−1 for entry 7# with 44.7 wt% DMAA. The phase transition enthalpy variation indicates that the fraction of the nematic LCs in the PDLCs firstly increases from zero to 84%, and then decreases to 41% (Fig. 2b), based on the calculation using eqn (1). The DMAA content dependent bulk phase separation can be interpreted by the fact that the solubility parameter of DMAA (21.7 J0.5 cm−1.5) is calculated to be much closer to that of LC P0616A (23.1 J0.5 cm−1.5) than that for EHA (16.9 J0.5 cm−1.5).62
3.2 Effect of DMAA content on the diffraction efficiency of HPDLC gratings
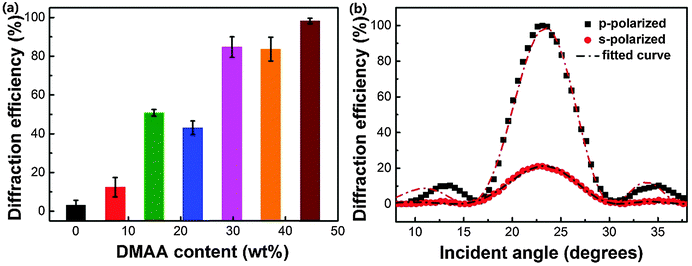
Fig. 3a displays the relation of p-polarized diffraction efficiency of the fabricated HPDLC transmission gratings to DMAA content, which clearly presents that higher diffraction efficiencies are generally given for the gratings with higher DMAA content. For instance, in the absence of DMAA, the diffraction efficiency is quite low (3.1 ± 2.5%). When the DMAA content is higher than 29.8 wt%, the diffraction efficiency reaches higher than 80%. The highest diffraction efficiency, 98.2 ± 1.4%, is afforded when there is a complete substitution of EHA by DMAA.Generally, a high degree of phase separation in HPDLCs is expected to offer high diffraction efficiency due to the enhanced refractive index difference between the polymer-rich regions and LC-rich domains, especially for those systems with fixed monomer/LCs ratios.8,9,14 Therefore, as the DMAA content increases from zero to 14.9 wt%, the grating diffraction efficiency dramatically increases by 31.4% due to the increased phase separation as shown in Fig. 2. Nevertheless, the diffraction efficiency of HPDLC gratings is still relatively low (∼50%) as it is usually significantly influenced by the light scattering of LC droplets.63,64 Larger LC droplets typically lead to higher light scattering and consequently lower diffraction efficiency. Thus, though further increasing the DMAA concentration results in lower phase separation as depicted in Fig. 2, small LC droplet size is also given which is believed to enhance the diffraction efficiency (the evidence to illustrate LC droplet size decrease will be given using SEM images below). Well-structured HPDLCs with small light scattering are expected to be valuable to offer high laser pump efficiency and lasing output in mirrorless tunable lasers.7 We may conclude here that optimal phase separation is required to achieve desired HPDLC gratings when varying the monomer systems, as observed previously by Bunning T. J. and Guymon C. A. and their co-workers.63,64
It is worth mentioning that the diffraction efficiency of HPDLC gratings is usually highly dependent on the polarization state of the probe laser. As shown in Fig. 3b, the p-polarized diffraction efficiency of the HPDLCs with 44.7 wt% DMAA reaches nearly 100%, while the s-polarized one is only 21%, indicating that the director of LCs in these HPDLC gratings is parallel to the grating vector.65 The refractive index modulation of HPDLCs is obtained by fitting the incident angle dependent diffraction efficiency in Fig. 3b using Kogelnik's coupled wave theory,55,66,67 which is 26.9 × 10⁻³ and 8.9 × 10⁻³ for the p-polarized and s-polarized incident laser beams, respectively.
3.3 Effect of DMAA content on the electro-optical performance of HPDLC gratings
The effect of DMAA content on the electro-optical performance of HPDLC gratings is shown in Fig. 4. It can be seen that there is no observable diffraction decay when the applied voltage is low, but the diffraction efficiency of HPDLC gratings dramatically decreases when a higher voltage is applied and finally reaches a plateau when the electric field continues to increase. The threshold voltage is calculated to be increased from 3.6 to 11.6 V µm−1 when the DMAA content increases from 14.9 to 44.7 wt%, which is supposed to be caused by the decreased LC droplet size,14 as well as the increased surface anchoring energy.8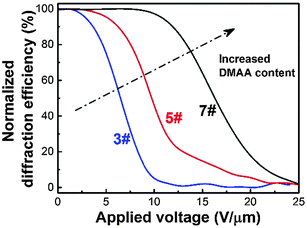 | ||
| Fig. 4 Normalized diffraction efficiency of HPDLC gratings with 14.9 wt% (3#), 29.8 wt% (5#) and 44.7 wt% (7#) DMAA versus the applied voltage. | ||
3.4 Effect of DMAA content on the micromorphology of HPDLC gratings
To further understand the effects of DMAA on the diffraction efficiency and electro-optical performances of HPDLC gratings, the micro-morphological structures of HPDLC gratings with different DMAA content were observed by SEM. As shown in Fig. 5a, a one-dimensional periodical structure is barely visible in the absence of DMAA. As the DMAA content increases from zero to 14.9 wt%, “dark holes” representing the original location of LC droplets are identifiable in the LC-rich regions (Fig. 5b), indicating an increased phase separation with increasing DMAA content, leading to an increase of diffraction efficiency shown in Fig. 3a. As the DMAA loading further increases, the LC droplet size reduces, which is verified by the reduced average area of the dark holes from 0.03 to 0.01 µm2 when the DMAA loading increases from 14.9 to 29.8 wt% (Fig. 5b and c). The LC droplet size decrease is expected to result in a higher driving voltage as demonstrated in Fig. 4, according to the following equation,14 | (2) |
 | ||
| Fig. 5 SEM images of the HPDLC gratings with varied DMAA content after LC removal by n-hexane: (a) without DMAA; (b) 14.9 wt% DMAA; (c) 29.8 wt% DMAA and (d) 44.7 wt% DMAA. Scale bar: 5 µm. | ||
3.5 Effects of ZnS nanoparticles on photopolymerization kinetics and volumetric shrinkage
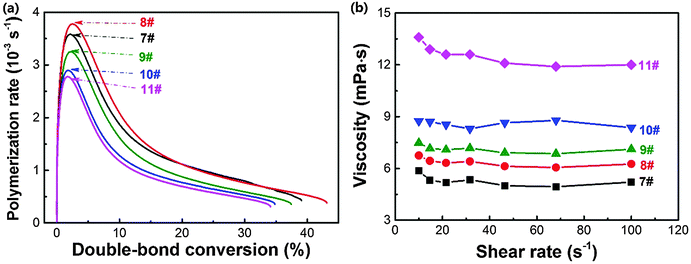
Cho and co-workers69 reported that adding less than 15 wt% nanosilica increased the photopolymerization rate and double-bond conversion of 1,6-hexanediol diacrylate, indicating an increased reactivity. However, Wan and co-workers proved that the addition of titanium dioxide nanoparticles decreased the polymerization rate and double-bond conversion of hybrid acrylate monomers.70 Recently, we demonstrated that adding ZnS nanoparticles depressed the photopolymerization kinetics due to the dramatically increased viscosity.27 It seems that the effect of nanoparticles on the photopolymerization is complicated.The photopolymerization rate versus double-bond conversion of holographic mixtures with different amounts of doped ZnS nanoparticles is shown in Fig. 6a. Upon adding 2 wt% ZnS nanoparticles into the holographic mixtures, the maximum photopolymerization rate and double-bond conversion after 20 min of light illumination slightly increased by 5.6% (i.e., from 3.6 × 10⁻³ to 3.8 × 10⁻³ s−1) and 10.3% (i.e., 39% to 43%), respectively. By contrast, upon incorporating 8 wt% ZnS nanoparticles, the maximum photopolymerization rate and overall double-bond conversion decreased to 2.8 × 10⁻³ s−1 and 34%, respectively. It is speculated that ZnS nanoparticles here are able to increase system reactivity at a low doping level, while depressing the diffusion of monomers at a higher loading level due to the obviously increased viscosity (Fig. 6b).
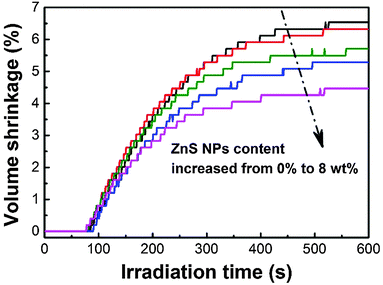
The volume shrinkage of photopolymers due to the replacement of van der Waals distance between monomers by covalent distance after polymerization is considered to be a major hurdle for the reliable use of photopolymers.71 The polymerization induced volume shrinkage of acrylates is determined by their double-bond concentration, conversion and the shrinkage factor.72 Distinct from the complex effect of incorporated nanoparticles on the photopolymerization kinetics, nanoparticle doping is always capable of reducing the volume shrinkage of photopolymers.73–75 As shown in Fig. 7, after being irradiated by 190 mW cm−2 320–500 nm light for 10 min, the volume shrinkage decreases by 31% (i.e., from 6.5 to 4.5 vol%) with increasing ZnS nanoparticles from zero to 8 wt%.
3.6 Effects of ZnS nanoparticles on the diffraction efficiency, electro-optical performance, and micromorphology of HPDLC gratings
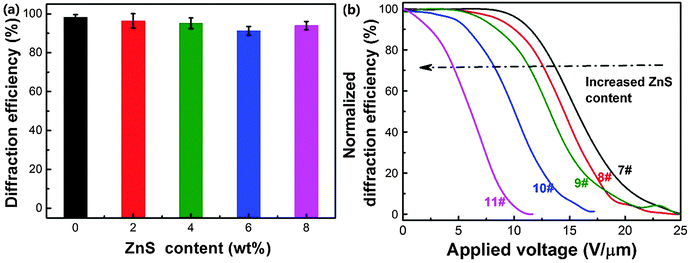
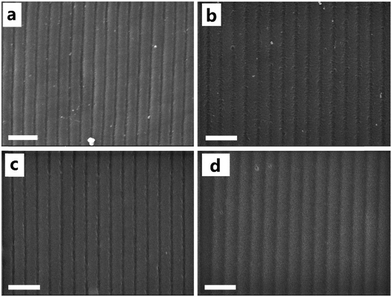
Fig. 8a shows the p-polarized diffraction efficiency of ZnS nanoparticle doped HPDLC gratings. It can be seen that the doping of ZnS nanoparticles does not show a significant influence on the diffraction efficiency of HPDLC gratings, and the diffraction efficiency is 94.0 ± 2.1% when the doping is 8 wt%. However, the threshold voltage monotonously decreases from 11.6 to 2.5 V µm−1 (Fig. 8b), decreasing by 78%. SEM images show that there is no apparent change in the micromorphology of HPDLCs upon varying the ZnS content, and the well-defined scaffold structures are retained (Fig. 9).The spatial distribution of doped nanoparticles has been demonstrated to be able to significantly affect the electro-optical properties of HPDLCs,39 and thus, it is important to make it clear where the ZnS nanoparticles locate in the HPDLC gratings. It is reasonable to conclude that the ZnS nanoparticles primarily locate in the polymer-rich regions in this work for the following three reasons. Firstly, the surface-functionalized ZnS nanoparticles have been demonstrated to be well-dispersed in the DMAA monomer and its copolymers27,50 but incompatible with LC P0616A (as shown in Fig. S1, ESI†). Secondly, the surface-functionalized nanoparticles tend to locate in the polymer-rich region as previously reported when doping surface-functionalized nanosilica in HPDLCs.39 Thirdly, the dramatically decreased switching voltage and negligible variation of segregation morphology when doping ZnS nanoparticles indicate that the ZnS nanoparticles significantly increased the low-frequency conductivity of polymer-rich regions, on the basis of eqn (2). As a matter of fact, the conductivity of ZnS (>10−8 S cm−1)76 is several orders of magnitude higher than that of polyacrylamide (<10−12 S cm−1).77 The last and direct evidence is that the weight fraction of the Zn element among the C, N, O and Zn elements within polymer gratings after LC removal linearly increases with the doping content of ZnS nanoparticles from the semi-quantitative EDAX analysis (Fig. S2, ESI†).
To show a clear picture for understanding the formation process of HPDLCs doped with ZnS nanoparticles, we illustrate a proposed multi-component diffusion in Scheme 2. When irradiated by interference patterns of two coherent laser beams, the monomers diffused into the bright regions, while the LCs and ZnS nanoparticles diffused into dark regions. However, the diffusion rate for ZnS was much lower than that for LCs due to its much smaller Stokes–Einstein diffusion coefficient that resulted from its larger size.27 Thus, the LCs occupied the dark regions before the ZnS nanoparticles arrived and prevented ZnS nanoparticles from diffusing into dark regions due to the incompatible nature of ZnS nanoparticles with LCs. Consequently, the ZnS nanoparticles located in the polymer-rich regions after gelation.
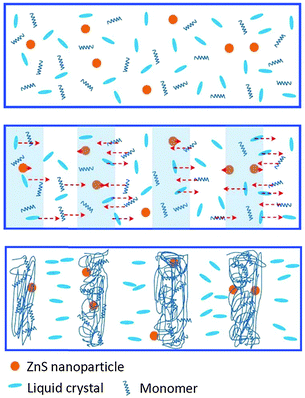 | ||
| Scheme 2 Multi-component diffusion of monomers, LCs and ZnS nanoparticles during holographic recording. | ||
4. Conclusions
Strong polarity and good dissolving capacity of the acrylamide monomer, DMAA, enabled the formation of fine HPDLC materials without the need for using other additives like NVP. Upon replacing the EHA monomer by the DMAA monomer in steps, the micromorphology of the fabricated HPDLC gratings changed from barely visible grating structures to periodical structures with distributed LC droplets, and finally well-defined scaffold structures. These micromorphology changes resulted in an enhanced diffraction efficiency up to 98.2 ± 1.4%. Nevertheless, the substitution of EHA by DMAA led to an increased driving voltage, which was suspected to be caused by the decreased LC droplet size as well as the increased interface anchoring energy of the polymer on LCs.Doping 2 to 8 wt% ZnS nanoparticles into the HPDLCs was observed to significantly decrease the driving voltage of HPDLC nanocomposites, while maintaining the diffraction efficiency at a high level. The doped ZnS nanoparticles were believed to be predominantly located in the polymer-rich regions of HPDLC gratings.
In summary, we successfully fabricated fine ZnS nanoparticle doped HPDLC gratings with well-defined phase separation structures, as high as 94.0 ± 2.1% diffraction efficiency and a low driving voltage of 2.5 V µm−1, by the DMAA monomer incorporation and ZnS nanoparticle doping, which hold great potential for applications in electricity tuneable diffractive optical elements, mirrorless tuneable lasers, 3D image storage, and so forth.
Acknowledgements
We appreciate the financial support from the Key Program (51433002) and Young Scientists Project (51503045) of the National Natural Science Foundation of China. H. Y. Peng also thanks the research funding from the Guangdong Province (2014A030310218) and Shenzhen City (JCYJ20140617143643478) for basic research, and Nansha District in Guangzhou (2014KF06) for technology adventure. We also want to express our grateful appreciation of the technical assistance from the Analytical and Testing Center of HUST.Notes and references
- G. Zito and S. Pissadakis, Opt. Lett., 2013, 38, 3253–3256 CrossRef CAS PubMed
.
- V. P. Tondiglia, L. V. Natarajan, R. L. Sutherland, D. Tomlin and T. J. Bunning, Adv. Mater., 2002, 14, 187–191 CrossRef CAS
.
- C.-H. Chiu, H.-L. Kuo, P.-C. Chen, C.-H. Wen, Y.-C. Liu and H.-M. P. Chen, Appl. Phys. Lett., 2006, 88, 073509 CrossRef
.
- H. Ren, Y.-H. Fan and S.-T. Wu, Opt. Lett., 2004, 29, 1608–1610 CrossRef PubMed
.
-
J. Ma, W. Huang, L. Xuan and H. Yokoyama, in Optical Properties of Functional Polymers and Nano Engineering Applications, ed. V. Jain and A. Kokil, CRC, 2014 Search PubMed
.
- Z. Diao, S. Deng, W. Huang, L. Xuan, L. Hu, Y. Liu and J. Ma, J. Mater. Chem., 2012, 22, 23331–23334 RSC
.
- L. Liu, L. Xuan, G. Zhang, M. Liu, L. Hu, Y. Liu and J. Ma, J. Mater. Chem. C, 2015, 3, 5566–5572 RSC
.
- H.-Y. Peng, G.-N. Chen, M.-L. Ni, Y. Yan, J.-Q. Zhuang, V. A. L. Roy, R. K. Y. Li and X.-L. Xie, Polym. Chem., 2015, 6, 8259–8269 RSC
.
- H.-Y. Peng, S.-G. Bi, M.-L. Ni, X.-L. Xie, Y.-G. Liao, X.-P. Zhou, Z.-G. Xue, J.-T. Zhu, Y. Wei, C. N. Bowman and Y.-W. Mai, J. Am. Chem. Soc., 2014, 136, 8855–8858 CrossRef CAS PubMed
.
- F.-K. Bruder, R. Hagen, T. Rölle, M.-S. Weiser and T. Fäcke, Angew. Chem., Int. Ed., 2011, 50, 4552–4573 CrossRef CAS PubMed
.
- K. N. Wang, J. H. Zheng, H. Gao, F. Y. Lu, L. J. Sun, S. Yin and S. L. Zhuang, Opt. Express, 2015, 23, 31436–31445 CrossRef PubMed
.
- K. Liu, H. Xu, H. Hu, Q. Gan and A. N. Cartwright, Adv. Mater., 2012, 24, 1604–1609 CrossRef CAS PubMed
.
- H.-Y. Peng, M.-L. Ni, S.-G. Bi, Y.-G. Liao and X.-L. Xie, RSC Adv., 2014, 4, 4420–4426 RSC
.
- T. J. Bunning, L. V. Natarajan, V. P. Tondiglia and R. L. Sutherland, Annu. Rev. Mater. Sci., 2000, 30, 83–115 CrossRef CAS
.
- D. M. Smith, C. Y. Li and T. J. Bunning, J. Polym. Sci., Part B: Polym. Phys., 2014, 52, 232–250 CrossRef CAS
.
- D. Luo, Q. G. Du, H. T. Dai, H. V. Demir, H. Z. Yang, W. Ji and X. W. Sun, Sci. Rep., 2012, 2, 627 CAS
.
- Y. J. Liu, X. W. Sun, P. Shum, H. P. Li, J. Mi, W. Ji and X. H. Zhang, Appl. Phys. Lett., 2006, 88, 061107 CrossRef
.
- J. P. Dowling, M. Scalora, M. J. Bloemer and C. M. Bowden, J. Appl. Phys., 1994, 75, 1896–1899 CrossRef CAS
.
- D. E. Lucchetta, F. Vita, R. Castagna, O. Francescangeli and F. Simoni, Photonics Nanostruct., 2012, 10, 140–145 CrossRef
.
- R. Caputo, L. De Sio, A. Veltri, C. Umeton and A. V. Sukhov, Opt. Lett., 2004, 29, 1261–1263 CrossRef PubMed
.
- M. De Sarkar, N. L. Gill, J. B. Whitehead and G. P. Crawford, Macromolecules, 2003, 36, 630–638 CrossRef CAS
.
- M. W. Jang, T.-H. Yoon and B. K. Kim, J. Polym. Sci., Part B: Polym. Phys., 2012, 50, 938–943 CrossRef CAS
.
- R. T. Pogue, L. V. Natarajan, S. A. Siwecki, V. P. Tondiglia, R. L. Sutherland and T. J. Bunning, Polymer, 2000, 41, 733–741 CrossRef CAS
.
- M. S. Park and B. K. Kim, Nanotechnology, 2006, 17, 2012–2017 CrossRef CAS
.
- Y. Liu, B. Zhang, Y. Jia and K. Xu, Opt. Commun., 2003, 218, 27–32 CrossRef CAS
.
- L. V. Natarajan, D. P. Brown, J. M. Wofford, V. P. Tondiglia, R. L. Sutherland, P. F. Lloyd and T. J. Bunning, Polymer, 2006, 47, 4411–4420 CrossRef CAS
.
- M.-L. Ni, H.-Y. Peng, Y.-G. Liao, Z.-F. Yang, Z.-G. Xue and X.-L. Xie, Macromolecules, 2015, 48, 2958–2966 CrossRef CAS
.
- J. H. Park and B. K. Kim, J. Polym. Sci., Part A: Polym. Chem., 2013, 51, 1255–1261 CrossRef CAS
.
- Y. Ma, X. Wang, Y. Jia, X. Chen, H. Han and C. Li, Chem. Rev., 2014, 114, 9987–10043 CrossRef CAS PubMed
.
- V. Biju, Chem. Soc. Rev., 2014, 43, 744–764 RSC
.
- S. Zeng, D. Baillargeat, H.-P. Ho and K.-T. Yong, Chem. Soc. Rev., 2014, 43, 3426–3452 RSC
.
- X. Su, Q. Wu, J. Li, X. Xiao, A. Lott, W. Lu, B. W. Sheldon and J. Wu, Adv. Energy Mater., 2014, 4, 1300882 CrossRef
.
- Y. Bai, I. Mora-Seró, F. De Angelis, J. Bisquert and P. Wang, Chem. Rev., 2014, 114, 10095–10130 CrossRef CAS PubMed
.
- X. Rui, H. Tan and Q. Yan, Nanoscale, 2014, 6, 9889–9924 RSC
.
- K. Zhang, X. Han, Z. Hu, X. Zhang, Z. Tao and J. Chen, Chem. Soc. Rev., 2015, 44, 699–728 RSC
.
- P. G. Bruce, B. Scrosati and J.-M. Tarascon, Angew. Chem., Int. Ed., 2008, 47, 2930–2946 CrossRef CAS PubMed
.
- J. Li and J. Z. Zhang, Coord. Chem. Rev., 2009, 253, 3015–3041 CrossRef CAS
.
- C. Lu and B. Yang, J. Mater. Chem., 2009, 19, 2884–2901 RSC
.
- J. D. Busbee, A. T. yuhl, L. V. Natarajan, V. P. Tongdilia, T. J. Bunning, R. A. Vaia and P. V. Braun, Adv. Mater., 2009, 21, 3659–3662 CrossRef CAS
.
- E. H. Kim, J. Y. Woo and B. K. Kim, Macromol. Rapid Commun., 2006, 27, 553–557 CrossRef CAS
.
- S. S. Shim, J. Y. Woo, H. M. Jeong and B. K. Kim, Soft Mater., 2009, 7, 93–104 CrossRef CAS
.
- B. K. Kim, M. W. Jang, H. C. Park, H. M. Jeong and E. Y. Kim, J. Polym. Sci., Part A: Polym. Chem., 2012, 50, 1418–1423 CrossRef CAS
.
- M. W. Jang and B. K. Kim, J. Mater. Chem., 2011, 21, 19226–19232 RSC
.
- S. K. Shriyan and A. K. Fontecchio, Opt. Express, 2010, 18, 24842–24852 CrossRef CAS PubMed
.
- K. Wang, J. Zheng, K. Gui, D. Li and S. Zhuang, Plasmonics, 2015, 10, 383–389 CrossRef CAS
.
- W. Kangni, Z. Jihong, C. Yiyang, W. Qingqing, G. Kun and Z. Songlin, IEEE Photonics Technol. Lett., 2015, 27, 1048–1051 CrossRef
.
- E. H. Kim, S. W. Myoung, W. R. Lee and Y. G. Jung, J. Korean Phys. Soc., 2009, 54, 1180–1186 CrossRef CAS
.
- S. Rawalekar, S. Verma, S. Kaniyankandy and H. N. Ghosh, Langmuir, 2009, 25, 3168–3172 CrossRef CAS PubMed
.
- D. Chen, F. Huang, G. Ren, D. Li, M. Zheng, Y. Wang and Z. Lin, Nanoscale, 2010, 2, 2062–2064 RSC
.
- C. Lü, Y. Cheng, Y. Liu, F. Liu and B. Yang, Adv. Mater., 2006, 18, 1188–1192 CrossRef
.
- G. Y. Zhang, J. B. Zhang and B. Yang, Polym. Chem., 2013, 4, 3963–3967 RSC
.
- A. S. Sarac, O. Yavuz and E. Sezer, Polymer, 2000, 41, 839–847 CrossRef CAS
.
- L. Yin, L. Fei, F. Cui, C. Tang and C. Yin, Biomaterials, 2007, 28, 1258–1266 CrossRef CAS PubMed
.
- R. L. Sutherland, L. V. Natarajan, V. P. Tondiglia and T. J. Bunning, Chem. Mater., 1993, 5, 1533–1538 CrossRef CAS
.
- M.-L. Ni, H.-Y. Peng, S.-G. Bi, X.-P. Zhou and X.-L. Xie, Acta Polym. Sin., 2014, 0, 1408–1412 CAS
.
- C. Schmidt and T. Scherzer, J. Polym. Sci., Part B: Polym. Phys., 2015, 53, 729–739 CrossRef CAS
.
- A. Altin, B. Akgun, Z. Sarayli Bilgici, S. Begum Turker and D. Avci, J. Polym. Sci., Part A: Polym. Chem., 2014, 52, 511–522 CrossRef CAS
.
- A. M. North and A. M. Scallan, Polymer, 1964, 5, 447–455 CrossRef CAS
.
- T. Junkers, M. Schneider-Baumann, S. S. P. Koo, P. Castignolles and C. Barner-Kowollik, Macromolecules, 2010, 43, 10427–10434 CrossRef CAS
.
- S. Beuermann, D. A. Paquet, J. H. McMinn and R. A. Hutchinson, Macromolecules, 1996, 29, 4206–4215 CrossRef CAS
.
- T. F. Scott, B. A. Kowalski, A. C. Sullivan, C. N. Bowman and R. R. McLeod, Science, 2009, 324, 913–917 CrossRef CAS PubMed
.
-
J. Brandrup, E. H. Immergut, E. A. Grulke, A. Abe and D. R. Bloch, Polymer handbook, John Wiley & Sons, Inc., New York, 4th edn, 1999 Search PubMed
.
- T. J. White, L. V. Natarajan, V. P. Tondiglia, P. F. Lloyd, T. J. Bunning and C. A. Guymon, Macromolecules, 2007, 40, 1121–1127 CrossRef CAS
.
- T. J. White, W. B. Liechty, L. V. Natarajan, V. P. Tondiglia, T. J. Bunning and C. A. Guymon, Polymer, 2006, 47, 2289–2298 CrossRef CAS
.
- K. K. Vardanyan, J. Qi, J. N. Eakin, M. De Sarkar and G. P. Crawford, Appl. Phys. Lett., 2002, 81, 4736–4738 CrossRef CAS
.
- H.-Y. Peng, C. Wang, W.-X. Xi, B. A. Kowalski, T. Gong, X.-L. Xie, W.-T. Wang, D. P. Nair, R. R. McLeod and C. N. Bowman, Chem. Mater., 2014, 26, 6819–6826 CrossRef CAS
.
- H.-Y. Peng, D. P. Nair, B. A. Kowalski, W.-X. Xi, T. Gong, C. Wang, M. Cole, N. B. Cramer, X.-L. Xie, R. R. McLeod and C. N. Bowman, Macromolecules, 2014, 47, 2306–2315 CrossRef CAS
.
- W. Huang, Y. Liu, Z. Diao, C. Yang, L. Yao, J. Ma and L. Xuan, Appl. Opt., 2012, 51, 4013–4020 CrossRef CAS PubMed
.
- J.-D. Cho, H.-T. Ju and J.-W. Hong, J. Polym. Sci., Part A: Polym. Chem., 2005, 43, 658–670 CrossRef CAS
.
- W. Tao, F. Fei, R. Rong and W. Yue-Chuan, Polym. Int., 2006, 55, 883–890 CrossRef CAS
.
- K. Choi, J. W. M. Chon, M. Gu, N. Malic and R. A. Evans, Adv. Funct. Mater., 2009, 19, 3560–3566 CrossRef CAS
.
- H. Lu, J. A. Carioscia, J. W. Stansbury and C. N. Bowman, Dent. Mater., 2005, 21, 1129–1136 CrossRef CAS PubMed
.
- N. Suzuki, Y. Tomita, K. Ohmori, M. Hidaka and K. Chikama, Opt. Express, 2006, 14, 12712–12719 CrossRef CAS PubMed
.
- N. Suzuki, Y. Tomita and T. Kojima, Appl. Phys. Lett., 2002, 81, 4121–4123 CrossRef CAS
.
- H. Fong, S. H. Dickens and G. M. Flaim, Dent. Mater., 2005, 21, 520–529 CrossRef CAS PubMed
.
- N. Soltani, A. Dehzangi, A. Kharazmi, E. Saion, W. Yunus, B. Y. Majlis, M. R. ZARE, E. Gharibshahi and N. Khalilzadeh, Chalcogenide Lett., 2014, 11, 79–90 Search PubMed
.
- M. A. Moharram, M. A. Soliman and H. M. El-Gendy, J. Appl. Polym. Sci., 1998, 68, 2049–2055 CrossRef CAS
.
Footnote |
| † Electronic supplementary information (ESI) available: Additional experimental data and discussion. See DOI: 10.1039/c6qm00003g |
| This journal is © the Partner Organisations 2017 |

