Chitosan-coated cerium oxide nanocubes accelerate cutaneous wound healing by curtailing persistent inflammation†
Xue
Huang‡
a,
Lin-Dong
Li‡
b,
Guang-Ming
Lyu
b,
Bai-Yu
Shen
a,
Yan-Fei
Han
a,
Jing-Lin
Shi
c,
Jia-Li
Teng
c,
Li
Feng
c,
Shao-Yan
Si
d,
Ji-Hua
Wu
e,
Yan-Jun
Liu
*ac,
Ling-Dong
Sun
*b and
Chun-Hua
Yan
 *b
*b
aDepartment of Endocrinology, 306 Hospital of PLA, Teaching Hospital of Peking University, Beijing 100101, China. E-mail: yanjunl@yeah.net; Fax: +86-10-64860685; Tel: +86-10-66356374
bBeijing National Laboratory for Molecular Sciences, State Key Laboratory of Rare Earth Materials Chemistry and Applications, PKU-HKU Joint Laboratory in Rare Earth Materials and Bioinorganic Chemistry, College of Chemistry and Molecular Engineering, Peking University, Beijing 100871, China. E-mail: sun@pku.edu.cn; yan@pku.edu.cn; Fax: +86-10-62754179; Tel: +86-10-62754179
cDepartment of Endocrinology, 306 Hospital of PLA, Beijing 100101, China
dDepartment of Special Medical Research, 306 Hospital of PLA, Beijing 100101, China
eDepartment of Pathology, 306 Hospital of PLA, Beijing 100101, China
First published on 11th December 2017
Abstract
Inflammation is the initial phase in the healing of cutaneous wounds; however, persistent inflammation will hamper the healing process by generating excess inflammatory cytokines and reactive oxygen species (ROS). Therefore, preventing persistent inflammation and clearing redundant ROS are important strategies in accelerating wound healing. Owing to their unique redox activity, cerium oxide (CeO2) nanoparticles have shown promising potential as antioxidative and anti-inflammatory agents for the treatment of various diseases resulting from oxidative stress. In the present study, we prepared chitosan-coated CeO2 nanocubes (CCNs) and evaluated their cutaneous wound healing potential when topically applied to open excision wounds on adult Sprague Dawley (SD) rats. CCN application significantly increased the wound healing rates and showed superior wound healing capabilities compared to a clinically applied wound healing agent, recombinant human epidermal growth factor (rhEGF). We attribute this superior wound healing ability to their anti-inflammatory ability by decreasing the expression of the inflammatory cytokine tumor necrosis factor-alpha (TNF-α) and increasing the expression of the anti-inflammatory cytokine interleukin-10 (IL-10), as well as to their antioxidative ability by increasing antioxidant enzyme levels. These results suggest that CCNs hold therapeutic potential in treating refractory wounds characterized by persistent inflammation caused by oxidative-stress related diseases such as diabetes.
1. Introduction
Wound healing is a complex dynamic process that results in the restoration of the normal anatomy and function of wounded tissue. Normally, the wound healing process comprises three temporally overlapping phases: inflammation, proliferation and remodelling.1 The inflammatory phase clears out damaged cells, pathogens and other debris through phagocytosis, making way for the proliferation phase; however, abnormally prolonged inflammation causes the release of excess cytotoxic enzymes, inflammatory mediators, free radicals and cytokines that cause extensive cell damage to the surrounding tissue. Overproduction of free radicals also induces oxidative stress, resulting in detrimental cytotoxic effects and delay in wound healing.2 Therefore, introduction of an anti-inflammatory and anti-oxidation agent to curtail persistent inflammation and reduce excess free radicals could be an important strategy to improve wound healing.Due to its abundant oxygen vacancies and reversible transformation between Ce(III) and Ce(IV),3 CeO2 has been extensively studied for its controlled synthesis4 and catalytic applications.5 In recent years, it was discovered that CeO2 nanoparticles can act as free radical scavengers to eliminate excessive reactive oxygen and nitrogen species (ROS and RNS), such as superoxide radicals, hydrogen peroxides, hydroxyl radicals and nitric oxide radicals,6 provoking increasing interest in their potential biomedical application. Initial biological studies have shown that CeO2 nanoparticles can prevent many oxidative stress-related diseases, including chronic inflammation,7 ischemic stroke8 and neurological diseases.9,10 Particularly, CeO2 nanoparticles have also been reported to accelerate the healing of cutaneous wounds by enhancing the proliferation and migration of major skin forming cells.11–13 However, to our knowledge, the effect of CeO2 nanoparticles on the molecular biology in the wound healing process has not yet been reported.
Chitosan, a linear polysaccharide derivative of chitin, is a biodegradable material with excellent biocompatibility. It has demonstrated wound healing properties by enhancing granulation and organization re-epithelialization in wounded tissue,14,15 as well as antimicrobial activities16 which can be enhanced with antimicrobial metal ions like Cu2+ and Ag+ to yield an excellent wound healing dressing.17 Compositing chitosan with other nanoparticles, most notably antimicrobial silver nanoparticles, is also a popular strategy of fabricating novel wound dressings with enhanced healing ability.18–20 Therefore, compositing chitosan with CeO2 nanoparticles could potentially combine their excellent anti-oxidation and wound healing capabilities and also enhance the biocompatibility of CeO2 nanoparticles, thereby obtaining a potent wound healing agent.
In this study, chitosan-coated cerium oxide nanocubes (CCNs) were prepared and their wound healing capability was evaluated by comparing with rhEGF, a clinically applied wound healing agent widely used in treating various wounds such as burn wounds, chronic diabetic ulcers and radiation-induced ulcers.21 Histopathological analysis, transmission electron microscopy and immunohistological analysis of healing tissue were employed to substantiate the acceleration of wound healing. The mechanism of CCNs’ healing ability was elucidated by RT-PCR and ELISA analysis of inflammatory/anti-inflammatory cytokines and antioxidant enzymes.
2. Experimental section
2.1 Chemicals
Ce(NO3)3·6H2O (99%, Sinopharm Chemical Reagent Co., Ltd, Beijing, China), CH3COOH (AR, Beijing Chemical Works, Beijing, China), and CH3COONa (AR, Xilong Chemical Co. Ltd, Guangdong, China) were used as received. Chitosan (degree of deacetylation: 90–95%) was purchased from Sangon Biotech Co., Ltd (Shanghai, China). Recombinant human epidermal growth factor (rhEGF) (20 μg mL−1) was obtained from Huashengyuan Genetic Engineering Development Co., Ltd (Shenzhen, China).2.2 Synthesis of CCNs
CeO2 nanocubes (NCs) were obtained from the hydrolysis of Ce(NO3)3 in an acetate–acetic acid buffer system by a hydrothermal method. Briefly, 10 g CH3COONa, 10 mL CH3COOH, and 2.17 g Ce(NO3)3·6H2O were dissolved and diluted to 85 mL with water. The solution was then transferred into a 100 mL Teflon-lined stainless steel autoclave and heated to 220 °C for 24 h. After cooling, the products were collected, washed with distilled water five times and redispersed in water for use.For the synthesis of CCNs, 400 mg of chitosan flakes were dissolved in 40 mL of 1% (v/v) acetic acid with vigorous stirring until the solution became clear. The CeO2 NC suspension was added to the as-prepared chitosan solution for a final concentration of 2 mg mL−1 and stirred at room temperature overnight to obtain a homogenous mixture. Subsequently, centrifugation was used for the separation of the CCNs from unbound chitosan.
2.3 Characterization of CCNs
The size and morphology of CeO2 NCs and CCNs were characterized using a JEOL JEM-2100 TEM (Japan) under a working voltage of 200 kV. The total cerium concentration in the prepared CeO2 NC suspension was quantified using inductively coupled plasma-atomic emission spectroscopy (ICP-AES) (Leeman, USA). The hydrodynamic diameter distribution of CeO2 NC samples was measured with a nanoparticle analyzer SZ-100 (HORIBA). Fourier transform infrared spectroscopy (FT-IR) measurements were performed using a Bruker Vector22 FT-IR spectrometer (Germany) to analyze the functional groups present in the CCNs.2.4 Animals
Sixty healthy adult male SD rats (180–210 g) were provided by Beijing Weitonglihua Experimental Animal Technical Co., Ltd. The animals were kept in a room with a daily dark to light ratio of 1![[thin space (1/6-em)]](https://www.rsc.org/images/entities/char_2009.gif) :
:![[thin space (1/6-em)]](https://www.rsc.org/images/entities/char_2009.gif) 1 at a temperature of 22 ± 2 °C. All rats were given free access to water and standard laboratory chow. All animal experiments were conducted in accordance with the regulations of the Institutional Animal Care and Use Committee of Peking University.
1 at a temperature of 22 ± 2 °C. All rats were given free access to water and standard laboratory chow. All animal experiments were conducted in accordance with the regulations of the Institutional Animal Care and Use Committee of Peking University.
2.5 Excision wound model
The animals were anesthetized by an intraperitoneal (i.p.) injection of pentobarbital sodium (30 mg kg−1). Two circular full thickness open excision wounds were created using an 8 mm biopsy punch under aseptic conditions on the back of each animal. The wounds were neither dressed nor covered. After recovery from anesthesia, the animals were individually kept in separate cages and were divided into the following three groups with 20 rats in each group: group I (control or normal saline-treated), group II (rhEGF-treated) and group III (CCN-treated). rhEGF solution (20 μg mL−1) or CCN solution (2 mg mL−1) was applied topically on the wound area of rats in the corresponding group once daily for 12 days.2.6 Wound healing rate measurements
Photographs of each wound were taken on days 0, 2, 5, 8 and 12 with a Canon EOS 5D Mark III digital camera. The wound area was calculated with ImageJ 1.48u software. The wound healing rates were expressed as percentage of the wound area measured on day 0 and were calculated by Wilson's formula as follows: wound healing rate = (wound area on day 0 − wound area on a particular day)/wound area on day 0 × 100%.2.7 Sample collection
After the measurement of the wound area, five animals from each group were euthanized on days 2, 5, 8 and 12 by cervical dislocation under anesthesia and the granulation/healing tissue was carefully collected. The tissue was immediately divided into four portions. The first portion was preserved in a RNA stabilization reagent (RNAlater, Qiagen, USA) at −20 °C for RNA extraction. The second portion was preserved in 10% neutral buffer formalin for the histopathological study. The third portion was snap frozen in liquid nitrogen and the tissue homogenate was prepared in ice-cold lysis buffer (100 mg tissue in 1 mL lysis buffer) (1% Triton ×100, 10 mM phenylmethylsulfonyl fluoride (PMSF), 1 mg mL−1 aprotinin and 1 mg mL−1 leupeptin in phosphate buffer saline (PBS) at pH 7.4) aided by using a motor homogenizer at 4 °C. The homogenates were then incubated at 4 °C for 30 min and centrifuged at 12![[thin space (1/6-em)]](https://www.rsc.org/images/entities/char_2009.gif) 000 rpm at 4 °C for 10 min. The aliquots of the supernatant were prepared and stored at −80 °C for the enzyme linked immunosorbent assay (ELISA). The last portion was fixed with 2.5% glutaraldehyde solution for the ultrastructure study.
000 rpm at 4 °C for 10 min. The aliquots of the supernatant were prepared and stored at −80 °C for the enzyme linked immunosorbent assay (ELISA). The last portion was fixed with 2.5% glutaraldehyde solution for the ultrastructure study.
2.8 RNA extraction and mRNA expression analysis by the quantitative real-time reverse transcription polymerase chain reaction (RT-PCR) analysis
The mRNA expressions of TNF-α and IL-10 in wound tissues were determined with the real-time RT-PCR. Total RNA was isolated from granulation/healing tissue for cDNA synthesis. An aliquot (1 μL) of cDNA was used as a template for the subsequent real time RT-PCR. The real time RT-PCR assay was performed with a 2× SYBR Premix Ex Taq™ II (TaKaRa, Japan) in a 96 well plate of a Bio-Rad C-1000 thermal cycler according to the manufacturer's instruction. The following thermal cycling profile was used (40 cycles): 95 °C for 30 s, 95 °C for 5 s, 60 °C for 30–34 s (depending on the primers used) and 95 °C for 15 s. The primers used are given in Table S1 in the ESI.† The ΔΔCT method of relative quantification was used to determine the fold change in expression by normalizing the resulting threshold cycle (CT) values of the target mRNAs to the CT values of the internal control glyceraldehyde 3-phosphate dehydrogenase (GAPDH) (ΔCT = CT,Target − CT,GAPDH) and then further normalizing ΔCT to the control (ΔΔCT = ΔCT,Treatment − ΔCT,Control). The fold change in expression was then calculated as 2−ΔΔCT.222.9 ELISA assay
The supernatants of lysates were quantitatively assayed for TNF-α (R&D System, Inc., MN, USA), IL-10 (R&D System, Inc., MN, USA), superoxide dismutase (SOD) (CUSABIO, Wuhan, China), catalase (CAT) (CUSABIO, Wuhan, China), and glutathione peroxidase (GPx) (CUSABIO, Wuhan, China) according to the manufacturer's instructions.2.10 Hematoxylin and eosin (H&E) staining
The granulation/healing tissue fixed in 10% neutral buffer formalin was embedded in paraffin and 5 μm thick tissue sections were obtained and stained with H&E. The stained sections were visualized under a light microscope (Olympus CX31, Tokyo, Japan) at 100× magnification.2.11 Transmission electron microscopy (TEM)
Specimens were fixed with 2.5% glutaraldehyde solution for at least 2 h and fixed with 1% osmium tetroxide for 1.5 h. The specimens were subsequently dehydrated in a graded series of alcohol, soaked with epoxy resin and pure acetone (1![[thin space (1/6-em)]](https://www.rsc.org/images/entities/char_2009.gif) :
:![[thin space (1/6-em)]](https://www.rsc.org/images/entities/char_2009.gif) 1) for 2 h, and embedded in 812 + 815 epoxy resin. 50–70 nm ultrathin sections were prepared with a Leica UC6 microtome (Leica, Deerfield, IL) and collected on copper grids. TEM images were taken on a JEOL JEM-1400 transmission electron microscope (Japan) under a working voltage of 120 kV.
1) for 2 h, and embedded in 812 + 815 epoxy resin. 50–70 nm ultrathin sections were prepared with a Leica UC6 microtome (Leica, Deerfield, IL) and collected on copper grids. TEM images were taken on a JEOL JEM-1400 transmission electron microscope (Japan) under a working voltage of 120 kV.
2.12 CD34 immunohistochemical analysis
Immunohistochemical analysis was performed using primary antibodies against CD34. In brief, 3 μm sections of properly fixed and embedded tissues were cut on silanized glass slides, deparaffinized in xylene, rehydrated in ethanol of graded concentrations (100%, 95%, 85%, and 75%), and submerged in PBS. The sections were submerged in boiling 0.01% sodium citrate solution for 5 min two times to remove antigens, and then blocked using normal goat serum for 15 min. They were subsequently incubated with the primary antibody of CD34 (1![[thin space (1/6-em)]](https://www.rsc.org/images/entities/char_2009.gif) :
:![[thin space (1/6-em)]](https://www.rsc.org/images/entities/char_2009.gif) 100, EP373Y, USA) overnight at 4 °C, and then further incubated with the biotin-labeled secondary antibody at 37 °C for 0.5 h. Negative controls were obtained by replacing the primary antibody with PBS. Diaminobenzidine (DAB) was used as the chromogen. All sections were counterstained with hematoxylin and then observed under a bright-field microscope.
100, EP373Y, USA) overnight at 4 °C, and then further incubated with the biotin-labeled secondary antibody at 37 °C for 0.5 h. Negative controls were obtained by replacing the primary antibody with PBS. Diaminobenzidine (DAB) was used as the chromogen. All sections were counterstained with hematoxylin and then observed under a bright-field microscope.
2.13 Statistical analysis
All data of the present study are expressed as mean ± standard error of mean (S.E.M.) of five animals. Data were analyzed by two-way analysis of variance (ANOVA) followed by Bonferroni's post-test using the GraphPad Prism Version 5.0 software program (GraphPad Software, San Diego, CA, USA). A value of p < 0.05 was considered statistically significant.3. Results and discussion
3.1 Synthesis and characterization of CCNs
A water-soluble CeO2 NC colloidal suspension was obtained using a facile acetate assisted hydrothermal method.23 A TEM image showed that the as-prepared nanoparticles are uniform in shape and the single particle size is about 25 nm (Fig. 1A). Chitosan-coated CeO2 NCs were prepared by simple homogenous mixing of chitosan hydrogel and CeO2 NC suspension. The functionalization of CeO2 NCs with chitosan was confirmed by the TEM image (Fig. 1B). An amorphous shell was found to adsorb on the surface of CeO2 NCs to form a chitosan layer with a thickness of 3.5 nm. The same samples measured by TEM were also studied by dynamic light scattering (DLS) to obtain their hydrodynamic diameters. After chitosan coating, the hydrodynamic diameter increased from 109 nm to 115 nm for CeO2 NCs (Fig. 1C). These values indicated that the chitosan adsorption is relatively uniform and almost did not affect the particle's agglomeration state.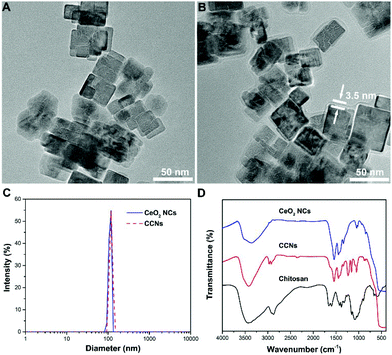 | ||
| Fig. 1 (A&B) TEM image of CeO2 NCs (A) and CCNs (B). (C) Hydrodynamic diameters of pristine and chitosan-coated CeO2 NCs. (D) FT-IR spectra of chitosan, CeO2 NCs and CCNs. | ||
Fig. 1D shows the FT-IR spectrum of chitosan-coated CeO2 NCs. An intense and broad band centered at 3400 cm−1 was attributed to O–H and N–H stretching. The successful modification of CeO2 NCs with chitosan was also confirmed by the appearance of C–O stretching at 1049 cm−1 and C–O–C stretching at 1159 cm−1. Compared with the signal of chitosan, a large red-shift of the carbonyl absorption band was observed, indicating the strong interactions between CeO2 NCs and chitosan. To confirm the biocompatibility of CCNs, we evaluated their toxicity towards INS-1 cells, a rat insulinoma cell line. The results indicate that CCNs not only do not impair cell viability, but also promote cell proliferation to a certain degree (Fig. S1, ESI†), proving that CCNs possess excellent biocompatibility, paving the way for their clinical applications.
3.2 Effect of topical application of CCNs on wound healing
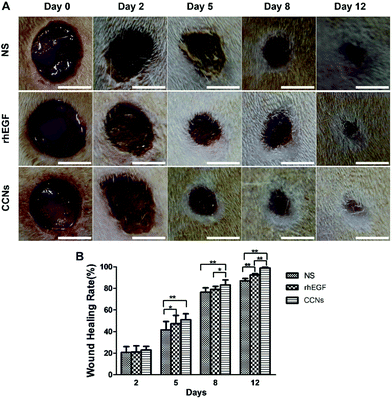
The representative photographs of wounds in normal saline (NS) treated, rhEGF-treated and CCN-treated groups are shown in Fig. 2A. The photographs reveal time-dependent reduction in the wound area in the three groups with the reduction being significantly more rapid in rhEGF and CCN-treated groups compared with the NS-treated group, which is evidently exhibited in the wound photographs on days 8 and 12. The wound healing was also more rapid in the CCN-treated group than in the rhEGF-treated group, as the wound was almost covered by the epithelial layer in the CCN-treated group on day 12, while full re-epithelialization was still not achieved for NS- and rhEGF-treated groups.As shown in Fig. 2B, CCN-treated wounds contracted significantly faster than the wounds of the control and rhEGF-treated groups. The wound healing rate of the CCN-treated group was significantly higher compared with the control group on day 5 and this significant difference continued till day 12 after wound creation. The wound healing rate of the CCN-treated group was significantly higher compared with the rhEGF group starting from day 8, demonstrating the superior wound-healing capability of CCNs compared to rhEGF. In order to demonstrate the enhancement in wound healing efficacy by combining pristine CeO2 NCs with chitosan, the healing rate of wounds treated with the as-prepared and chitosan-coated CeO2 NCs was compared (Fig. S2, ESI†), and the results showed that while the as-prepared CeO2 NCs significantly accelerated wound healing compared to the NS-treated group starting from day 5, the coating of chitosan further enhanced the effect of CeO2 NCs to a considerable degree.
3.3 Effect of topical application of CCNs on mRNA expression and protein levels of TNF-α and IL-10
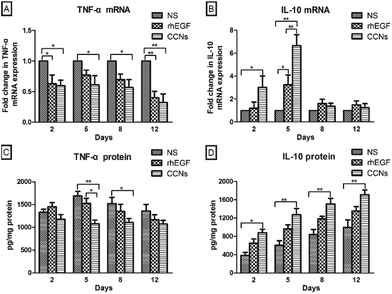
Among the three phases of the wound healing process, the inflammation phase generates reactive oxygen species, inflammatory cytokines, and tissue growth factors that clear out debris and subsequently induce the proliferative phase of the wound repair process;24,25 however, the prolonged inflammation phase can lead to tissue damage caused by excess free radicals and inflammatory cytokines. Therefore, the introduction of anti-inflammatory agents could significantly accelerate wound healing.To assess the anti-inflammatory effects of CCNs at the wound site in rats, we measured the level of TNF-α in the healing tissue on different days. Originally identified as a factor that leads to necrosis of transplantable tumors in mice (hence its name), TNF-α is now considered a pro-inflammatory cytokine involved in inflammatory and innate immune response.26 TNF-α levels in the NS-treated group increased from day 2 to day 5 (Fig. 3C), suggesting that inflammatory response is still persistent on day 5 if left untreated. By contrast, compared with the NS-treated group, the relative expression of TNF-α mRNA in the CCN-treated group significantly decreased from day 2 till day 12 (Fig. 3A). The TNF-α level in the CCN-treated group is also significantly lower on day 5 and 8 compared to the control group (Fig. 3C). These results suggest an evident decrease in the inflammatory response thanks to CCN treatment. TNF-α mRNA expression and protein levels in the rhEGF-treated group also exhibit a similar trend, albeit not as prominent as that observed in the control group.
To further substantiate the anti-inflammatory effects of CCNs, the level of IL-10 in the healing tissue was also assayed. Produced by both immune and nonimmune cells, IL-10 possesses potent anti-inflammatory activity by inhibiting the production of pro-inflammatory cytokines by activated macrophages as well as the infiltration of neutrophils and macrophages into wounded tissue.27 Consequently, IL-10 deficiency in wounded tissue might prolong the inflammatory phase and delay the formation of early granulation tissue.28 IL-10 mRNA expression in the CCN-treated group was significantly higher on days 2 and 5 compared to the control group and the rhEGF group (Fig. 3B). The IL-10 protein level in the CCN-treated group was also significantly higher than those in the control group and the rhEGF group throughout the observation period from day 2 to day 12 (Fig. 3D). The decrease in TNF-α and increase in IL-10 levels demonstrated the remarkable anti-inflammation ability of CCNs and its superiority over rhEGF, which contributes to an accelerated inflammation phase and subsequent wound healing.
3.4 Effect of topical application of CCNs on antioxidant enzyme levels
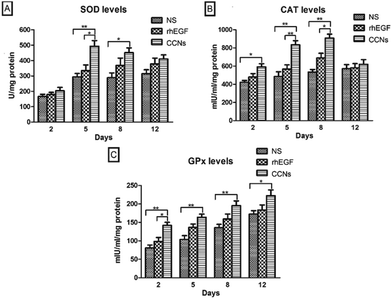
During early inflammation (inflammatory cell influx), free radicals and oxidants are excessively released into the wound area. Free radicals (ROS and RNS) released during persistent inflammation can cause severe oxidative damage to the healing wound.29 Endogenous antioxidants like SOD, CAT, and GPx in wound tissues accelerate the process of wound healing by preventing generation of free radicals,30 and the deficiency of these enzymes could be a significant factor in delayed wound healing.31 During the wound healing process, these antioxidant enzymes are gradually depleted, signifying increased oxidative stress, while complete wound contraction is usually accompanied by recovery of enzyme levels.32 Therefore, elevated SOD, CAT and GPx levels are important indicators of reduced oxidative stress, which subsequently facilitates rapid wound healing.In the healing tissues of our excision wound models, the SOD activity of the CCN-treated group was significantly higher on days 5 and 8 compared to the control group (Fig. 4A), while the CAT activity of the CCN-treated group was higher on days 2, 5 and 8 compared to the control group (Fig. 4B). In addition, the GPx activity of the CCN-treated group was significantly higher than the control group throughout the entire experiment (Fig. 4C). The CAT activity of the CCN-treated group was significantly increased on days 5 and 8 compared with the rhEGF-treated group. These results suggest CCN superiority in attenuating oxidative stress at the wound site, which is most probably due to the scavenging of excess free radicals by redox-active CCNs.
3.5 Histopathological and immunohistochemical findings
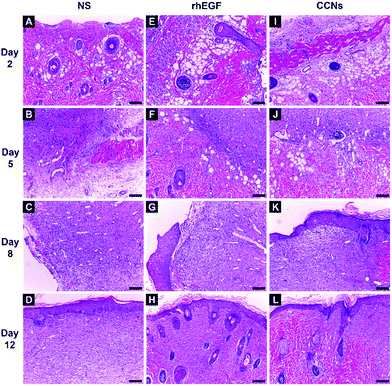
To further confirm the quality and maturity of the healing tissue on different days, we microscopically examined the histopathological wound sections. The H&E stained sections of healing wounds of control (Fig. 5A–D), rhEGF-treated (Fig. 5E–H) and CCN-treated groups (Fig. 5I–L) on days 2, 5, 8 and 12 post-wounding are presented in Fig. 5 (100× magnification).Normal skin structures possess a complete epithelial layer, relatively compact collagen fiber and inflammatory cells were hardly present (Fig. S3†). By contrast, the wound sections on day 2 showed the pervasive presence of inflammatory cells in all groups (Fig. 5A, E & I). There was no significant difference among the three groups.
On day 5, infiltration of inflammatory cells can still be observed in all three groups (Fig. 5). Some new capillaries can be observed in the rhEGF-treated wounds (Fig. 5F), while the CCN-treated wounds showed well-formed granulation tissue, numerous new blood vessels grown perpendicular to the wound section and fewer inflammatory cells as compared with the control group (Fig. 5J).
On day 8, the corneum layer of the epithelium exhibited an immature structure in the control group, showing almost no sign of re-epithelialization (Fig. 5C). Inflammatory cells are still present in the rhEGF-treated group's wound sections, but they also showed fibroblast and blood vessel growth as well as collagen synthesis; however, the wound was not fully re-epithelialized (Fig. 5G). In the wound sections of the CCN-treated group, fewer inflammatory cells, more new capillaries and more fibroblasts are present than in the control and rhEGF-treated groups, while a completely new epithelial layer was already formed (Fig. 5K).
On day 12, the wound section of the control group still showed many inflammatory cells with sparsely grown blood vessels (Fig. 5D). Fewer inflammatory cells are present in the rhEGF-treated group, but the collagen deposition lacked compactness (Fig. 5H). By contrast, the wound of the CCN-treated group was covered with new epithelium and with well-arranged and compact collagen tissue despite the sparse presence of inflammatory cells (Fig. 5L).
To illustrate the effect on tissue ultrastructure evolution caused by rhEGF and CCN application, TEM was used to observed the ultrastructure of the collagen fiber of the healing tissue on day 12. As shown in Fig. 6, the collagen fiber of the control group was sparse and arranged in disorder, while the CCN-treated group showed a well arranged and compact collagen deposition, similar to the compactly arranged collagen in normal skin tissue. The rhEGF-treated group performed in between, showing occasionally arranged but still relatively sparse collagen deposition.
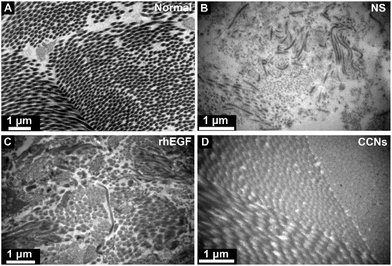 | ||
| Fig. 6 Transmission electron microscopy (TEM) micrographs of collagen fiber in normal skin tissue (A) and NS (B), rhEGF (C) and CCNs (D)-treated groups on day 12 post-wounding. | ||
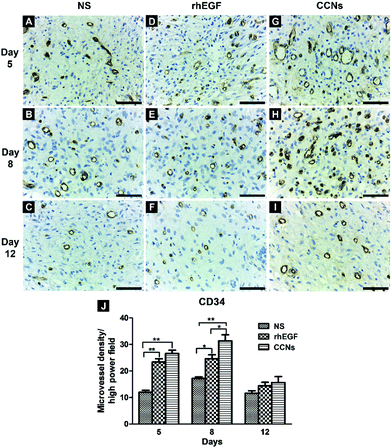
To further illustrate the effect of rhEGF and CCN application on angiogenesis in the healing wound, we performed CD34 immunohistochemical analysis of the healing tissue. CD34 labeled histological sections of the NS, rhEGF and CCN-treated groups showed many newly formed capillaries characterized by CD34 positive endothelial cells (brownish color) dispersed within the granulation tissue on days 5, 8 and 12 (Fig. 7A). However, the microvessel density of rhEGF and CCN-treated groups were significantly higher than the control group on days 5 and 8, while the microvessel density of the CCN-treated group was significantly higher than the rhEGF-treated group on day 8 (Fig. 7B), suggesting that CCNs could improve the blood supply of the wound. As wound healing progresses, granulation tissue gradually matures, with some capillaries collapsing and others reconstructed into arterioles and venules according to the need for normal skin function, causing the marked decrease in capillary density in all groups on day 12.
The proliferative phase of wound healing involves fibroplasia, angiogenesis and re-epithelialization. In our microscopic examination, the H&E stained sections showed much superior granulation tissue with more fibroblast formation in the wounds of the CCN-treated group compared to the other two groups on respective days. Collagen is an important component of granulation tissue and its TGF-β1-dependent synthesis by fibroblasts is indispensable for proper wound healing.33 Earlier studies have reported that TNF-α application caused decreased collagen synthesis, thus reduced the tensile strength of the wound.34 TNF-α inhibits TGF-β1-induced Smad-3 phosphorylation via Jun N-terminal kinase signaling and reduces the transcription of collagen, fibronectin and alpha-smooth muscle actin.35 Therefore, increased collagen deposition as evident from TEM micrographs in CCN-treated wounds in our study is probably due to the decreased levels of TNF-α and consequently increased fibroblast proliferation. Furthermore, both H&E stained sections and CD34 immunohistochemical analysis showed more newly formed capillaries and higher microvessel density in wounds treated with CCNs, which is consistent with previous research results that indicate CeO2 nanoparticles induce pro-angiogenesis, endothelial cell proliferation, and tube formation in in vitro cell culture and vascular sprouting in vivo.36 The H&E staining also evidently showed faster regeneration of the epithelial layer in the wounds of the CCN-treated group compared to the other groups (Fig. 5K). In summary, the combined effect of promoting fibroplasia, angiogenesis and re-epithelialization caused by CCN application accelerated the proliferative phase of wound healing, ultimately leading to faster wound contraction.
4. Conclusions
The findings of our study suggested that topical CCN application accelerated the cutaneous wound healing in SD rats by decreasing the persistence of the inflammatory state (via decreasing expression of TNF-α and increasing expression of IL-10) as well as increasing the levels of antioxidant enzymes (including SOD, CAT and GPx) at the wound site. The anti-inflammatory and antioxidant potential of CCNs caused faster and better wound healing in SD rats, marked by compact collagen deposition, improved angiogenesis and accelerated epithelial layer regeneration.Oxidative stress related diseases such as diabetes often cause refractory wounds and ulcers that cause significant deterioration of quality of life.37 In refractory diabetic ulcers, oxidative stress caused by hyperglycemia damages vascular endothelial cells and aggravates inflammation,38 while it also activates a variety of abnormal metabolic pathways that jointly impede wound healing.39 Therefore, we suggest that CCNs with excellent anti-inflammation and anti-oxidation properties may be potentially used for the treatment of these oxidative stress related refractory wounds.
Conflicts of interest
There are no conflicts to declare.Acknowledgements
This work was supported by NSFC (no. 21425101, 21321001, 21371011, and 21331001) and MOST of China (2014CB643800).References
- V. Kant, A. Gopal, D. Kumar, A. Gopalkrishnan, N. N. Pathak, N. P. Kurade, S. K. Tandan and D. Kumar, Acta Histochem., 2014, 116, 5–13 CrossRef CAS PubMed.
- J. Dissemond, M. Goos and N. S. Wagner, Hautarzt, 2002, 53, 718–723 CrossRef CAS PubMed.
- E. Aneggi, M. Boaro, C. d. Leitenburg, G. Dolcetti and A. Trovarelli, J. Alloys Compd., 2006, 408–412, 1096–1102 CrossRef CAS.
- C. Sun, H. Li and L. Chen, Energy Environ. Sci., 2012, 5, 8475–8505 CAS.
- T. Montini, M. Melchionna, M. Monai and P. Fornasiero, Chem. Rev., 2016, 116, 5987–6041 CrossRef CAS PubMed.
- H. Dong, S. R. Du, X. Y. Zheng, G. M. Lyu, L. D. Sun, L. D. Li, P. Z. Zhang, C. Zhang and C. H. Yan, Chem. Rev., 2015, 115, 10725–10815 CrossRef CAS PubMed.
- S. M. Hirst, A. S. Karakoti, R. D. Tyler, N. Sriranganathan, S. Seal and C. M. Reilly, Small, 2009, 5, 2848–2856 CrossRef CAS PubMed.
- C. K. Kim, T. Kim, I.-Y. Choi, M. Soh, D. Kim, Y.-J. Kim, H. Jang, H.-S. Yang, J. Y. Kim, H.-K. Park, S. P. Park, S. Park, T. Yu, B.-W. Yoon, S.-H. Lee and T. Hyeon, Angew. Chem., Int. Ed., 2012, 51, 11039–11043 CrossRef CAS PubMed.
- K. L. Heckman, W. DeCoteau, A. Estevez, K. J. Reed, W. Costanzo, D. Sanford, J. C. Leiter, J. Clauss, K. Knapp, C. Gomez, P. Mullen, E. Rathbun, K. Prime, J. Marini, J. Patchefsky, A. S. Patchefsky, R. K. Hailstone and J. S. Erlichman, ACS Nano, 2013, 7, 10582–10596 CrossRef CAS PubMed.
- A. Y. Estevez, S. Pritchard, K. Harper, J. W. Aston, A. Lynch, J. J. Lucky, J. S. Ludington, P. Chatani, W. P. Mosenthal, J. C. Leiter, S. Andreescu and J. S. Erlichman, Free Radical Biol. Med., 2011, 51, 1155–1163 CrossRef CAS PubMed.
- S. Sudipta and S. Das, US Pat., US20130195927A1, 2013 Search PubMed.
- S. Chigurupati, M. R. Mughal, E. Okun, S. Das, A. Kumar, M. McCaffery, S. Seal and M. P. Mattson, Biomaterials, 2013, 34, 2194–2201 CrossRef CAS PubMed.
- O. A. Legon'kova, T. A. Ushakova, I. P. Savchenkova, N. V. Perova, M. S. Belova, A. A. Torkova, A. E. Baranchikov, O. S. Ivanova, A. I. Korotaeva and V. K. Ivanov, Bull. Exp. Biol. Med., 2017, 162, 395–399 CrossRef PubMed.
- H. Ueno, T. Mori and T. Fujinaga, Adv. Drug Delivery Rev., 2001, 52, 105–115 CrossRef CAS PubMed.
- A. K. Azad, N. Sermsintham, S. Chandrkrachang and W. F. Stevens, J. Biomed. Mater. Res., Part B, 2004, 69, 216–222 CrossRef PubMed.
- A. J. Friedman, J. Phan, D. O. Schairer, J. Champer, M. Qin, A. Pirouz, K. Blecher-Paz, A. Oren, P. T. Liu, R. L. Modlin and J. Kim, J. Invest. Dermatol., 2013, 133, 1231–1239 CrossRef CAS PubMed.
- M. D. Leonida, S. Banjade, T. Vo, G. Anderle, G. J. Haas and N. Philips, Int. J. Nano Biomater., 2011, 3, 316–334 CrossRef CAS.
- S.-Y. Ong, J. Wu, S. M. Moochhala, M.-H. Tan and J. Lu, Biomaterials, 2008, 29, 4323–4332 CrossRef CAS PubMed.
- C. Li, R. Fu, C. Yu, Z. Li, H. Guan, D. Hu, D. Zhao and L. Lu, Int. J. Nanomed., 2013, 8, 4131–4145 Search PubMed.
- D. Liang, Z. Lu, H. Yang, J. Gao and R. Chen, ACS Appl. Mater. Interfaces, 2016, 8, 3958–3968 CAS.
- D. G. Pyun, H. J. Choi, H. S. Yoon, T. Thambi and D. S. Lee, Colloids Surf., B, 2015, 135, 699–706 CrossRef CAS PubMed.
- K. J. Livak and T. D. Schmittgen, Methods, 2001, 25, 402–408 CrossRef CAS PubMed.
- G.-M. Lyu, Y.-J. Wang, X. Huang, H.-Y. Zhang, L.-D. Sun, Y.-J. Liu and C.-H. Yan, Nanoscale, 2016, 8, 7923–7932 RSC.
- R. S. Pawar, F. A. Toppo, A. S. Mandloi and S. Shaikh, Indian J. Pharmacol., 2015, 47, 160–166 CrossRef CAS PubMed.
- M. S. Bitar and F. Al-Mulla, Dis. Models & Mech., 2012, 5, 375–388 CAS.
- G. Olmos and J. Lladó, Mediators Inflammation, 2014, 2014, 861231 Search PubMed.
- S. S. Iyer and G. Cheng, Crit. Rev. Immunol., 2012, 32, 23–63 CrossRef CAS PubMed.
- A. King, S. Balaji, L. D. Le, T. M. Crombleholme and S. G. Keswani, Adv. Wound Care, 2013, 3, 315–323 CrossRef PubMed.
- B. Ponugoti, F. Xu, C. Zhang, C. Tian, S. Pacios and D. T. Graves, J. Cell Biol., 2013, 203, 327–343 CrossRef CAS PubMed.
- U. Sakallıoğlu, E. Aliyev, Z. Eren, G. Akşimşek, İ. Keskiner and Ü. Yavuz, Arch. Oral Biol., 2005, 50, 1040–1046 CrossRef PubMed.
- A. M. Rasik and A. Shukla, Int. J. Exp. Pathol., 2000, 81, 257–263 CrossRef CAS PubMed.
- A. Shukla, A. M. Rasik and G. K. Patnaik, Free Radical Res., 1997, 26, 93–101 CrossRef CAS PubMed.
- A. C. Midgley, M. Rogers, M. B. Hallett, A. Clayton, T. Bowen, A. O. Phillips and R. Steadman, J. Biol. Chem., 2013, 288, 14824–14838 CrossRef CAS PubMed.
- F. Xu, C. Zhang and D. T. Graves, BioMed Res. Int., 2013, 2013, 754802 Search PubMed.
- M. T. Goldberg, Y.-P. Han, C. Yan, M. C. Shaw and W. L. Garner, J. Invest. Dermatol., 2007, 127, 2645–2655 CrossRef CAS PubMed.
- S. Das, S. Singh, J. M. Dowding, S. Oommen, A. Kumar, T. X. T. Sayle, S. Saraf, C. R. Patra, N. E. Vlahakis, D. C. Sayle, W. T. Self and S. Seal, Biomaterials, 2012, 33, 7746–7755 CrossRef CAS PubMed.
- W. J. Jeffcoate and K. G. Harding, Lancet, 2003, 361, 1545–1551 CrossRef.
- M. Brownlee, Diabetes, 2005, 54, 1615–1625 CrossRef CAS PubMed.
- D. Zephy and J. Ahmad, Diabetes Metab. Syndr., 2015, 9, 127–131 CrossRef PubMed.
Footnotes |
| † Electronic supplementary information (ESI) available. See DOI: 10.1039/c7qi00707h |
| ‡ These authors contributed equally to this work. |
| This journal is © the Partner Organisations 2018 |

