Low cost UVA-LED as a radiation source for the photo-Fenton process: a new approach for micropollutant removal from urban wastewater
I.
de la Obra
ab,
B.
Esteban García
ab,
J. L.
García Sánchez
ab,
J. L.
Casas López
 *ab and
J. A.
Sánchez Pérez
ab
aSolar Energy Research Centre CIESOL, Ctra de Sacramento s/n, ES04120, Almería, Spain. E-mail: jlcasas@ual.es
bChemical Engineering Department, University of Almería, Ctra de Sacramento s/n, ES04120, Almería, Spain
First published on 22nd November 2016
Abstract
Light Emitting Diode (LED) technology has matured sufficiently to be considered as an alternative UVA radiation source in photoreactors. Currently, low energy consuming LEDs with a wide range of wavelengths and radiant flux are readily available. In this study, UVA-LEDs were used as a radiation source for the photo-Fenton process as tertiary treatment. The water matrix used was a simulated secondary effluent doped with 200 μg L−1 of the pesticide acetamiprid (ACTM) due to its recalcitrant nature. All experiments were carried out in a LED-box reactor at pH 2.8. The main purpose of this research was to gain some insight into the relationships among energy supply, LED consumption, UVA irradiance and reaction rate. The effect of LED wavelength on energy efficiency for ACTM degradation was studied by varying the iron concentration and liquid depth. Three wavelengths (365, 385 and 400 nm) and two iron concentrations (5 and 11 mg L−1) for two different liquid depths (5 and 15 cm) were evaluated in order to obtain more energy efficient conditions. The results suggest that while the wavelength of 365 nm with 11 mg Fe2+ L−1 was the best condition for ACTM degradation, the wavelength of 385 nm had slower kinetics, but higher energy efficiency.
1. Introduction
The continuous discharge of wastewaters containing micropollutants at μg L−1 concentration levels into the environment can pose a potential risk due to their bioaccumulation, giving rise to cell toxicity with DNA mutations in living organisms, mainly in fish.1 For many decades, it has been known that the use of conventional alternatives, such as biological treatments, is not enough to eliminate these hazardous substances,2,3 hence advanced oxidation processes (AOPs) used as tertiary treatment, based on hydroxyl radical activity, have proved to be efficient in removing these persistent substances in urban and industrial wastewaters.Photo-Fenton, as a homogeneous photocatalytic process, can be used to efficiently treat these types of wastewater contaminated with pesticides.4 During the Fenton reaction, hydrogen peroxide rapidly reacts with iron, and generates hydroxyl radicals (HO˙), which are a non-selective and highly oxidative species.5 Iron is added at the beginning of the process and acts as a catalyst, being oxidized and reduced continuously. Furthermore, this process is accelerated with an optimal acidic pH (2.8) and in the presence of photons with wavelengths below around 550 nm, generating more HO˙.5
The photo-Fenton process is normally applied using solar radiation as a source of photons and the viability of this advanced oxidation technology not only depends on the radiation level and wavelength, but also on the distribution of light inside the reactor affecting the absorption of irradiance by the catalyst. Hence, the configuration of the photo-reactor has a direct influence on the removal rate of the pollutant.6
Macrocontaminant removal has been optimized with the solar photo-Fenton process in tubular compound parabolic collectors (CPCs) due to the high generation of HO˙ by using solar irradiance.7 However, this technology is not efficient when working with microcontaminants requiring a low concentration of HO˙, as the surface/volume ratio is low. The light path length of the photoreactor is very short and the optimum iron concentration conditions for maximising photon absorption is in the range of 2.3–0.3 mM.8 As such, under these conditions, high radical concentrations would be generated to remove pesticides in the μg L−1 and ng L−1 range and a large amount of them would be wasted.
On the other hand, other reactors have been designed to remove microcontaminants more effectively. It is known that raceway pond reactors (RPR) with a large treated volume/surface ratio can be used for this purpose8 and in this reactor, the light path length can be enlarged by increasing the liquid depth, a parameter which can be used as an operating variable. Recently, a study carried out by Rivas et al., reported the total degradation of acetamiprid (ACTM) and thiabendazole (TBZ) in a μg L−1 range with solar photo-Fenton in a raceway reactor for a time not exceeding 20 min and with different depths thus allowing a high treatment capacity.8
The solar photo-Fenton process has associated disadvantages related to light availability because of the influence of environmental conditions as well as daily and annual solar cycles. For this reason, artificial illumination is an alternative technique of replacing the radiation emitted by the sun and the most widely used in removing micropollutants is the UV light emitted by mercury lamps.9,10 This suffers from certain disadvantages such as the large size of lamps, high sensitivity to temperature and high electricity cost. Moreover, the lamps themselves are a harmful source of environmental pollution. Mercury and its degradation products, such as methyl mercury, are highly toxic to humans and ecosystems. High doses can be deadly to humans but even low accumulative doses can cause serious health problems. Mercury is considered a persistent pollutant worldwide and easily transported over long distances. It is also found in living things (such as fish), in air, soil, and water in different forms. For these reasons, new rules were proposed by the European Commission in the annex no. 847/2012 changing the previous legislation concerning the registration, evaluation, authorization and restriction of chemical substances and mixtures (REACH, annex VII no. 1907/2006 of the European Council and Parliament about uses of mercury and its danger to the environment). Recently, the use of other devices which can emit UV light has been significantly increased.11 Studies have been carried out using a UV light-emitting diode (UV-LED) to replace mercury lamps and it provides many advantages such as low power consumption, long lifespan (up to 26![[thin space (1/6-em)]](https://www.rsc.org/images/entities/char_2009.gif) 000 h), compactness, no warming-up time, feasibility and high sustainability.12,13
000 h), compactness, no warming-up time, feasibility and high sustainability.12,13
The aim of this work was to evaluate the relationships among energy supply, UVA irradiance, reaction rate and power consumption to obtain the best operating conditions for micropollutant removal by the photo-Fenton process, as a wastewater tertiary treatment, supported by UVA light using LED as a radiation source. For this purpose, the simulated secondary effluent of municipal wastewater contaminated with the pesticide ACTM as a model micropollutant at the μg L−1 level concentration was used. Accordingly, two sets of experiments with two liquid depths and irradiance levels were carried out. Each set comprised of six experiments with two iron concentrations using radiation at three different wavelengths.
2. Materials and methods
2.1. Chemicals
Commercial formulation of ACTM was used (EPIK® 20% w/w). HPLC grade acetonitrile from Prolabo Chemicals, formic acid (98%, Sigma-Aldrich) and Milli-Q grade water were used in the chromatographic analysis. Salts (MgSO4, (NH4)2SO4, KCl, CaSO4·2H2O) and organic compounds (beef extract, peptone, sodium lignin sulfonate, humic salts, acacia gum powder, sodium lauryl sulphate and arabic acid) employed to prepare synthetic water were supplied by Sigma-Aldrich. Sulphuric acid (97%), iron sulfate heptahydrate (FeSO4·7H2O >99%) and hydrogen peroxide (33%) were acquired from Panreac.2.2. Experimental procedure
All experiments were carried out in a LED box reactor at the lab scale equipped with 18 low cost UVA LEDs of three different wavelengths mounted separately in three channels. The LED box was equipped with a digital potentiometer (Mastech®M92A) and a digital multimeter to control the LED intensity and to measure the current and voltage during the experiments. The LED-box consisted of a rectangular parallelepiped (37 × 27 × 32 cm) built with polystyrene foam and covered inside with an aluminium mirror. The UVA wavelengths emitted by the LEDs were 365, 385 and 400 nm, operated at fixed electrical intensities of 600 mA, 260 mA and 240 mA, respectively. The irradiance spectra of the LEDs were obtained with an Avantes AvaSpec-ULS2048-2 spectroradiometer. The UVA irradiance was maintained constant during the experiments with a value measured on the liquid surface. Two PVC cylindrical reactors with 1 L (5 cm liquid depth) and 3 L (15 cm liquid depth) capacity reactors were used and placed under the UVA-LED at a distance of 18 cm and 8 cm from the reactor surface respectively, thus, the systems were completely illuminated. Changes in the liquid depth allow its relationship with the light path length to be evaluated during the treatment. All the runs were carried out with a controlled temperature of 25 °C and acidic pH (2.8) to avoid iron precipitation.5ACTM is a typical neonicotinoid insecticide used in citrus crops and is found in wastewater from the agro-food industry, which means it generates high toxicity.2,14 Moreover, ACTM has been reported to be more resistant to oxidation than other pollutants typically found in WWT agro-food effluents15 and can be found in urban wastewater at concentrations greater than 50 ng L−1.16 In this study, ACTM was used as a model micropollutant at a concentration of 200 μg L−1 to ensure accuracy in its monitoring using liquid chromatography.
The photo-Fenton experiments were carried out using simulated secondary effluent from a modified urban wastewater treatment plant (UWWTP).17 Its components were: CaSO4·2H2O (60 mg L−1), MgSO4 (60 mg L−1), KCl (4 mg L−1), (NH4)2SO4 (23.6 mg L−1), MgSO4·7H2O (2 mg L−1), beef extract (1.8 mg L−1), peptone (2.7 mg L−1), sodium lignin sulfonate (2.4 mg L−1), humic salts (4.2 mg L−1), acacia gum powder (4.7 mg L−1), sodium lauryl sulphate (0.9 mg L−1) and arabic acid (5.0 mg L−1), which yielded 10 mg DOC per L. The LED box reactor was equipped with temperature and pH probes. These variables were monitored on-line by means of a Labjack USB data acquisition device connected to a computer. Prior to beginning the experiments, the pH was adjusted to 2.8 ± 0.05 with sulphuric acid at 0.1 M and the pesticide concentration was added. This mix was homogenized by magnetic stirring for 5 min. After the addition of ACTM, hydrogen peroxide and iron salt were put in. At this point, the LED lights were switched on. Two concentrations of ferrous iron (5.5 and 11 mg Fe2+ L−1) as iron heptahydrate sulphate were used to carry out the photo-Fenton experiments, the initial concentration of hydrogen peroxide being 50 mg L−1 in all cases. Control experiments were performed by evaluating the possible interactions of ACTM with UVA-LED radiation, hydrogen peroxide and iron separately. UVA photolysis was carried out in the simulated wastewater where ACTM removal was low, achieving only 3% degradation in 60 min. Moreover, the other effects studied, such as UVA-H2O2 or UVA-Fe2+, also showed an insignificant degradation of the pollutant.
2.3. Radiation field and VRPA estimation
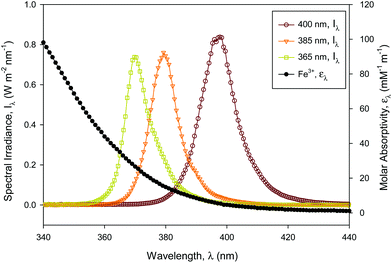
Concerning the absorption of the incident radiation, the ferric iron species in solution were dominant for UVA-LED absorption compared with hydrogen peroxide and ferrous iron which did not absorb any radiation over 300 nm.18 Furthermore, it was verified that the absorption of ACTM above 300 nm was insignificant for the concentration used in the experiments.8The absorption coefficient, KA (mM−1 m−1), of solution species was calculated using the UV absorption spectra of Fe3+ in simulated wastewater (Fig. 1) by eqn (1),
 | (1) |
Previous work has demonstrated the viability of using the volumetric rate of photon absorption (VRPA) as a parameter in the kinetic study of micropollutant removal by photo-Fenton.8,19 Consequently the VRPA was used as a parameter to jointly evaluate the influence of the irradiance, the iron concentration, the liquid depth and the radiation wavelength, calculated as follows.
Firstly, the local volumetric photon absorption, LVRPA (W m−3), at a specific depth was evaluated by eqn (2),
 | (2) |
The VRPA can then be calculated by the integration of the LVRPA over the reaction depth, D (m), multiplied by the reactor surface, SR (m2), for incoming photons and divided by the whole reactor volume, VR (m3). In this case the VRPA was expressed in W m−3, (eqn (3)),
 | (3) |
2.4. Electrical energy consumption (EEO)
Previous work about advanced oxidation processes based on the use of UV radiation has evaluated the energy efficiency using figures-of-merit. In this case the figures-of-merit are based on the electrical energy consumption by the system for a given reduction of the contaminant concentration. The electrical energy needed to reduce a dissolved contaminant by one order of magnitude in a given volume is called Electrical Energy per Order (EEO). EEO values (kW h m−3 order−1) can be estimated using eqn (4) in batch operation mode | (4) |
 | (5) |
2.5. Chemical analysis
The volume of each sample (10 mL) was taken by using a syringe at different times. All samples were immediately filtered by using nylon filters with a pore size of 0.2 μm-diameter (Millipore®). Each filter was washed with acetonitrile at a proportion of 1![[thin space (1/6-em)]](https://www.rsc.org/images/entities/char_2009.gif) :
:![[thin space (1/6-em)]](https://www.rsc.org/images/entities/char_2009.gif) 10 (acetonitrile
10 (acetonitrile![[thin space (1/6-em)]](https://www.rsc.org/images/entities/char_2009.gif) :
:![[thin space (1/6-em)]](https://www.rsc.org/images/entities/char_2009.gif) sample).21
sample).21
Hydrogen peroxide and iron concentrations were measured by standard colorimetric methods at 410 nm (method DIN 38 402 H15) and 510 nm (ISO 6332), respectively.
The ACTM concentration was analysed by liquid chromatography carried out in a HPLC (Agilent 1200 Series) equipped with a column oven, a degasser, an auto sampler, a diode array detector and a reversed-phase column (Agilent XDB-C18). The mobile phase consisted of a gradient mixture of acetonitrile and 1% (v/v) formic acid in water. The gradient used was initially set at 5% acetonitrile, progressively increasing the concentration to 100% in a 15 min method. The retention time for ACTM was 3.48 min, the detection wavelength was 248 nm and the quantification limit was 1 μg L−1.
3. Results and discussion
3.1. Effect of iron concentration and liquid depth on ACTM degradation
Twelve photo-Fenton experiments were carried out using ACTM as a model pesticide, where the liquid depth (5 and 15 cm), LED wavelength (365, 385 and 400 nm) and iron concentration (5.5 and 11 mg Fe2+ L−1) were the operating parameters. The incident radiation was provided by UVA-LED, the values being 10 ± 0.10 and 26.15 ± 0.15 W m−2 for the experiments carried out at 5 and 15 cm liquid depth, respectively.The first set of experiments was performed at 5 cm liquid depth. The degradation profiles of a 200 μg L−1 pollutant assayed with different Fe2+ concentrations (11 and 5.5 mg L−1) at acidic pH are shown in Fig. 2a. The initial concentration of H2O2 was the same in all cases (50 mg L−1). It was high enough not to limit the reaction rate and low enough to avoid promoting inefficient reactions.
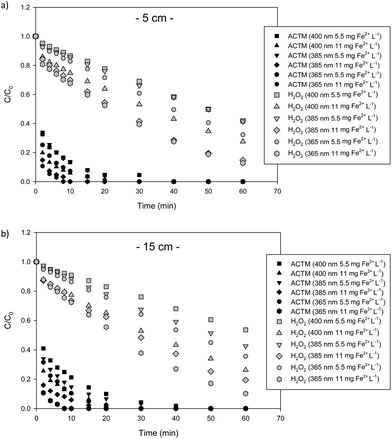 | ||
| Fig. 2 ACTM degradation and hydrogen peroxide consumption profiles with 5.5 and 11 mg Fe2+ L−1 at 5 cm (a) and 15 cm (b) liquid depth at the three wavelengths assayed. | ||
The pollutant degradation curves showed typical behaviour for the photo-Fenton process using ferrous iron as a catalyst.22 During the first two minutes of the process, the ACTM degradation was very fast23 due to the Fenton reaction (first step), without the influence of radiation (eqn (6)). After that, the ferric iron was reduced again to ferrous iron by UV-light, yielding more oxidative HO˙ (eqn (7)).
| Fe2+ + H2O2 → Fe3+ + HO− + HO˙ | (6) |
| Fe3+ + H2O + hν → Fe2+ + HO˙ + H+ | (7) |
This Fenton step can be observed in Fig. 2a, reaching 85% of the initial pollutant removal for the three wavelengths and 11 mg Fe2+ L−1, while with 5.5 mg Fe2+ L−1 more than 65% of the pollutant was removed. These results are similar to those reported by Rivas et al.8 with solar light using the same pollutant and liquid depth.
Under UVA-LED radiation, the ferric ions (Fe3+) produced in the presence of H2O2 (eqn (6)), are photo-reduced to ferrous ions (Fe2+) (eqn (7)), increasing the HO˙ generation rate, the latter being responsible for the oxidation of the ACTM. Regardless of the wavelength and radiation emitted by the UVA-LEDs, an increase in the catalyst concentration led to an increase in the process rate.8,19 With 5.5 mg Fe2+ L−1 ACTM, total degradation was achieved after 40, 30 and 20 min at 400, 385 and 365 nm, respectively, while with 11 mg Fe2+ L−1 total degradation was reached after 30, 10 and 8 min at the same wavelengths, respectively, concluding that degradation was slightly higher with 11 mg Fe2+ L−1 than with 5.5 mg Fe2+ L−1. Under all conditions assayed, the ACTM degradation rate followed a pseudo-first order trend, as reported in the literature for micropollutant degradation by this AOP.24 The consumption of 50 mg H2O2 L−1 during photo-Fenton experiments is shown in Fig. 2a. As expected, the hydrogen peroxide reaction rate increased with the iron concentration for all wavelengths, while its consumption at 400 nm was slightly lower than that for the rest of the wavelengths.
The second experimental set was carried out at 15 cm liquid depth under the same conditions chosen as the previous experimental set (Fig. 2b). The initial concentration of H2O2 was the same in all cases and the irradiance was set at 26 ± 0.15 W m−2. The H2O2 reaction rate was iron concentration and wavelength dependent, indeed with 11 mg Fe2+ L−1, the H2O2 consumption was higher for each wavelength, 365 nm being the fastest. The Fenton behaviour was similar to the experiments performed at 5 cm depth, achieving 80% ACTM degradation with 365 and 385, in both cases with 11 mg Fe2+ L−1. Fig. 2b shows that ACTM degradation is faster with 11 mg Fe2+ L−1 than with 5.5 mg Fe2+ L−1, obtaining the faster condition for 11 mg Fe2+ L−1 at 365 nm. This condition was the best at removing micropollutants for both liquid depths.
The results obtained in the two experimental sets are similar to those reported by other authors such as Rivas et al.8 This publication showed the degradation of micropollutants, in particular ACTM, at two depths (5 and 15 cm) with solar photo-Fenton in a raceway reactor. ACTM degradation at 15 cm and 5 cm depth with 10 mg Fe2+ L−1 was reached within 15 min while with 5.5 mg Fe2+ L−1, between 15 min and 20 min. Degradation occurs in the range of 20 min in both cases.
3.2. ACTM degradation and hydrogen peroxide consumption as a function of the VRPA
The consumption rate of H2O2 was considered dependent on iron concentration and light availability, which is in turn related to radiation on the reactor surface as well as the liquid depth. To evaluate the relationship between the photochemical process and energy consumption, the VRPA described in section 2 was used. Two sets of 6 experiments performed at 5 cm and 15 cm liquid depth were carried out. Each set comprised assays with two different iron concentrations (5.5 and 11 mg L−1) and three different wavelengths (365, 385 and 400 nm). The experimental plan included all the possible combinations of values given for the volumetric rate photon absorption (VRPA) between 14.97 W m−3 for the worst condition and 137.82 W m−3 for the best condition.A direct correlation between H2O2 and VRPA can be shown through an equation resulting from eqn (8) and (9) (eqn (10)).
| H2O2 + H2O + VRPA → HO− + 2HO˙ + H+ | (8) |
Therefore, a pseudo-first order rate was applied (eqn (9))
 | (9) |
| kH2O2 = f(Fe, VRPA). | (10) |
The pseudo-first order kinetic constant for the H2O2 reaction can be related to the VRPA that takes into account the influence of the iron concentrations and the UVA wavelength and irradiance. This relationship is based on the Langmuir–Hinshelwood equation (modified hyperbolic mathematical model) (eqn (11)).25
 | (11) |
 | (12) |
A good fit was obtained, demonstrating that the reaction rate can be increased commensurately with the VRPA. The results indicated a linear correlation between the reaction rate and VRPA, due to the lower values of the VRPA being smaller than the ks values. These were calculated from the linearization of eqn (11) for all the experiments with 5.5 mg Fe2+ L−1 and 11 mg Fe2+ L−1 separately (eqn (13) and (14)):
 | (13) |
 | (14) |
The values obtained for km, min−1, and ks, W m−3, were 0.0256 and 56.72 respectively in the case of the experiments carried out with 5.5 mg Fe2+ L−1, in contrast with 0.0489 and 43.98 respectively, for the experiments carried out with 11 mg Fe2+ L−1.
ACTM degradation displayed similar behaviour to the hydrogen peroxide consumption regarding the effects of the factors studied (iron concentration, irradiance, wavelength and liquid depth) but with faster kinetics as can be observed in eqn (15). Good linear fitting between kACTM and kH2O2 meant that it coincided with the previous reporting for solar experiments.8
| kACTM = 9.610 × kH2O2r2 = 0.94 | (15) |
3.3. Photo-Fenton UVA-LED energy evaluation
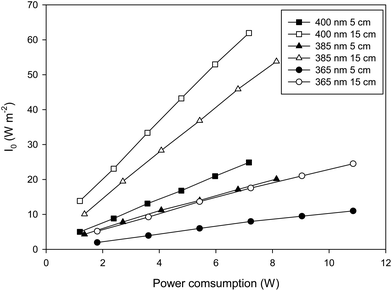
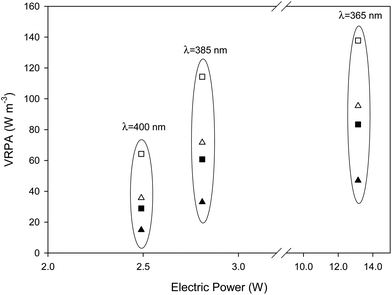
The use of LEDs involves electricity consumption and to this end, the efficiency of the LEDs becomes a critical design parameter. As can be seen in Fig. 3 there is a good linear relationship between the power consumed by the system and the irradiance measured on the liquid surface. The higher the wavelength of the radiation, the higher the slope of the curve involving a higher efficiency of the LED. This also affects the VRPA and a similar relationship can be obtained, in this case, the higher values of VRPA are attained for 385 nm wavelength LEDs, the lower ones for 365 nm. This in fact shows the influence of the efficiency of the different LEDs and the influence of the absorptivity at each wavelength. The higher values for the VRPA slope vs. energy consumption are achieved with the 385 nm wavelength and 15 cm liquid depth (3 L reactor volume).Fig. 4 shows the influence of the wavelength on the VRPA achieved for each condition assayed. A reduction in the wavelength of the radiation source used caused an increase in the VRPA, due to the higher absorption coefficient, as well as a significant increase in the energy consumption. Equilibrium was reached at 385 nm where VRPA remained high for low power consumption.
As can be observed in Fig. 4, a change from 400 nm to 385 nm brought about a significant increase in the VRPA with only a slight increase in power consumption. Nevertheless, the change from 385 nm to 365 nm, which increases the power consumption considerably, does not give rise to a significant increase in the VRPA. This can be explained by taking into account two factors, first the energy consumption by the LED to generate radiation in these wavelengths and second, the interaction between the Fe3+ absorption spectrum and the spectral power distribution of the UVA LED. Regarding energy consumption by the LED, the higher the wavelength, the higher the efficiency of the LED.
In terms of the influence of the iron concentration and the liquid depth on the VRPA for a given radiation wavelength, it was as expected, expressly, the higher the iron concentration and the liquid depth, the higher the obtained VRPA.
Another way to study the influence of the energy efficiency of the LEDs is the representation of the profiles for H2O2 as a function of accumulated energy consumption (Fig. 5). The figure shows the kinetics based on the energy consumed during two sets of experiments with three different wavelengths and two iron concentrations. Considerable differences appear under both conditions. As can be seen in the figure, the worst wavelength in terms of energy consumption is the 365 nm LED due to its low efficiency, compared with the other two wavelengths that give similar results, because the difference in the reaction rate is compensated by the difference in the electric efficiency.
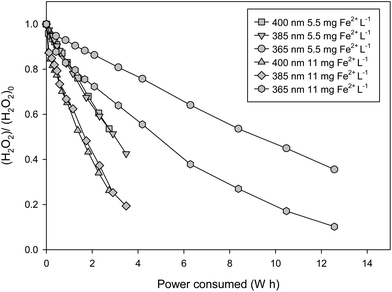 | ||
| Fig. 5 Hydrogen peroxide vs. power consumed (W h) for the set of experiments carried out with 15 cm of liquid depth (3L of reactor volume). | ||
The selection of wavelength and iron concentration will have a critical influence on the energy consumed. The combined effect of the kinetics influenced by the VRPA = f(Fe, Io, Ka), with the energy aspect of the system helping to find the best condition. The variation in the electrical energy per order (EEO, eqn (5)) for 90% ACTM removal under the different experimental conditions assayed is shown in Fig. 6. The best UVA wavelength in terms of the reaction rate becomes the worst condition in terms of energy efficiency. In conclusion, in terms of energy consumed, the use of 385 nm UVA LEDs proved to be the best choice because of their electrical efficiency and irradiance spectrum.
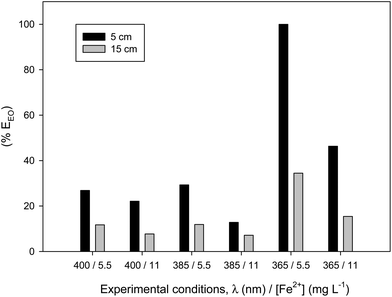 | ||
| Fig. 6 Electrical energy per order (EEO) in % regard of the maximum for the different conditions assayed: three wavelengths, two iron concentrations and two liquid depths. | ||
4. Conclusions
The present study shows that the UVA-LED driven photo-Fenton process can be applied as a feasible technology for micropollutant removal. The results prove UVA-LEDs to be an effective alternative radiation source with significant improvements for the scale-up of the photo-Fenton process to remove micropollutants. From a cost-effectiveness point of view it is critical to perform a thorough study of all the interrelations between the aforementioned factors as part of the objectives, in order to achieve the optimum operating conditions. The volumetric rate of photon absorption, VRPA, has been confirmed as a good photoreactor design parameter even under monochromatic radiation. In this regards, the reactor design strongly depends on energy efficiency, VRPA per Watt, and LED wavelength. For this purpose, it needs to be designed from an energy efficiency point of view using parameters such as Electrical Energy per Order (EEO).Acknowledgements
This research was supported by the Andalusian Regional Government (P12-RNM-1437); and the European Regional Development Fund (ERDF). I. de la Obra and B. Esteban García would like to acknowledge the Andalusian Regional Government for their grants.References
- S. Koeing, D. Huertas and P. Fernández, Sci. Total Environ., 2013, 443, 358–366 CrossRef PubMed.
- J. A. Sánchez, I. Carra, C. Sirtori, A. Agüera and B. Esteban, Water Res., 2014, 51, 55–63 CrossRef PubMed.
- A. Ginebrada, C. Postigo, R. López-Serna, S. Pérez, R. Brix, M. Llorca, M. L. D. Alda, M. Petrović, A. Munné, L. Tirapu and D. Barceló, Chemosphere, 2011, 82, 670–678 CrossRef PubMed.
- S. Malato, P. Fernández, M. I. Maldonado, J. Blanco and W. Gernjak, Catal. Today, 2009, 147, 1–59 CrossRef CAS.
- J. J. Pignatello, E. Oliveros and A. Mackay, Crit. Rev. Environ. Sci. Technol., 2006, 36, 1–84 CrossRef CAS.
- J. Colina-Márquez, F. Machuca-Martínez and G. L. Puma, Environ. Sci. Technol., 2010, 44, 5112–5120 CrossRef PubMed.
- S. Malato, P. Fernandez-Ibáñez, M. I. Maldonado, J. Blanco and W. Gernjak, Catal. Today, 2009, 147, 1–59 CrossRef CAS.
- G. Rivas, I. Carra, J. L. García Sánchez, J. L. Casas López, S. Malato and J. A. Sánchez Pérez, Appl. Catal., B, 2015, 178, 210–2174 CrossRef CAS.
- G. F. Ijpelaar, D. J. H. Harmsen, E. F. Beerendonk, R. C. van Leerdam, D. H. Metz, A. H. Knol, A. Fulmer and S. Krijnen, Ozone: Sci. Eng., 2010, 32, 329–337 CrossRef CAS.
- C. Köhler, S. Venditti, E. Igos, K. Klepiszewski, E. Benetto and A. Cornelissen, J. Hazard. Mater., 2012, 239–240, 70–77 CrossRef PubMed.
- A. C. Chevremont, A. M. Farnet, M. Sergent and B. Columb, Sci. Total Environ., 2012, 426, 304–310 CrossRef CAS PubMed.
- N. F. F. Moreira, J. M. Sousa, G. Macebo, A. T. Ribeiro, L. Barreiros, M. Pedrosa, J. L. Faria, F. R. Pereira, S. Castro-Silva, M. A. Segundo, C. M. Manaia, O. C. Nunes and A. M. T. Silva, Water Res., 2016, 94, 10–22 CrossRef CAS PubMed.
- M. H. Rasoulifard, M. Fazli and M. R. Eskandarian, J. Ind. Eng. Chem., 2015, 24, 121–126 CrossRef CAS.
- L. Li, X. Chen, D. Zhang and X. Pan, Pestic. Biochem. Physiol., 2010, 98, 300–304 CrossRef CAS.
- J. Gomis, A. Bianco, E. Montoneri, M. C. González, A. M. Amat, D. O. Martire, A. Arqués and L. Carlos, Chem. Eng. J., 2014, 235, 236–243 CrossRef CAS.
- A. Bernabeu, R. R. Vercher, L. Santos-Juanes, P. J. Simón, C. Lardín, M. A. Martínez, J. A. Vicente, R. González, C. Llosá, A. Arques and A. M. Amat, Catal. Today, 2011, 161, 235–240 CrossRef CAS.
- R. Zhang, S. Vigneswaran, H. Ngo and A. Nguyen, Desalination, 2007, 216, 325–333 CrossRef CAS.
- J. Farias, E. D. Albizzati and O. M. Alfano, Catal. Today, 2009, 144, 117–123 CrossRef CAS.
- I. Carra, J. A. Sanchez, S. Malato, O. Auting, B. Jefferson and P. Jarvis, Chem. Eng. J., 2015, 264, 690–696 CrossRef CAS.
- J. R. Bolton, K. G. Bricher, W. Tumas and C. A. Tolman, Pure Appl. Chem., 2001, 73, 627–637 CrossRef CAS.
- S. Mitroka, S. Zimmenck, D. Troya and J. M. Tanko, J. Am. Chem. Soc., 2010, 132, 2907–2913 CrossRef CAS PubMed.
- L. I. Doumic, P. M. Houre, M. C. Cassanello and M. A. Ayude, Appl. Catal., B, 2013, 142–143, 214–221 CrossRef CAS.
- R. Chen and J. J. Pignatello, Environ. Sci. Technol., 1997, 31, 2399–2406 CrossRef CAS.
- M. Neamtu, D. Grandjean, A. Sienkiewicz, S. Le Faucherur, V. Slaveykova, J. J. Velez, C. Pulgarin and L. F. Alencastro, Appl. Catal., B, 2014, 158–159, 30–37 CrossRef CAS.
- K. Vasanth, K. Porkodi and F. Rocha, Catal. Commun., 2008, 9, 82–84 CrossRef.
| This journal is © The Royal Society of Chemistry and Owner Societies 2017 |

