Comparison of benzene and toluene photodegradation under visible light irradiation by Ba-doped BiFeO3 magnetic nanoparticles with fast sonochemical synthesis†
Received
20th June 2016
, Accepted 19th December 2016
First published on 21st December 2016
Abstract
Bi1−xBaxFeO3 (x = 0.02, 0.04 and 0.07) multiferroic materials with a diameter in the range of 30–40 nm were controllably synthesized by a facile ultrasonic method, with a very short reaction time of 5 min at a low temperature of 30 °C, and the resulting BiFeO3 magnetic nanoparticles (BFO MNPs) exhibited enhanced magnetic and photocatalytic performance. The substitution of Ba2+ ions for Bi3+ ions at the A-site of BFO MNPs, even at only 2%, decreased their particle size and distorted the lattice in the rhombohedral structure of BFO MNPs. Increasing the Ba doping to 7% greatly increased the ferromagnetic properties of BFO MNPs from 3.55 to 6.09 emu g−1. In comparison with pure BFO MNPs, 7% Ba substitution in the Ba-doped BFO MNP samples produced strong absorption in the visible light region, decreasing the band-gap energy from 2.11 to 1.86 eV. Photoluminescence (PL) spectroscopy identified the band-gap emission for BFO MNPs at 587 nm, while for both pure and Ba-doped samples, the other emissions were attributed to the defect states related to oxygen deficiencies inside the band gap. After 50 min of visible light irradiation, Bi1−xBaxFeO3 (x = 7%), with the lowest band gap energy, highest magnetization and smallest particle size, showed almost complete photocatalytic degradation of toluene and benzene (100 mg L−1), with 91 and 81% reduction, respectively, in total organic carbon (TOC). For all irradiation times, the mineralization efficiency of toluene was higher than that of benzene, which demonstrated that toluene is more sensitive to photocatalytic oxidation than is benzene.
Introduction
Volatile organic compounds (VOCs) with a high vapor pressure, such as benzene, toluene, ethyl benzene, and xylene (BTEX), are important because of their toxicities and potential to seriously damage human health.1 In the past, benzene was among the organic chemicals most widely used as an organic solvent for adhesives and paints, but because of benzene's carcinogenic properties, it has now been replaced by toluene or xylene of relatively lower toxicity.2 Large quantities of toluene and xylene are also used as base chemicals to synthesize dyes, explosives, pigment inks and medicines.3 Removal of VOCs from water is often performed by air stripping and adsorption with activated carbon.4,5 Application of activated carbon has been identified as one of the most effective technologies compared with the impracticality of traditional methods, such as filtration, flocculation, and sedimentation.6,7 Nevertheless, activated carbon has disadvantages, such as the need for alternative recovery steps, and its high cost. Therefore, researchers have studied alternative new technologies for degrading BTEX, either into less harmful intermediates or completely mineralized products. Heterogeneous photocatalytic oxidation removal of VOCs is considered one of the most promising environmental technologies.8–10 It would thus be attractive to explore the possibilities of using an appropriate photocatalyst with narrowing band-gap energy and excellent chemical stability.
Bismuth ferrite (BiFeO3; BFO), with a rhombohedrally distorted perovskite structure, has attracted a great deal of attention, due to certain specific effects. It is a well-known multiferroic compound, because it shows ferroelectricity and weak ferromagnetism above room temperature. Many studies of the ferroelectric and ferromagnetic properties of the BFO nanostructure have been reported.11,12 Furthermore, due to its narrow band-gap energy (2.2 eV) and excellent chemical stability, it is an important new visible-light photocatalyst for the degradation of organic pollutants.13–16 Unfortunately, serious drawbacks, such as weak ferroelectricity, remanent polarization,17 high leakage current density,18 poor ferroelectric reliability,19 and inhomogeneous weak magnetization,20 have hindered electrical and multiferroic potential applications of BFO magnetic nanoparticles (MNPs). Due to the size effect and large surface-to-volume ratio, when the nanoparticle (NP) size is less than the periodicity of the spin helical ordering structure (62 nm), BFO MNPs can exhibit significant property differences, compared to its bulk counterparts.21 The size effect can interrupt the spin helical ordering structure of BFO MNPs, leading to a significant increase in the magnetization in BFO MNPs.22 In addition, much effort has been devoted to the substitution of rare-earth or alkaline earth elements at the A-site, B-site or A–B-site of BFO MNPs; for example, group-II atoms, transition-metal atoms, and rare-earth atoms.18,23–28 The substitution at the A-site of BFO MNPs causes an obvious effect on the lattice structure and an imbalance of the Bi 6s2 lone pair, leading after metal substitution into the lattice structure to a significant improvement in the multiferroic and photocatalytic properties of BFO MNPs. It has recently been reported that even at a low Li doping concentration on the Fe site, the BFO MNP lattice undergoes large structural distortion, and also enhancement in the magnetic moment per Fe atom.29 Due to charge neutrality, the substitution of aliovalent elements, such as Ca2+, Ba2+, Sr2+, and Ni2+ ions,30–32 for the Bi3+ or Fe 3+ site can easily affect the number of holes or electron carriers and oxygen vacancies in BFO MNPs, thereby affecting the leakage properties, because the substituted elements produce an impurity band between the valence and conduction bands that reduces the band gap. The 3% Na-doped BFO has been reported to have the smallest leakage of current density, while increasing the Na1+ content decreased the band gap.33
In our recent paper, we used Ba2+ ions as dopants to substitute for Bi3+ ions in BFO MNPs, and prepared Bi1−xBaxFeO3 (x = 0.05, 0.1, 0.2 mol%) MNPs with a sol–gel method for 30 min at room temperature and around 20 °C.34 Bi1−xBaxFeO3 MNPs exhibited a distorted MNP structure consisting of small, randomly oriented and non-uniform grains, leading to an increased surface area, improved magnetic and optic properties, and hence improved photocatalytic activities of benzene under visible light irradiation.34 In this study, we again prepared Bi1−xBaxFeO3 MNPs, but with different Ba2+ ion-dopant levels (x = 0.02, 0.04, 0.07), and via a slightly different procedure in which the MNPs were placed in a low intensity ultrasonic bath, and irradiated for a very short reaction time of 5 min at 30 °C. The liquid sonication created an extremely high localized temperature of up to 5000 K, a very high cooling rate of around 1010 K s−1, and a high pressure of about 20 MPa during acoustic cavitation.35 Such chemical sonication has been used to promote or accelerate chemical reactions, and to fabricate and modify nanosized inorganic materials with functionalities;36 these functionalities are generally not achievable via conventional sol–gel synthesis methods.37,38 The use of ultrasonic irradiation for Bi1−xBaxFeO3 synthesis afforded new information on the structural, magnetic, vibrational, optical and fluorescence properties of the samples that are completely different from those of our previous work.34 We also used photoluminescence (PL) spectroscopy, which is a very sensitive technique to characterize defect states inside the band gap in semiconductors.39 In this study, the photocatalytic activities of the sono-synthesized Bi1−xBaxFeO3 MNPs were newly evaluated by comparing the photodegradation characteristics of benzene and toluene under visible light irradiation.
2. Experimental
2.1. Chemicals and materials
Iron nitrate (Fe(NO3)3·9H2O), bismuth nitrate (Bi(NO3)3·5H2O), barium nitrate (Ba(NO3)2), and hydrogen peroxide (H2O2) were purchased from Fluka, and ethanol and ethylene glycol (EG) from Merck. All chemicals used in this study were of analytical grades, and were used without further purification. Benzene and toluene purchased from Aldrich (purity >98%) were used as received. Deionized water was used for sample preparation.
2.2. Preparation of Ba-doped BFO
To synthesize pure BFO MNPs, 32 mmol of Bi(NO3)3·5H2O and Fe(NO3)3·9H2O were dissolved in 72 ml EG. After that, the obtained suspension was placed in an ultrasonic bath, and irradiated for 5 min at 30 °C to obtain a dark red sol. For the preparation of Bi1−xBaxFeO3 (x = 0.02, 0.04, 0.07), Bi(NO3)3·5H2O, Fe(NO3)3·9H2O and Ba(NO3)2 were added to the EG in a molar ratio of 1 − x![[thin space (1/6-em)]](https://www.rsc.org/images/entities/char_2009.gif) :1:x, where x = 0.02, 0.04 and 0.07 for 2%, 4%, and 7% Ba-doped samples, respectively. They were then irradiated for 5 min at 30 °C to obtain brownish red sols. Next, the obtained gels were incubated at 70 °C for 30 h to remove the organic pollutants, and to form xerogels. Finally, the powders were calcined at 500 °C for 0.5 h at a heating rate of 6 °C min−1 to obtain BFO and Ba-doped BFO MNPs, respectively.
:1:x, where x = 0.02, 0.04 and 0.07 for 2%, 4%, and 7% Ba-doped samples, respectively. They were then irradiated for 5 min at 30 °C to obtain brownish red sols. Next, the obtained gels were incubated at 70 °C for 30 h to remove the organic pollutants, and to form xerogels. Finally, the powders were calcined at 500 °C for 0.5 h at a heating rate of 6 °C min−1 to obtain BFO and Ba-doped BFO MNPs, respectively.
2.3. Characterization and equipment
The prepared samples were structurally analyzed using X-ray diffraction (XRD; Bruker D8 Advance) with monochromatic Cu Kα radiation (λ = 1.5406 Å) in the 2θ range of 10–80° at room temperature. Fourier Transform Infrared (FTIR) transmittance spectra were recorded on a Perkin-Elmer Nicolet Nexus 470 FTIR spectrometer, using a KBr disk, to analyze the surface functional groups. Raman spectra, with a 785 nm laser line as an excitation source, were recorded on a LabRam HR micro-Raman spectrophotometer (Bruker, model: Senterra 2009, Germany) at room temperature. The samples were magnetically characterized by using vibrating sample magnetometry (VSM, Lake Shore 7300). Field-emission scanning electron microscopy (FE-SEM) was conducted using a Model Quanta 250 FEG (Field Emission Gun). Transmission electron microscopy (TEM) analysis was carried out using a high resolution (HR) TEM (HR-TEM, JEOL TEM Model 2100). The UV-Vis diffuse reflectance spectrum (UV-Vis DRS) of the powder was recorded on a Perkin-Elmer Lambda UV-Vis spectrophotometer over a range of 200–800 nm. The photoluminescence (PL) spectra at room temperature were recorded on an RF-5301PC (Shimadzu, Japan) spectrofluorophotometer using a Xe lamp, with an excitation wavelength at 350 nm. A Genesys 10S UV-Vis spectrophotometer was used to consider the absorbance of benzene and toluene at 195 and 205 nm, respectively. The total organic carbon (TOC, Shimadzu) content was measured using a TOC 500 A (Shimadzu, Japan). The sonication was carried out in an ultrasonic bath (Branson 5210, Branson Ultrasonic Cleaner, USA).
2.4. Activity test
As a typical photocatalysis experiment, an aqueous suspension (100 ml) containing 50 mg of Ba-doped BFO, 0.4 mM H2O2 and 100 mg L−1 of benzene or toluene was added to a 250 ml conical flask using a suitable cap. The reaction mixture was illuminated using a 55 W fluorescent lamp at a distance of 15 cm under continuous magnetic stirring. The temperature of the solution was fixed at 25 °C using a water bath. Before exposure to visible light irradiation, the solution was magnetically stirred in a dark place for 45 min, then placed in the presence of visible light for given time periods, and finally separated, using an external magnetic field. The removal efficiency of benzene or toluene was measured by UV–Vis spectrophotometry, based on the maximum benzene and toluene absorption in the wavelength range 190–212 nm. The conversion efficiency of benzene and toluene is defined as follows:| |  | (1) |
where C0 is the initial concentration of benzene or toluene, and C is the concentration of benzene and toluene after photocatalytic reaction at 195 and 205 nm, respectively. Throughout the experiment, a blank solution without the photocatalyst was used to evaluate benzene or toluene evaporation loss during photodegradation experiments. When a suitable cap was used, benzene and toluene evaporation loss during the photodegradation process was insignificant.
3. Results and discussion
3.1 Characterization of the catalyst
3.1.1. FTIR spectroscopy.
Fig. 1 shows the room temperature FT-IR spectra for BFO and 4% Ba-doped BFO MNPs. The absorption modes within the 1000 cm−1 range are normally defined according to the bonds between organic elements. The strong absorption peaks near 558 cm−1 and another near 447 cm−1 are related to the Fe–O stretching and bending vibration, respectively, which are characteristics of the octahedral FeO6 group in the perovskite compounds.40,41 These modes are consistent with the other reported data.21 In addition, the absorbance bands at 450 and 530 cm−1 in the inset of Fig. 1 are assigned to the vibration modes of Bi/Ba–O in the Bi/BaO6 octahedral unit.42–44 The broad nature of the observed vibration bands in the inset of Fig. 1 represents the occurrence of absorption peaks of both Fe–O and Bi/Ba–O bonds at nearly the same wavenumber for Ba-doped BFO as that of pure BFO. In the FT-IR spectra of Ba-doped BFO MNPs, the broad peak around 3418 cm−1 is assigned to the stretching vibrations of the O–H group, the absorption peak at 1631 cm−1 to chemisorbed water, and another absorption peak around 2331 cm−1 to CO2 modes that may arise due to some trapped CO2 in ambient air during the FTIR characterization.
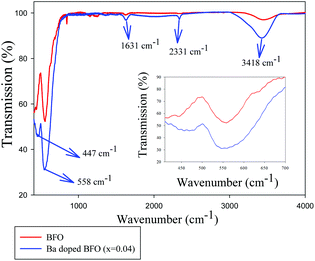 |
| | Fig. 1 FT-IR spectra of Bi1−xBaxFeO3 crystallites for x = 0 and 0.04. | |
3.1.2. XRD analysis.
Fig. 2 illustrates the XRD patterns of Bi1−xBaxFeO3 with x = 0, 0.02, 0.04, and 0.07. As expected, all the XRD patterns show the typical peaks of the rhombohedral structure of pure BFO (JCPDS card number 71-2494), as reported previously,45 indicating the presence of highly crystalline BFO MNPs. However, the observation of secondary phases at small intensities indicates the existence of a Bi25FeO40 phase (JCPDS card number 46-0416) upon doping of Ba2+. Rietveld refinement was applied on the XRD patterns of Bi1−xBaxFeO3 with x = 0, 0.02, 0.04, and 0.07. Table 1 shows the calculated phase amount (wt%) of the BFO and Ba-doped BFO MNPs. As shown in the XRD pattern, increasing the Ba content shifted the peak around 2θ = 22° (012) for Bi1−xBaxFeO3 to a lower angle, likely due to the larger ionic radius of Ba2+ (1.36 Å) than that of Bi3+ (1.17 Å). The effect of Ba2+ ion substitution on the structure of BFO MNPs can be clearly seen in the magnified XRD patterns in the range of 2θ = 31.0–32.5° (Fig. 2 inset), in which after Ba2+ ion substitution, the diffraction peaks of (104) and (110) merge to a single (110) peak. The merge of two peaks reveals that the structural phase transition in Bi1−xBaxFeO3 (x = 0.02, 0.04 and 0.07) occurs from rhombohedral R3c to cubic Pm3m.46 The same behavior has been reported in a Mn-doped BFO film,47 which corresponds to a lattice distortion or phase change from the rhombohedral to the monoclinic or tetragonal structure.48,49 The expansion of the diffraction peaks with increasing Ba2+-ion substitution is due to the smaller size effect of the Ba ion radius than that of the Bi ion radius.50 This substantial reduction of particle size in Ba-doped BFO MNPs may be a result of the restricted crystal growth of nanoparticles due to substitution of divalent Ba2+ for trivalent Bi3+ ions and breaking of the spiral spin structure of the Ba-doped BFO MNPs.51
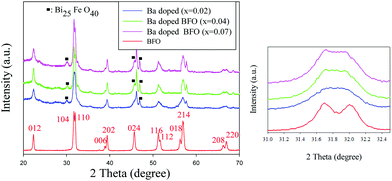 |
| | Fig. 2 XRD patterns for Bi1−xBax FeO3 MNPs; the inset shows the patterns of the main peak near 32° in BFO and Ba-doped BFO MNP samples. | |
Table 1 Calculated phase amount (wt%) of the Bi1−xBaxFeO3 (x = 0.02, 0.04 and 0.07) samples
| Samples |
Phase composition (wt%) |
| BFO MNPs |
Bi25Fe4O40 |
|
x = 0 |
Pure |
— |
|
x = 0.02 |
91.32 |
8.68 |
|
x = 0.04 |
88.77 |
11.23 |
|
x = 0.07 |
87.68 |
12.32 |
3.1.3. UV-Vis DRS analysis.
The UV-Vis absorption spectra of the Bi1−xBaxFeO3 MNPs were recorded at room temperature (Fig. 3). The UV–vis absorption spectra of BFO and Ba-doped BFO MNPs show broad absorbance peaks in the visible region, which are assigned to the intrinsic electronic transitions from the 6A1 state to the 4T1 (4G) state, and from 6A1 to 4E and 4A1 (4G) ligand field transitions.52Fig. 3 shows a red shift to a long wavelength for the Ba-doped BFO MNP samples. The band gap energy for the direct band gap materials was calculated by using classical Tauc's relation,29 as given by ahν = A(hν − Eg)n, where A is a constant, hν the photon energy, Eg the band gap energy, and n is the absorption coefficient. The insets of Fig. 3 show the plots of (ahν)2versus hν for Bi1−xBaxFeO3 MNPs, and the calculated band gap value by the linear extrapolation approach. The decrease in the band gap energy of Ba-doped BFO materials with increasing Ba2+ ion substitution can be explained as the result of two processes. First, increasing the Ba concentration increases the angle of Fe–O–Fe. The increase in the Fe–O–Fe angle towards 180° causes an increase in the band width of the occupied and unoccupied levels by directly changing the electronic structure of the central cation and the interfacial electronic properties, which can reduce the band gap of the Ba-doped BFO MNPs.53 Second, with the increasing Ba concentration in BFO MNPs, impurities such as oxygen vacancies and holes reduce the energy levels between the valence band and the conduction band. Meanwhile, these impurity defects play a key role in the electrical transport properties.
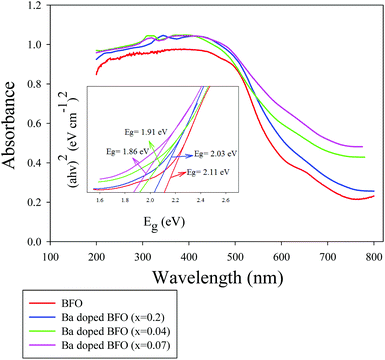 |
| | Fig. 3 UV–vis DRS spectra of Bi1−xBaxFeO3 crystallites for x = 0, 0.02, 0.04, and 0.07; the inset shows the calculation of the band gap of MNPs. | |
3.1.4. Photoluminescence (PL) analysis.
The PL properties of Ba-doped BFO were characterized, in order to characterize the defects in semiconductors. Fig. 4 clearly shows that BFO and Ba-doped BFO MNPs (x = 0.02 and 0.07) exhibited strong and wide PL signals in the range from 480 to 630 nm, and several strong peaks were identified at 504, 514, 539, 584 and 614 nm. The strongest emission peak at 584 nm, corresponding to an energy of 2.11 eV, and other luminescence patterns are attributed to oxygen defects. This behavior represents the existence of several transitions below the conduction band, likely associated with the presence of defects inside the band gap that are probably due to oxygen vacancies. In principle, except for the inherent emission from the band-to-band transition, the other emissions are due to the defects and impurity levels inside the bandgap.54 The emission of oxygen vacancies has been presented in many reports with different features. For example, the defect feature at 2.55 eV in the cathodoluminescence spectra of BFO thin films was attributed to oxygen vacancy emission,55 which was consistent with our results. Fig. 4 shows the increase in Ba doping, indicating an increase in PL intensity and increasing oxygen vacancy concentration.56 In general, the smaller the particle size, the larger the surface oxygen vacancy content. Thus, the higher the possibility of exciton occurrence, the stronger the PL signal that is observed.55 As the Ba doping was increased from 0.02 to 0.07, a red shift of about 4 and 8 nm was identified, due to the existence of structural defects such as oxygen vacancies and grain boundaries, which can significantly influence the band gap value.57 Thus, the PL data strongly suggest that PL intensities can be used as a measure of oxygen vacancy. The appearance of oxygen vacancies by Ba doping induced a donor level near the conduction band of Ba-doped BFO MNPs, thereby improving the degradation efficiency of benzene and toluene in the visible region.
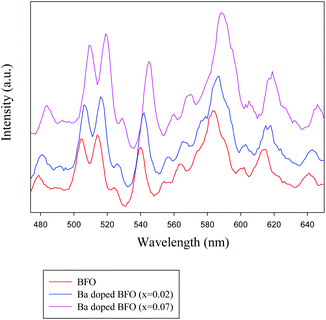 |
| | Fig. 4 PL spectra of Bi1−xBaxFeO3 crystallites for x = 0, 0.02, and 0.07. | |
3.1.5. Raman spectroscopy.
BFO belongs to the R3c space group and the C3v point group. The irreducible representation from group theory is displayed as follows: 4A1 (z, x2 + y2, z2) + 5A2 (−) + 9E (x, y, x2 − y2, xy, xz, yz).58 The phonon modes A1 and E are transverse optical (TO) vibrational modes that are Raman and IR active, whereas the A2 modes are inactive in both Raman and IR. Fig. 5 shows the room temperature Raman scattering spectra of the BFO and Ba doped BFO MNPs. Since the Raman spectra are penetrable to atomic substitution, some changes in the Raman modes with Ba substantiation can afford valuable information about ionic substitution, lattice distortion, and electronic polarization. To determine the effect of Ba doping on the BFO structure, the observed Raman modes of Ba-doped BFO were compared with those of BFO MNPs. From the first investigation, the Raman spectra of all the BFO and Ba-doped BFO MNPs clearly show none of the 13 modes (4A1 + 9E). With Ba substitution, the first two A1 modes at 136 and 168 cm−1 for pure BFO merge together. With the increasing Ba concentration, the E (TO1) mode at 97 cm−1, which is governed by the Bi–O covalent bond, shifts toward a higher wavenumber. With increasing Ba substitution, a new strong peak around 313 cm−1 seems to be created because of the shifting of the mode centered at 270 cm−1 to a higher frequency, and its intensities increase. Two reasons can be given to explain this phenomenon. First, after Ba substitution, the replacement of the heavier atom of Bi by the lighter atom of Ba changes the interactions between the component atoms, which changes the phonon frequencies. Second, after Ba replacement, the structural phase transformation from the rhombohedral symmetry to a coexisting tetragonal, cubic, and orthorhombic symmetry leads to a change in Bi–O covalent bonds that control the E-1, A1-1, A1-2, A1-3, and E-2 modes,59 as already confirmed by the XRD results discussed in section 3.1.2 above.
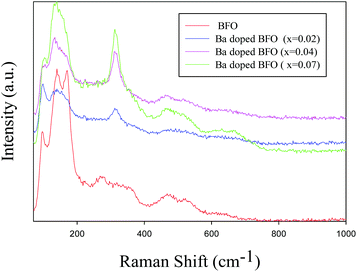 |
| | Fig. 5 Raman spectra of Bi1−xBaxFeO3 MNPs for x = 0, 0.02, 0.04, and 0.07 at room temperature. | |
3.1.6. Magnetic properties.
Fig. 6 shows the room temperature magnetization (M−H) loop of pure and Ba-doped BFO MNPs. BFO MNPs exhibited ferromagnetic ordering at room temperature, which may be attributed to the partial destruction of the spiral spin structure in BFO MNPs, which weakens the ferromagnetism.60,61 The substitution of Ba2+ ions for Bi3+ ions in the BFO MNPs distorted the lattice's rhombohedral structure, which enhanced the net magnetization with the increasing Ba content from 3.55 emu g−1 for pure BFO to a maximum value of 6.09 emu g−1 for 7% Ba substitution. It has been reported that doping of Ba2+ and Mn2+ into pure BFO in Bi0.9Ba0.1Fe0.9Mn0.1O3 increased magnetic saturation to 1.35 emu g−1, compared to 0.277 emu g−1 for pure BFO MNPs.62 However, we obtained much higher net magnetization for BFO and Ba-doped BFO MNPs (3.55 and 6.09 emu g−1), compared with the reported results (0.277 and 1.35 emu g−1, respectively). The improved ferromagneticity with the increasing Ba content in BFO MNPs can be attributed to two reasons. First, the ferroelectric properties are directly proportional to the degree of distortion in the rhombohedral structure of BFO MNPs. Due to spin orientation, the distorted rhombohedral perovskite structure of BFO MNPs showed weak ferromagnetic ordering.63 The Ba2+ substitution causes distortion in the rhombohedral structure of BFO MNPs, which effectively suppresses the spiral spin structure obtained as a consequence of the decreased structure of BFO MNPs, which effectively suppresses the spiral spin structure obtained as a consequence of the decreased grain size, thereby releasing the latent magnetization. Second, the weakness of the balance between the antiparallel sub-lattice magnetization of Fe3+ by the metal ion substitution with different valences may enhance the magnetic properties in the Ba-doped samples.38–40 The substitution of Ba2+ ions for Bi3+ ions in the BFO lattice requires charge compensation, which can be achieved by the formation of Fe4+ or oxygen vacancies. The statistical distribution of Fe3+ and Fe4+ ions in the octahedra may also lead to the net magnetization and ferromagnetism in Ba-doped BFO MNPs.64
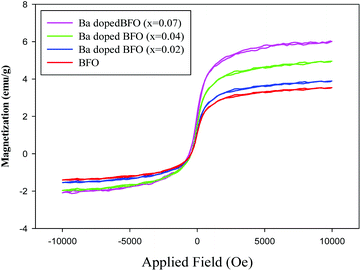 |
| | Fig. 6 Magnetic hysteresis loops of Bi1−xBaxFeO3 MNPs for x = 0, 0.02, 0.04, and 0.07 at room temperature. | |
3.1.7. SEM and TEM analyses.
Fig. 7(a)–(c) show the SEM images of the pure BFO, and 2% and 7% Ba-doped BFO, respectively. The readily observed uniform NPs for the pure BFO and uniform NPs with irregular shapes for the doped samples prove the successful doping of Ba in BFO MNPs. In addition, some particles formed agglomerates due to the electrostatic potential and magnetic attraction between the grains, caused by abnormal/discontinuous grain growth, known as exaggerated grain growth.65,66
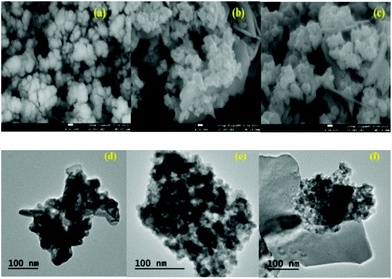 |
| | Fig. 7 SEM and TEM images of Bi1−xBaxFeO3 NPs, (a, d): x = 0.0, (b, e), x = 0.02, and (c, f): x = 0.07. | |
Fig. 7(d)–(f) show the representative TEM images of pure and Ba-doped BFO. The NPs had an average particle size of 30–40 nm, and some of them were irregular and agglomerated. When the Ba doping was increased to 7%, the NPs became slightly smaller. This reduction of particle size in Ba-doped BFO MNPs has previously been reported,45 and may result from the limited crystal growth of NPs due to the substitution of divalent Ba2+ for trivalent Bi3+ ions, and the breaking of the spiral spin structure of the Ba-doped BFO MNPs.51 Furthermore, Fig. S1† shows that EDS analysis confirms the presence of the expected amounts of Bi, Fe and O in BFO MNPs, and the successful Ba doping in the prepared Ba-doped BFO MNPs.
3.1.8. XPS analysis.
Further evidence for the quality and composition of the pure BFO and Ba doped BFO MNPs was obtained from XPS studies, as shown in ESI Fig. S2.†
3.2. Decomposition of benzene and toluene
3.2.1. Effect of the type of heterogeneous catalyst.
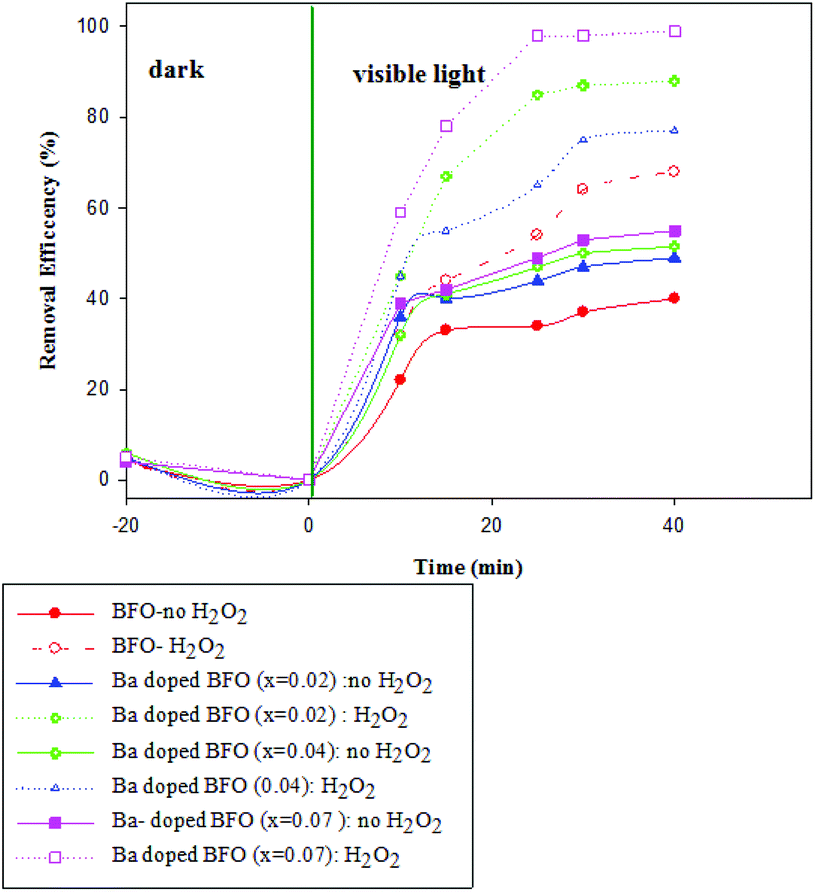
Fig. 8 and 9 show the photocatalytic performance of impure BFO and Ba-doped BFO MNPs on the photodegradation of benzene and toluene in the presence and absence of H2O2, respectively. The removal efficiencies of the two VOC pollutants were much higher in the presence of H2O2 than in its absence. This enhanced removal efficacy can be attributed to the combination of photo-Fenton reactions and photocatalytic reactions occurring on the photocatalyst surface. It is assumed that under visible light irradiation, Fe3+ species on the surface of the catalysts can transfer to Fe2+ species. Then, Fe2+ species produce ˙OH by the decomposition of H2O2.44,45 Thus, more ˙OH was produced from the two mechanisms for ˙OH generation, which can be utilized to attack benzene and toluene. Furthermore, Ba-doped BFO MNPs exhibited more photocatalytic activity than did pure BFO MNPs. Thus, increasing the Ba concentration in Ba-doped BFO MNPs increased the photodegradation efficiency of toluene and benzene in the presence and absence of H2O2. The removal efficiency of BFO MNPs was about 34 and 41% in the absence and 49 and 68% in the presence of H2O2 for benzene and toluene, respectively. Ba doping in BFO MNPs improved the degradation efficiency. In the absence of H2O2, Bi1−xBaxFeO3 (x = 0.02) exhibited photodegradation efficiencies of about 38 and 48% for benzene and toluene, respectively, compared to 72 and 77% in the presence of H2O2, respectively. A further increase in the Ba content up to 7% substantially increased the photodegradation efficiency in the presence and absence of H2O2 for both benzene and toluene. However, the removal efficiency of benzene was less than that of toluene, and almost complete degradation was achieved for toluene in the presence of H2O2. The increased doping of Ba2+ in pure BFO MNPs up to 7% significantly reduced the particle size and the band-gap energy of the samples, which greatly increased their photocatalytic activities.
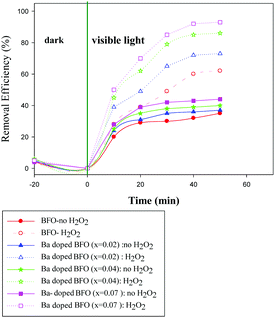 |
| | Fig. 8 Effect of the type of Bi1−xBaxFeO3 NP with x = 0, 0.02, 0.04, and 0.07 on the photodegradation of benzene in the presence and absence of H2O2. [(t = 25 °C, C0 (benzene) = 100 mg L−1, C (H2O2) = (0.4 mM), m (photocatalyst) = 0.05 g)]. | |
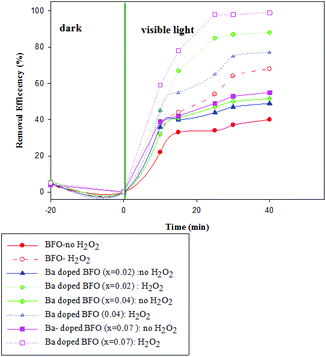 |
| | Fig. 9 Effect of the type of Bi1−xBaxFeO3 NP with x = 0, 0.02, 0.04, and 0.07 on the photodegradation of toluene in the presence and absence of H2O2. [(t = 25 °C, C0 (benzene) = 100 mg L−1, C (H2O2) = (0.4 mM), m (photocatalyst) = 0.05 g)]. | |
Generally, the photocatalytic activity of photocatalysts is strongly related to parameters such as the band-gap energy, specific surface area, crystallite size, and phase structure.53 The recombination of photo-excited electrons and holes is one of the most deleterious parameters negatively impacting the photocatalytic activity. Ba substitution may lead to the generation of oxygen vacancies or defects for the charge compensation requirement.67 This excellent performance can be explained by the increment of free carriers and decrement of the electron–hole recombination rate. During the photocatalytic reaction process, the recombination of photo-induced electrons and holes can be effectively inhibited, because oxygen vacancies and defects can become centers for capturing photo-induced electrons. However, when the Ba content exceeds the optimal value, the oxygen vacancies and defects will become recombination centers.68 In addition, Ba doping might induce BFO into many states, and the photo-induced electrons can easily transfer onto the surface of Ba-doped BFO MNPs to react with Ba ions or adsorbed pollutant compounds, rather than recombining with each other. Such efficient migration of electrons to the surface of Ba-doped BFO MNPs enhances the charge separation process, and prevents the recombination of electron–hole pairs.
3.2.2. Mineralization efficiency.
Fig. 10 shows the variation of TOC concentration during the photocatalytic degradation of benzene and toluene after different visible irradiation times that was measured. Increasing the irradiation time up to 50 min significantly accelerated the mineralization of toluene and benzene, with 80 and 91% TOC removal being attained in the benzene and toluene solutions, respectively. These results demonstrated that Ba-doped BFO MNPs can greatly increase the mineralization of toluene and benzene in aqueous solution. However, the mineralization efficiency of toluene was greater than that of benzene at all irradiation times, indicating that toluene is more sensitive to photocatalytic oxidation than is benzene.69 The reactivity of toluene with chlorine radicals has been reported to be 13-fold more than that of benzene. However, the reactivity between toluene and benzene toward the ˙OH radical did not differ greatly.70 The lower reactivity of benzene toward the ˙OH radical can be explained via the following two routes that have been proposed for benzene degradation. First, direct hole oxidation, followed by reaction of the resulting radical cation, either with a surface basic OH group or with an adsorbed water molecule, and subsequent deprotonation to yield phenol, the major intermediate detected (Scheme 1). Second, ˙OH addition, to yield a cyclohexadienyl radical.70–72
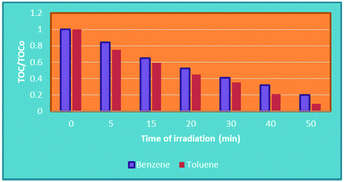 |
| | Fig. 10 Variation in TOC according to the duration of irradiation with Bi1−xBaxFeO3 (x = 0.07). [(t = 25 °C, C0 (benzene and toluene) = 100 mg L−1, C (H2O2) = (0.4 mM), m (photocatalyst) = 0.05 g)]. | |
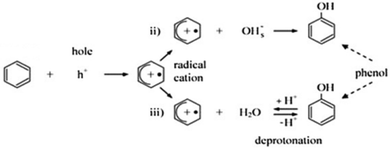 |
| | Scheme 1 Benzene degradation by direct hole oxidation.73 | |
3.3. Kinetics of photocatalytic degradation
Fig. 11 shows that different initial concentrations of benzene and toluene were applied to investigate the photocatalytic kinetics of Bi1−xBaxFeO3 (x = 0.07) synthesized with the ultrasonic method. To quantitatively calculate the reaction rate constant of photocatalytic degradation, the Langmuir–Hinshelwood model expressed by using eqn (2) was applied in the benzene and toluene degradation studies:| | 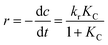 | (2) |
where r (mg L−1 min−1), kr (mg L−1 min−1), K (L mg−1), c (mg L−1), and t (min) are the reaction rate, reaction rate constant, adsorption coefficient of the reactant, reactant concentration, and time of illumination, respectively. When c is a very small value, the product KC is negligible with respect to unity, so that eqn (2) can be converted into the following eqn (3):| | 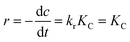 | (3) |
where k (min−1) is the first-order rate constant.
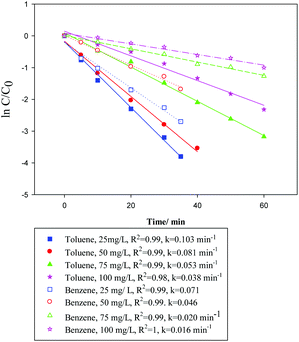 |
| | Fig. 11 Photocatalytic kinetics of Bi1−xBaxFeO3 (x = 0.07) with different initial concentrations of benzene or toluene. (The solid line and dotted line are toluene and benzene, respectively.) | |
With the setting t = 0, C = C0, eqn (3) can be changed to eqn (4):
| |  | (4) |
where
C is the concentration of benzene or toluene at the irradiation time
t, and
C0 is the initial concentration when the adsorption–desorption equilibrium between the photocatalyst and benzene or toluene was established in the dark. The photocatalytic degradation was apparent first-order kinetics based on the Langmuir–Hinshelwood model, and the rate constants were determined by assuming pseudo-first-order reaction kinetics.
74 The plots of ln
C/
C0versus irradiation time (
t) exhibited a straight line, and the value of
k can be obtained directly
via its slope. It is clear that the initial concentration of benzene or toluene has a considerable effect on the degradation rates, particularly at their lower concentrations, providing the higher rate constants of photodegradation for benzene or toluene.
4. Conclusions
Ba-doped BFO MNPs were synthesized using a facile sonochemical route at Ba concentrations of 2, 4 and 7%, and at a low temperature of 30 °C for a short reaction time of 5 min. The UV–Vis absorption spectra of the synthesized BFO MNPs showed a significant red shift and a decrease in the band gap energy from 2.11 eV for pure BFO to 1.86 eV for 7% Ba doping. Based on XRD analysis, Raman spectroscopy and VSM characterization, lattice distortion was identified in the rhombohedral structure of BFO MNPs, even at Ba doping of only 2%. The room temperature PL spectra revealed the presence of a broad peak at a maximum of 584 nm, which is a sign of band-gap emission, and multiple defect-state emissions that can be attributed to oxygen deficiencies inside the band gap. As the Ba doping was increased from 2 to 7%, the saturation magnetization of the synthesized BFO MNPs greatly increased from 3.55 to 6.09 emu g−1. With the increasing Ba doping, the ferromagneticity and oxygen vacancy of BFO MNPs increased and their band-gap energy decreased, which greatly increased the benzene and toluene photocatalytic degradation. After 50 min of visible light irradiation, Bi1−xBaxFeO3 (x = 0.07) with the lowest band-gap energy, smallest particle size, and highest ferromagnetic properties almost completely degraded the aqueous toluene and benzene, with high TOC reductions of 91 and 81%, respectively. Toluene was more sensitive to photocatalytic oxidation than was benzene; and at all tested irradiation times, the mineralization efficiency of toluene was higher than that of benzene.
Acknowledgements
This work is supported by the Korea Ministry of Environment (MOE) as “The Chemical Accident Prevention Technology Development Project”.
References
- H. Z. Streicher, P. A. Gabow, A. H. Moss, D. Kono and W. D. Kaehny, Ann. Intern. Med., 1981, 94, 758–762 CrossRef CAS PubMed.
- L. Tang, Y. Li, K. Xu, X. Hou and Y. Lv, Sens. Actuators, B, 2008, 132, 243–249 CrossRef CAS.
- M. Takeuchi, M. Hidaka and M. Anpo, J. Hazard. Mater., 2012, 237–238, 133–139 CrossRef CAS PubMed.
- S. V. Satyanarayana, A. Sharma and P. K. Bhattacharya, Chem. Eng. J., 2004, 102, 171–184 CrossRef CAS.
- F. Lipnizki, R. W. Field and P.-K. Ten, J. Membr. Sci., 1999, 153, 183–210 CrossRef CAS.
- A. Buschini, P. Carboni, S. Frigerio, M. Furlini, L. Marabini, S. Monarca, P. Poli, S. Radice and C. Rossi, Mutagenesis, 2004, 19, 341–347 CrossRef CAS PubMed.
- J.-H. Yun, K.-Y. Hwang and D.-K. Choi, J. Chem. Eng. Data, 1998, 43, 843–845 CrossRef CAS.
- K. Everaert and J. Baeyens, J. Hazard. Mater., 2004, 109, 113–139 CrossRef CAS PubMed.
- M. A. Alvarez-Merino, M. F. Ribeiro, J. M. Silva, F. Carrasco-Marín and F. J. Maldonado-Hódar, Environ. Sci. Technol., 2004, 38, 4664–4670 CrossRef CAS PubMed.
- P. Papaefthimiou, T. Ioannides and X. E. Verykios, Appl. Catal., B, 1997, 13, 175–184 CrossRef CAS.
- S. Karimi, I. M. Reaney, I. Levin and I. Sterianou, Appl. Phys. Lett., 2009, 94, 112903 CrossRef.
- T.-J. Park, G. C. Papaefthymiou, A. J. Viescas, A. R. Moodenbaugh and S. S. Wong, Nano Lett., 2007, 7, 766–772 CrossRef CAS PubMed.
- T. Soltani and M. H. Entezari, Chem. Eng. J., 2013, 223, 145–154 CrossRef CAS.
- T. Soltani and M. H. Entezari, Chem. Eng. J., 2014, 251, 207–216 CrossRef CAS.
- T. Soltani and M. H. Entezari, Ultrason. Sonochem., 2013, 20, 1245–1253 CrossRef CAS PubMed.
- T. Soltani and M. H. Entezari, J. Mol. Catal. A: Chem., 2013, 377, 197–203 CrossRef CAS.
- J. Wang, J. B. Neaton, H. Zheng, V. Nagarajan, S. B. Ogale, B. Liu, D. Viehland, V. Vaithyanathan, D. G. Schlom, U. V. Waghmare, N. A. Spaldin, K. M. Rabe, M. Wuttig and R. Ramesh, Science, 2003, 299, 1719–1722 CrossRef CAS PubMed.
- X. Qi, J. Dho, R. Tomov, M. G. Blamire and J. L. MacManus-Driscoll, Appl. Phys. Lett., 2005, 86, 062903 CrossRef.
- S. Y. Yang, F. Zavaliche, L. Mohaddes-Ardabili, V. Vaithyanathan, D. G. Schlom, Y. J. Lee, Y. H. Chu, M. P. Cruz, Q. Zhan, T. Zhao and R. Ramesh, Appl. Phys. Lett., 2005, 87, 102903 CrossRef.
- S. Hemant and K. L. Yadav, J. Phys.: Condens. Matter, 2011, 23, 385901 CrossRef PubMed.
- D. Lebeugle, D. Colson, A. Forget, M. Viret, A. M. Bataille and A. Gukasov, Phys. Rev. Lett., 2008, 100, 227602 CrossRef CAS PubMed.
- T.-J. Park, G. C. Papaefthymiou, A. J. Viescas, A. R. Moodenbaugh and S. S. Wong, Nano Lett., 2007, 7, 766–772 CrossRef CAS PubMed.
- H. Uchida, R. Ueno, H. Funakubo and S. Koda, J. Appl. Phys., 2006, 100, 014106 CrossRef.
- B. Kyle, I. Takashi and T. Hitoshi, Jpn. J. Appl. Phys., 2007, 46, L93 CrossRef.
- P. Kharel, S. Talebi, B. Ramachandran, A. Dixit, V. M. Naik, M. B. Sahana, C. Sudakar, R. Naik, M. S. R. Rao and G. Lawes, J. Phys.: Condens. Matter, 2009, 21, 036001 CrossRef CAS PubMed.
- A. Kazutomo, S. Noriyoshi, T. Junichi, I. Hidenobu, A. Nobuyasu and O. Toshitaka, Jpn. J. Appl. Phys., 2010, 49, 09MB01 Search PubMed.
- Z. Zhang, H. Liu, Y. Lin, Y. Wei, C.-W. Nan and X. Deng, J. Nanomater., 2012, 2012, 5 Search PubMed.
- Y.-N. Feng, H.-C. Wang, Y.-D. Luo, Y. Shen and Y.-H. Lin, J. Appl. Phys., 2013, 113, 146101 CrossRef.
- M. M. Shirolkar, C. Hao, X. Dong, T. Guo, L. Zhang, M. Li and H. Wang, Nanoscale, 2014, 6, 4735–4744 RSC.
- C. H. Yang, J. Seidel, S. Y. Kim, P. B. Rossen, P. Yu, M. Gajek, Y. H. Chu, L. W. Martin, M. B. Holcomb, Q. He, P. Maksymovych, N. Balke, S. V. Kalinin, A. P. Baddorf, S. R. Basu, M. L. Scullin and R. Ramesh, Nat. Mater., 2009, 8, 485–493 CrossRef CAS PubMed.
- V. A. Khomchenko, D. A. Kiselev, J. M. Vieira, A. L. Kholkin, M. A. Sá and Y. G. Pogorelov, Appl. Phys. Lett., 2007, 90, 242901 CrossRef.
- F. Kubel and H. Schmid, Acta Crystallogr., Sect. B: Struct. Sci., 1990, 46, 698–702 CrossRef.
- H. Zhang, W. Liu, P. Wu, X. Hai, M. Guo, X. Xi, J. Gao, X. Wang, F. Guo, X. Xu, C. Wang, G. Liu, W. Chu and S. Wang, Nanoscale, 2014, 6, 10831–10838 RSC.
- T. Soltani and B.-K. Lee, J. Hazard. Mater., 2016, 316, 122–133 CrossRef CAS PubMed.
- N. A. Dhas and K. S. Suslick, J. Am. Chem. Soc., 2005, 127, 2368–2369 CrossRef CAS PubMed.
- L. Zhou, W. Wang, S. Liu, L. Zhang, H. Xu and W. Zhu, J. Mol. Catal. A: Chem., 2006, 252, 120–124 CrossRef CAS.
- V. Safarifard and A. Morsali, Ultrason. Sonochem., 2012, 19, 823–829 CrossRef CAS PubMed.
- H. Xu, B. W. Zeiger and K. S. Suslick, Chem. Soc. Rev., 2013, 42, 2555–2567 RSC.
- S. Godefroo, M. Hayne, M. Jivanescu, A. Stesmans, M. Zacharias, O. I. Lebedev, G. Van Tendeloo and V. V. Moshchalkov, Nat. Nanotechnol., 2008, 3, 174–178 CrossRef CAS PubMed.
- R. K. Mishra, K. P. Dillip, R. N. P. Choudhary and A. Banerjee, J. Phys.: Condens. Matter, 2008, 20, 045218 CrossRef.
- G. V. S. Rao, C. N. R. Rao and J. R. Ferraro, Appl. Spectrosc., 1970, 24, 436–445 CrossRef CAS.
- P. Chen, X. Xu, C. Koenigsmann, A. C. Santulli, S. S. Wong and J. L. Musfeldt, Nano Lett., 2010, 10, 4526–4532 CrossRef CAS PubMed.
- B. Bhushan, Z. Wang, J. van Tol, N. S. Dalal, A. Basumallick, N. Y. Vasanthacharya, S. Kumar and D. Das, J. Am. Ceram. Soc., 2012, 95, 1985–1992 CrossRef CAS.
- J. P. Perdew and Y. Wang, Phys. Rev. B: Condens. Matter, 1992, 45, 13244–13249 CrossRef.
- B. Bhushan, A. Basumallick, S. K. Bandopadhyay, N. Y. Vasanthacharya and D. Das, J. Phys. D: Appl. Phys., 2009, 42, 065004 CrossRef.
- J. Li, Y. Duan, H. He and D. Song, Crystal structure, J. Alloys Compd., 2001, 315, 259–264 CrossRef CAS.
- S. K. Singh, H. Ishiwara and K. Maruyama, Appl. Phys. Lett., 2006, 88, 262908 CrossRef.
- D. Kothari, V. R. Reddy, A. Gupta, V. Sathe, A. Banerjee, S. M. Gupta and A. M. Awasthi, Appl. Phys. Lett., 2007, 91, 202505 CrossRef.
- Y. Benfang, L. Meiya, L. Jun, G. Dongyun, P. Ling and Z. Xingzhong, J. Phys. D: Appl. Phys., 2008, 41, 065003 CrossRef.
- X. Yu and X. An, Solid State Commun., 2009, 149, 711–714 CrossRef CAS.
- A. R. Makhdoom, M. J. Akhtar, M. A. Rafiq and M. M. Hassan, Ceram. Int., 2012, 38, 3829–3834 CrossRef CAS.
- A. Jaiswal, R. Das, K. Vivekanand, P. Mary Abraham, S. Adyanthaya and P. Poddar, J. Phys. Chem. C, 2010, 114, 2108–2115 CAS.
- A. W. Rodriguez, D. Woolf, A. P. McCauley, F. Capasso, J. D. Joannopoulos and S. G. Johnson, Phys. Rev. Lett., 2010, 105, 060401 CrossRef PubMed.
- X. Chen, H. Zhang, T. Wang, F. Wang and W. Shi, Phys. Status Solidi A, 2012, 209, 1456–1460 CrossRef CAS.
- J. Zhang, M. Rutkowski, L. W. Martin, T. Conry, R. Ramesh, J. F. Ihlefeld, A. Melville, D. G. Schlom and L. J. Brillson, J. Vac. Sci. Technol.,B, 2009, 27, 2012–2014 CAS.
- L. Jing, F. Yuan, H. Hou, B. Xin, W. Cai and H. Fu, Sci. China, Ser. B: Chem., 2005, 48, 25–30 CrossRef CAS.
- M. Reda, S. Guy, R. Olivier, C. Dorothée and V. Michel, Appl. Phys. Express, 2012, 5, 035802 CrossRef.
- M. O. Ramirez, M. Krishnamurthi, S. Denev, A. Kumar, S.-Y. Yang, Y.-H. Chu, E. Saiz, J. Seidel, A. P. Pyatakov, A. Bush, D. Viehland, J. Orenstein, R. Ramesh and V. Gopalan, Appl. Phys. Lett., 2008, 92, 022511 CrossRef.
- W. Wei, H. Xuan, L. Wang, Y. Zhang, K. Shen, D. Wang, T. Qiu and Q. Xu, Phys. B: Condens. Matter, 2012, 407, 2243–2246 CrossRef CAS.
- M. Kumar and K. Yadav, Appl. Phys. Lett., 2007, 91, 242901–242901 CrossRef.
- A. Mukherjee, M. Banerjee, S. Basu, N. T. K. Thanh, L. A. W. Green and M. Pal, Phys. B, 2014, 448, 199–203 CrossRef CAS.
- D. P. Dutta, O. D. Jayakumar, A. K. Tyagi, K. G. Girija, C. G. S. Pillai and G. Sharma, Nanoscale, 2010, 2, 1149–1154 RSC.
- I. Sosnowska, T. P. Neumaier and E. Steichele, J. Phys. C: Solid State Phys., 1982, 15, 4835 CrossRef CAS.
- M. Mahesh Kumar, S. Srinath, G. S. Kumar and S. V. Suryanarayana, J. Magn. Magn. Mater., 1998, 188, 203–212 CrossRef CAS.
- G. Biasotto, A. Z. Simões, C. Foschini, M. Zaghete, J. A. Varela and E. Longo, Mater. Res. Bull., 2011, 46, 2543–2547 CrossRef CAS.
- M. M. El-Desoky, M. M. Mostafa, M. S. Ayoub and M. A. Ahmed, J. Mater. Sci: Mater. Electron., 2015, 26, 6793–6800 CrossRef CAS.
- D. H. Wang, W. C. Goh, M. Ning and C. K. Ong, Appl. Phys. Lett., 2006, 88, 212907 CrossRef.
-
L. Jianmin, C. Dengrong, S. Juyue, J. Dengren, Y. Shengwen and C. Jinrong, 2010 IEEE International Symposium on the Applications of Ferroelectrics (ISAF), 2010.
- O. d'Hennezel and D. F. Ollis, J. Catal., 1997, 167, 118–126 CrossRef.
- O. d'Hennezel, P. Pichat and D. F. Ollis, J. Photochem. Photobiol., A, 1998, 118, 197–204 CrossRef.
- L. Zou, Y. Luo, M. Hooper and E. Hu, Chem. Eng. Process.: Process Intensif., 2006, 45, 959–964 CrossRef CAS.
- M. L. Curri, R. Comparelli, P. D. Cozzoli, G. Mascolo and A. Agostiano, Mater. Sci. Eng., C, 2003, 23, 285–289 CrossRef.
- M. Gholami, H. R. Nassehinia, A. Jonidi-Jafari, S. Nasseri and A. Esrafili, J. Environ. Health Sci. Eng., 2014, 12, 1–8 CrossRef PubMed.
- J. H. Xu, W. Wang, M. Shang, S. M. Sun, J. Ren and L. Zhang, Appl. Catal., B, 2010, 93, 227–232 CrossRef CAS.
Footnote |
| † Electronic supplementary information (ESI) available: EDS analysis shown in Fig. S1 confirmed the presence of the expected amounts of Bi, Fe and O in BFO MNPs, and the successful Ba doping in the prepared Ba-doped BFO MNPs. The quality and composition of the nanoparticles were obtained from XPS studies, and are shown in Fig. S2. See DOI: 10.1039/c6pp00212a |
|
| This journal is © The Royal Society of Chemistry and Owner Societies 2017 |
Click here to see how this site uses Cookies. View our privacy policy here. 
 *
*