 Open Access Article
Why can a gold salt react as a base?†
Mariarosa
Anania
 ,
Lucie
Jašíková
 ,
Juraj
Jašík
 and
Jana
Roithová
 *
*
Department of Organic Chemisty, Faculty of Science, Charles University, Hlavova 2030/8, Prague 2, 12843, Czech Republic. E-mail: roithova@natur.cuni.cz
First published on 25th August 2017
Abstract
This study shows that gold salts [(L)AuX] (L = PMe3, PPh3, JohnPhos, IPr; X = SbF6, PF6, BF4, TfO, Tf2N) act as bases in aqueous solutions and can transform acetone to digold acetonyl complexes [(L)2Au2(CH2COCH3)]+ without any additional base present in solution. The key step is the formation of digold hydroxide complexes [(L)2Au2(OH)]+. The kinetics of the formation of the digold complexes and their mutual transformation is studied by electrospray ionization mass spectrometry and the delayed reactant labelling method. We show that the formation of digold hydroxide is the essential first step towards the formation of the digold acetonyl complex, the reaction is favoured by more polar solvents, and the effect of counter ions is negligible. DFT calculations suggest that digold hydroxide and digold acetonyl complexes can exist in solution only due to the stabilization by the interaction with two gold atoms. The reaction between the digold hydroxide and acetone proceeds towards the dimer {[(L)Au(OH)]·[(L)Au(CH3COCH3)]+}. The monomeric units interact at the gold atoms in the perpendicular arrangement typical of the gold clusters bound by the aurophilic interaction. The hydrogen is transferred within the dimer and the reaction continues towards the digold acetonyl complex and water.
Introduction
Nowadays, homogenous gold catalysis represents a broad research field.1–5 Unique properties of gold(I) complexes consist of their strong interactions with multiple bonds6–9 and the formation of rather stable, long-lived intermediates with carbon–gold bonds.10–12 In addition, the aurophilic interaction makes the formation of complexes with a gold–gold bond favourable which is probably in the background of cooperative effects in gold catalysis.13–16 These points make gold(I) catalysis an attractive topic for mechanistic research.17–20Mass spectrometry is a valuable tool in the research of gold(I) complexes, because they are easily detectable by electrospray ionization (ESI). The classical mechanistic tools such as the determination of reaction kinetics by NMR or UV-vis spectroscopy are related to the kinetics of the overall reaction. Mass spectrometry, on the contrary, provides data related directly to the gold-containing intermediates. It can be therefore extremely useful, for example, in answering the questions about the role of monoaurated and diaurated intermediates in a reaction mechanism, the topic of an ongoing discussion.12,17,21,22
The disadvantage of electrospray ionization mass spectrometry in the research of reactions proceeding in solutions is that the molecules or ions have to be transferred from the reaction mixture to the gas phase. This process can be accompanied by the formation of various ions in the gas phase during the electrospray ionization process. These ions are then not related to the actual reaction mixture and can be misleading in the interpretation of the results. We have developed a method – Delayed Reactant Labelling – that enables us to eliminate these artefacts and moreover to investigate the reaction kinetics of the ESI-MS detected ions in the reaction mixture.12,23
Delayed Reactant Labelling consists of relative quantification of the detected signals with respect to their isotopically labelled analogues. Clearly, isotopically labelled intermediates cannot be just added to the reaction mixture, therefore we use a trick of adding an isotopically labelled reactant with a time delay to the reaction mixture. It means that we can observe pairs of the ESI-MS signals for all complexes containing the reactant molecule (i.e. reactant complexes, intermediates, product complexes, products). As the labelled reactant is added with a time delay, the labelled intermediates/products are initially present at a lower concentration. With time, the concentrations of unlabelled and labelled intermediates become equal. The time evolution is linked to the kinetics of their formation and degradation. As the ESI-MS response for isotopically labelled ions/molecules is the same, the whole process can be quantitatively observed by ESI-MS. The ions that are formed in the gas-phase during the electrospray ionization (or in a fast equilibrium in solution) do not show any time evolution of the labelled vs. unlabelled signals and can thus be easily identified.
Here, we will address the formation of gold–acetonyl complexes, compounds that have a C–Au bond and are stable in aqueous solutions. Gold–ketonyl complexes can be prepared from ketones and a gold salt in the presence of a base.24,25 These complexes can be then used as precatalysts by releasing the gold complex in the presence of an acid.23,26 Gold–ketonyl complexes were also predicted as intermediates in a coupling reaction.27 We have observed the formation of gold acetonyl complexes even in the absence of a base and could detect the signals of the monogold acetonyl as well as the digold acetonyl complexes. This raises interesting questions about the mechanism of the formation of these complexes and a possible role of the gold–gold cooperative effect in it.
Results
Generation of the digold acetonyl complex [(L)2Au2(CH2COCH3)]+
Previous studies reported the preparation of gold(I) acetonyl complexes from an acetone solution of a gold catalyst in the presence of a base. We have detected digold acetonyl complexes by electrospray ionization (ESI) from the solutions containing acetone even without any additional base. Importantly, however, the presence of water in the solution was essential. We note that this reaction is not exclusive for acetone, but other ketones react as well. An example with cyclohexanone can be found in the ESI (Fig. S1†).We set out to determine the mechanism of the formation of the digold acetonyl complexes and the role of water molecules in it. All experiments were done in acetone, water and THF (tetrahydrofuran) or dioxane mixture of solvents (the exact ratios will be given for each experiment). THF and dioxane do not participate in the reaction and were used for making the solutions of gold complexes to which acetone and water were added.
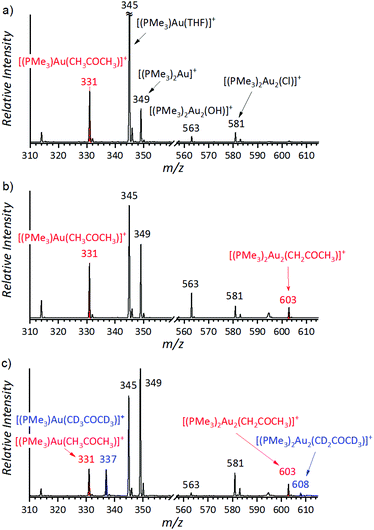
The initial experiments were done with (PMe3)Au(SbF6). The electrospray ionization mass spectrum (ESI-MS) of the solution of (PMe3)Au(SbF6) in dry acetone and THF shows that the trimethylphosphino gold cation can be coordinated to acetone (m/z 331), THF (m/z 345), or another trimethylphosphine ligand (m/z 349) (Fig. 1a). We can also see two digold complexes: [(PMe3)2Au2OH]+ (m/z 563) and [(PMe3)2Au2Cl]+ (m/z 581); the former is a product of a reaction between the gold complex and a trace amount of water; the latter is present due to the chloride residual after the counter ion exchange (see the Experimental details). Addition of water to the solution results in an increase of the ESI-MS signal of [(PMe3)2Au2OH]+ and the appearance of the signal of the digold acetonyl complex [(PMe3)2Au2(CH2COCH3)]+ (m/z 603) (Fig. 1b).
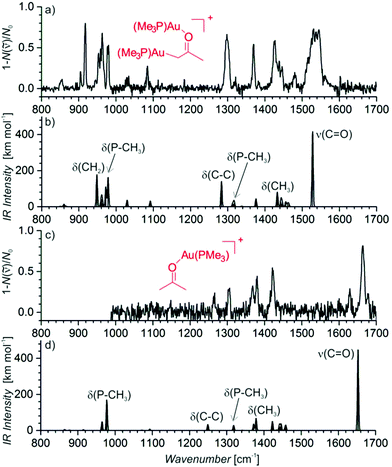
The signal of the digold acetonyl complex can indicate its presence in the solution or it can be due to a neutral monogold acetonyl complex that is tagged by another gold cation during the ESI process. The structure of the detected complex was probed by helium tagging IRPD (infrared photodissociation) spectroscopy (Fig. 2a) that provides the infrared spectra of mass-selected ions.28 The IRPD spectrum of [(PMe3)2Au2(CH2COCH3)]+ is consistent with the structure in which one (PMe3)Au+ group replaced a hydrogen atom of a methyl group and the other (PMe3)Au+ unit is bound to the oxygen atom (Fig. 2b shows a theoretical IR spectrum of this complex). We can exclude all variants of the complex with the enol form of acetone. Such structures would be characterized by the stretching bands of the single C–O bond expected at about 1200 cm−1 and the C![[double bond, length as m-dash]](https://www.rsc.org/images/entities/char_e001.gif) C double bond expected above 1600 cm−1 (see Fig. S2 in the ESI†). Neither of these signatures is present in the experimental spectrum.
C double bond expected above 1600 cm−1 (see Fig. S2 in the ESI†). Neither of these signatures is present in the experimental spectrum.
We have also obtained the IRPD spectrum of the complex between acetone and (PMe3)Au+ (Fig. 2c). It nicely corresponds to the expected coordination of the gold cation to the carbonyl group (Fig. 2d shows the corresponding theoretical IR spectrum; Fig. S3 in the ESI† shows the theoretical IR spectrum of the enol form of acetone). The stretching mode of the gold-coordinated carbonyl group is at 1663 cm−1 in the IRPD spectrum of the monogold complex and at 1537 cm−1 in the spectrum of the digold complex. The large red-shift that occurs in the digold complex is a result of a partial electron delocalization between the gold atoms.
Kinetic isotope effect (KIE)
Knowing the structure of the digold acetonyl ions, we wanted to know how these ions are formed. One of the parameters that should be closely related to the reaction mechanism is the kinetic isotope effect for the C–H activation of acetone. We compared the formation of the digold acetonyl complexes from the reaction of [(PMe3)AuSbF6] with a 1![[thin space (1/6-em)]](https://www.rsc.org/images/entities/char_2009.gif) :
:![[thin space (1/6-em)]](https://www.rsc.org/images/entities/char_2009.gif) 1 mixture of CH3COCH3 and CD3COCD3. If the reaction was irreversible, then the KIE should be simply the ratio between the concentrations of [(PMe3)2Au2(CH2COCH3)]+ and [(PMe3)2Au2(CD2COCD3)]+. The ESI-MS response to isotopically labelled compounds is the same; therefore, the concentration ratio is equal to the ratio of the intensities of the corresponding peaks in the ESI-MS spectrum (Fig. 1c).29,30
1 mixture of CH3COCH3 and CD3COCD3. If the reaction was irreversible, then the KIE should be simply the ratio between the concentrations of [(PMe3)2Au2(CH2COCH3)]+ and [(PMe3)2Au2(CD2COCD3)]+. The ESI-MS response to isotopically labelled compounds is the same; therefore, the concentration ratio is equal to the ratio of the intensities of the corresponding peaks in the ESI-MS spectrum (Fig. 1c).29,30
For reproducible conditions, we prepared first a solution of the gold complex in THF, then added a given amount of water, and a 1![[thin space (1/6-em)]](https://www.rsc.org/images/entities/char_2009.gif) :
:![[thin space (1/6-em)]](https://www.rsc.org/images/entities/char_2009.gif) 1 mixture of acetone and acetone-d6 and monitored the final mixture by ESI-MS. We found out that the ratio of the signals of [(PMe3)2Au2(CH2COCH3)]+ and [(PMe3)2Au2(CD2COCD3)]+ strongly depended on the water content in the solution and it was changing with time. At the beginning of the experiment the apparent KIE was large (above 10) and it converged to a smaller value in about 1 hour (see Fig. S4–S11 in the ESI†). The converged KIEs ranged from 3.8 (with 50% addition of water) to 6.2 (with 5% addition of water). We repeated the experiment with D2O instead of H2O and obtained the same results within the experimental error (see Table 1 and Fig. S12 in the ESI†).
1 mixture of acetone and acetone-d6 and monitored the final mixture by ESI-MS. We found out that the ratio of the signals of [(PMe3)2Au2(CH2COCH3)]+ and [(PMe3)2Au2(CD2COCD3)]+ strongly depended on the water content in the solution and it was changing with time. At the beginning of the experiment the apparent KIE was large (above 10) and it converged to a smaller value in about 1 hour (see Fig. S4–S11 in the ESI†). The converged KIEs ranged from 3.8 (with 50% addition of water) to 6.2 (with 5% addition of water). We repeated the experiment with D2O instead of H2O and obtained the same results within the experimental error (see Table 1 and Fig. S12 in the ESI†).
| Gold complex | KIE | |
|---|---|---|
| 5% watera | 50% watera | |
a The experiments were performed in the solutions of [(L)AuX] (0.3 mM) in THF, acetone, acetone-d6 in a 2![[thin space (1/6-em)]](https://www.rsc.org/images/entities/char_2009.gif) : :![[thin space (1/6-em)]](https://www.rsc.org/images/entities/char_2009.gif) 1 1![[thin space (1/6-em)]](https://www.rsc.org/images/entities/char_2009.gif) : :![[thin space (1/6-em)]](https://www.rsc.org/images/entities/char_2009.gif) 1 ratio with additional 5% or 50% of water.
b In the presence of D2O instead of H2O.
c The experiments were performed in the solutions of [(IPr)AuX] (0.3 mM) in dioxane, acetone, acetone-d6 in a 2 1 ratio with additional 5% or 50% of water.
b In the presence of D2O instead of H2O.
c The experiments were performed in the solutions of [(IPr)AuX] (0.3 mM) in dioxane, acetone, acetone-d6 in a 2![[thin space (1/6-em)]](https://www.rsc.org/images/entities/char_2009.gif) : :![[thin space (1/6-em)]](https://www.rsc.org/images/entities/char_2009.gif) 7 7![[thin space (1/6-em)]](https://www.rsc.org/images/entities/char_2009.gif) : :![[thin space (1/6-em)]](https://www.rsc.org/images/entities/char_2009.gif) 7 ratio with additional 5% or 50% of water.
d [(IPr)2Au2OH]BF4 also reacts under dry conditions, the kinetic isotope effect is 5.5 ± 0.1. 7 ratio with additional 5% or 50% of water.
d [(IPr)2Au2OH]BF4 also reacts under dry conditions, the kinetic isotope effect is 5.5 ± 0.1.
|
||
| (PMe3)AuSbF6 | 6.2 ± 0.2 | 3.8 ± 0.4 |
| (PMe3)AuSbF6 | 6.0 ± 0.3b | 3.3 ± 0.2b |
| (PMe3)AuPF6 | 6.9 ± 0.4 | 3.9 ± 0.3 |
| (PMe3)AuOTf | 6.2 ± 0.2 | 3.1 ± 0.3 |
| (PMe3)AuNTf2 | 6.7 ± 0.7 | 3.7 ± 0.5 |
| (PPh3)AuNTf2 | 7.0 ± 0.3 | 5.9 ± 0.4 |
| (PPh3)AuSbF6 | 6.8 ± 0.4 | 6.6 ± 0.2 |
| (JohnPhos)Au(CH3CN)SbF6 | 5.1 ± 0.5 | 3.5 ± 0.2 |
(IPr)Au(CH3CN)BF4![[thin space (1/6-em)]](https://www.rsc.org/images/entities/char_2009.gif) c c |
6.5 ± 0.3 | 5.2 ± 0.3 |
| (IPr)AuOTfc | 3.5 ± 0.8 | 5.3 ± 0.3 |
(IPr)AuNTf2![[thin space (1/6-em)]](https://www.rsc.org/images/entities/char_2009.gif) c c |
4.7 ± 0.1 | 5.4 ± 0.1 |
(IPr)2Au2(OH)BF4![[thin space (1/6-em)]](https://www.rsc.org/images/entities/char_2009.gif) c,d c,d |
6.0 ± 0.1 | 4.6 ± 0.2 |
These results suggest that the digold acetonyl complexes are not formed in a simple irreversible reaction, but probably in equilibrium reactions with different species in solution.
Counter ion effect
The formation of gold acetonyl complexes has to be mediated by a basic reactant. Possible basic species in solution are counter ions from the gold complex and hydroxide anions. As described above, we detect [(PMe3)2Au2OH]+ and [(PMe3)2Au2Cl]+ and these ions are in equilibrium with their neutral variants and SbF6− (see Scheme 1). | ||
| Scheme 1 Equilibrium between different complexes in the solution of [(L)AuX] complex (L = ligand, X = counter ion) in THF, water and acetone. | ||
The requirement of the presence of water in solution for the formation of digold acetonyl can mean that the formation of hydroxide is the necessary first step in the reaction mechanism or, alternatively, the polarity of the solvent drives the equilibrium towards the formation of digold acetonyl.
In order to test whether the C–H activation is mediated by the hydroxide or the counter ions are involved directly,31 we investigated the C–H activation reaction of acetone under the same conditions with a series of different [(PMe3)AuX] salts. The salts were prepared from [(PMe3)AuCl] and the corresponding silver salt AgX (X = SbF6, PF6, OTf or NTf2). If the C–H activation was mediated by the counter ions, then the rate of the reactions should depend on the counter ion. The coordination ability of the counter ions to the gold cations increases in the order SbF6− ∼ PF6− < BF4− ≪ NTf2− < OTf−.32–34 The pKa values of the conjugated acids increase in the order BF4− < OTf− < NTf2− < SbF6−.35
We again monitored the time evolution of the [(PMe3)2Au2(CH2COCH3)]+ and [(PMe3)2Au2(CD2COCD3)]+ ESI-MS signals from the solutions of different gold salts in THF/acetone/acetone-d6 and additional 5% or 50% of water (Fig. S13–S18 in the ESI†). The differences between the experiments with different gold salts are on the order of the experimental error. The equilibrium KIEs determined at the end of the experiments are also the same within the experimental error (Table 1). These results point towards the conclusion that the counter ion is not directly involved in the studied reaction.
We note that the role of counter ions can be important indirectly. They can influence the rate of the overall reaction by a possible coordination to the gold complex leading to the deactivation of a part of the catalyst. They can also affect the stability/degradation of the gold complex and thus influence the overall yield of the reaction.
Ligand effect
If the C–H activation of acetone were mediated by (di)gold hydroxide, then the ligand at the gold atom should affect the reaction rate. To probe it, we again determined KIEs for the C–H activation of acetone in the presence of different amounts of water – now in dependence of different [(L)AuSbF6] gold complexes (L = PMe3, PPh3, JohnPhos = 2-biphenyl(di-tert-butylphosphine)). The ligand has a clear effect on the reaction. With PPh3, the effect of the water content is not so significant and the kinetic isotope effect remains in the range of ∼6 even with a large water content (see Table 1). The use of the bulky phosphine ligand JohnPhos results in a smaller KIE for the C–H activation of acetone in a mixture with 5% water content. Also, the time evolution of the signals of the unlabelled and labelled digold complexes differs in dependence of the present ligand (Fig. S13–S24†). Hence, we can conclude that the gold complex with its ligand is directly involved in the C–H activation step as well as it influences the final equilibrium in solution.Next to the phosphine ligands, N-heterocyclic carbene ligands are popular in gold catalysis as well. We have tested the frequently used IPr ligand (IPr = 1,3-bis(2,6-diisopropylphenyl)imidazol-2-ylidene). The experiments had to be performed in solutions with dioxane instead of THF, because the ESI-MS spectra from THF/acetone solutions contained an impurity having the same m/z ratio as the digold acetonyl complexes. Furthermore, we couldn't conduct experiments with [(IPr)Au(SbF6)], because AgSbF6 is insoluble in dioxane. The experiments with other [(IPr)Au(X)] salts (X = BF4, OTf, NTf2) show a different trend from that found for the phosphino gold complexes (see Table 1 and Fig. S25 and S26 in the ESI†). In the experiments with a large amount of water (50%), the KIEs are very similar regardless of the counter ion. In contrast, the results obtained in the solutions with only 5% of water differ in dependence of the counter ion. The KIEs increase from about 3.5 to 6.5 in the order of counter ions: OTf− < NTf2− < BF4−. This order corresponds to the order of decreasing coordination ability of the counter ions to the gold complex. Hence, a better coordinating counter ion renders the reaction with a smaller KIE. It can mean that in the case of the [(IPr)Au(X)] complex and a small content of water in solution (understand: low concentration of [(IPr)2Au2OH]+), the counter ion might participate in the deprotonation step and the reaction might also be mediated by [(IPr)Au(X)] or [(IPr)2Au2(X)]+.
We performed the experiments also with the [(IPr)2Au2OH]BF4 salt in the absence of water (only in the solution with dioxane and acetone). We have observed the formation of the digold acetonyl complexes and the KIE was 5.5 ± 0.1 (Fig. S27†). This value is consistent with the values found for all experiments with [(IPr)Au(X)] and a larger content of water. This suggests that digold hydroxide is the key reactant in the C–H activation of acetone (though in the absence of digold hydroxide, the IPr ligand supports also a pathway, where a counter ion acts as a base).
Formation of gold acetonyl complexes in time
We tested the dependence of the relative abundances of the detected [(PMe3)2Au2OH]+, [(PMe3)2Au2Cl]+, and [(PMe3)2Au2(CH2COCH3)]+ first. In order to eliminate the interference of establishing the equilibrium between [(PMe3)AuSbF6], [(PMe3)nAunCl]0/+ and [(PMe3)nAunOH]0/+ (n = 1 or 2) we mixed the catalyst in THF and a given amount of water and left it to equilibrate for 15 hours (overnight). Then, we added a 1![[thin space (1/6-em)]](https://www.rsc.org/images/entities/char_2009.gif) :
:![[thin space (1/6-em)]](https://www.rsc.org/images/entities/char_2009.gif) 1 mixture of acetone and acetone-d6 and monitored the reaction mixture by ESI-MS.
1 mixture of acetone and acetone-d6 and monitored the reaction mixture by ESI-MS.
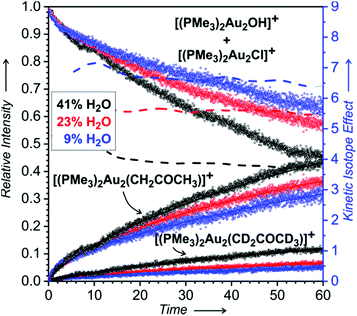
Firstly, we evaluated the signal intensities of the detected digold complexes with respect to each other (Fig. 3). The results clearly revealed that the concentrations of the digold complexes are mutually dependent. The addition of acetone to the solution of the gold catalyst in THF and water leads to the depletion of the concentrations of [(PMe3)2Au2OH]+ and [(PMe3)2Au2Cl]+ concomitant with the formation of the digold acetonyl complexes.
This experiment once more confirms that the ratio of the concentrations of [(PMe3)2Au2(CH2COCH3)]+ and [(PMe3)2Au2(CD2COCD3)]+ depends on the water content in solution (the dashed lines in Fig. 3 are the interpolations of the ratios of the experimental points). It also shows that the rate of the conversion of [(PMe3)2Au2OH]+ and [(PMe3)2Au2Cl]+ to digold acetonyl complexes increases with the increasing content of water.
We did not detect such strong mutual signal dependencies in the range of the monoaurated complexes. The exception was the growing intensity of the [(PMe3)2Au]+ signal that is a signature of the catalyst degradation with time (Fig. S28 in the ESI†). The monoaurated complexes [(PMe3)Au(CH3COCH3)]+ and [(PMe3)Au(CD3COCD3)]+ are initially formed in the 1![[thin space (1/6-em)]](https://www.rsc.org/images/entities/char_2009.gif) :
:![[thin space (1/6-em)]](https://www.rsc.org/images/entities/char_2009.gif) 1 ratio as expected for complexes with solvent molecules that are in a fast equilibrium. This ratio, however, increased with time in favour of the unlabelled complex and this trend is much more apparent in the experiments with a large water content in solution (Fig. 4).
1 ratio as expected for complexes with solvent molecules that are in a fast equilibrium. This ratio, however, increased with time in favour of the unlabelled complex and this trend is much more apparent in the experiments with a large water content in solution (Fig. 4).
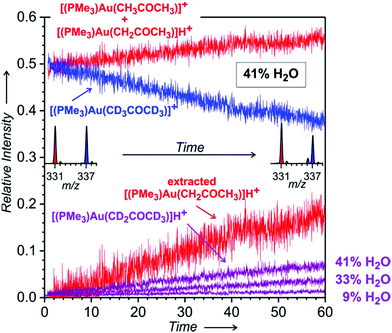 | ||
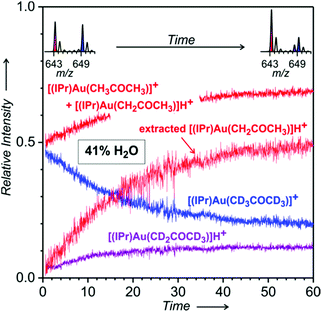
Fig. 4 Time evolution of the relative intensities of the signals at m/z 331 ([(PMe3)Au(CH3COCH3)]+ + [(PMe3)Au(CH2COCH3)]H+ in red), m/z 336 ([(PMe3)Au(CD2COCD3)]H+ in violet), and m/z 337 ([(PMe3)Au(CD3COCD3)]+ in blue – this intensity was corrected for the 13C contribution of the signal at m/z 336). Under the assumption that the complexes with intact acetone molecules are formed in the 1![[thin space (1/6-em)]](https://www.rsc.org/images/entities/char_2009.gif) : :![[thin space (1/6-em)]](https://www.rsc.org/images/entities/char_2009.gif) 1 ratio during the whole experiment, the evolution of the signal intensity of [(PMe3)Au(CH2COCH3)]H+ was extracted as a difference between the intensities of m/z 331 and m/z 337. Experiment: the same as described in the caption of Fig. 3. The experiment was performed with 41% water content in the solution of the gold complex in THF and water; evolution of [(PMe3)Au(CD2COCD3)]H+ in the experiments with 33% and 9% of water is shown as well, the rest of the data are in Fig. S30 and S31 in the ESI.† 1 ratio during the whole experiment, the evolution of the signal intensity of [(PMe3)Au(CH2COCH3)]H+ was extracted as a difference between the intensities of m/z 331 and m/z 337. Experiment: the same as described in the caption of Fig. 3. The experiment was performed with 41% water content in the solution of the gold complex in THF and water; evolution of [(PMe3)Au(CD2COCD3)]H+ in the experiments with 33% and 9% of water is shown as well, the rest of the data are in Fig. S30 and S31 in the ESI.† | ||
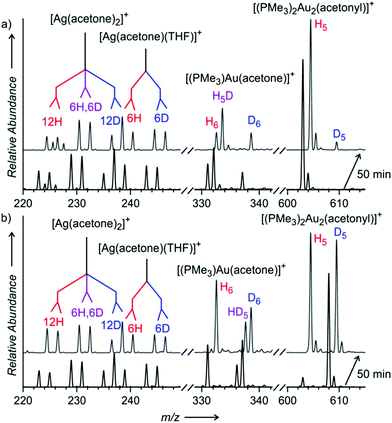
Next to the expected signals of [(PMe3)Au(CH3COCH3)]+ (m/z 331) and [(PMe3)Au(CD3COCD3)]+ (m/z 337), we also detected a signal with m/z 336. This signal is not due to the H/D scrambling in acetone-d6, because other detected complexes bearing acetone do not show the same H/D scrambling pattern (see Fig. S29 in the ESI† and Fig. 6 and 7 below). We assign this signal to the protonated ion [(PMe3)Au(CD2COCD3)]H+ formed during ESI from the neutral gold acetonyl complexes ([(PMe3)Au(CD2COCD3)]) present in the solution.
For quantitative evaluation, we normalized the signals corresponding to the complexes of trimethylphosphino gold with unlabelled and labelled acetone to their sum and plotted their mutual evolution (Fig. 4). We can see that the signal of [(PMe3)Au(CD2COCD3)]H+ grows with time. The comparison of the experiments with different contents of H2O in solution reveals that with a larger content of water, more of the neutral gold–acetonyl complex is formed (see the violet signal evolutions in Fig. 4). Under the assumption that the gold complexes with intact molecules of acetone are formed in the 1![[thin space (1/6-em)]](https://www.rsc.org/images/entities/char_2009.gif) :
:![[thin space (1/6-em)]](https://www.rsc.org/images/entities/char_2009.gif) 1 ratio during the whole experiment, we can extract a signal that corresponds to [(PMe3)Au(CH2COCH3)]H+ (see the red line in Fig. 4 labelled as the extracted signal). The KIE for the experiment with 41% water content is about 3.
1 ratio during the whole experiment, we can extract a signal that corresponds to [(PMe3)Au(CH2COCH3)]H+ (see the red line in Fig. 4 labelled as the extracted signal). The KIE for the experiment with 41% water content is about 3.
We have repeated the same experiments with D2O instead of H2O in order to see whether the water molecules as such get involved in the deprotonation of acetone. The time evolution of the diaurated signals as well as the monoaurated signals stayed the same within the experimental error (Fig. S32 and S33 in the ESI†). Hence, we conclude that water molecules are not directly involved in the formation of the digold acetonyl complexes, neither in the formation of the monogold acetonyl complexes.
Next, we repeated the same experiments with the [(IPr)AuBF4] catalyst. The experiments are analogous, but we used dioxane instead of THF for the preparation of the gold complex solutions. The results are evaluated precisely in the same way as above. The time evolution of the formation of the digold acetonyl complexes is rather similar to that obtained with the phosphine ligand (Fig. S34 in the ESI†) and will not be discussed further.
The time evolution in the range of monogold complexes with acetone again reveals the formation of neutral gold acetonyl complexes (Fig. 5). The evaluation of the signals shows that more of the cationic gold is transformed to these neutral complexes than we found in the experiment with the trimethylphosphino gold catalyst. Repetition of the experiments with D2O confirmed that there is no effect and molecules of water are not directly involved in the formation of the gold acetonyl complexes (Fig. S35 in the ESI†).
Stability of [(L)2Au2(CH2COCH3)]+
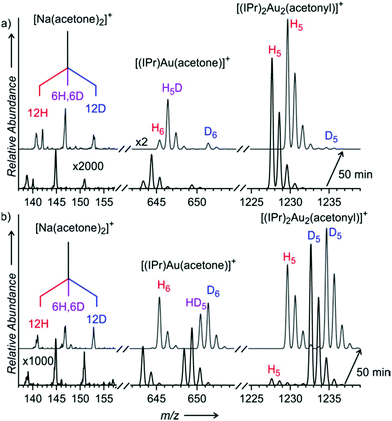
Finally, we have probed the reversibility of the gold acetonyl complex formation by preparing a solution of [(PMe3)AuSbF6] in THF, acetone and 33% water, let it react overnight and then adding D6-labeled acetone (or vice versa). In the experiment with overnight activation of CH3COCH3 in the presence of D2O, we can see a significant amount of the [(PMe3)Au(CH2COCH3)]D+ complexes (m/z 332, see Fig. 6a). We can exclude that the signal would be due to an H/D scrambling between acetone and D2O by examining the signals of other complexes with acetone (see Fig. 6a). We note in passing that the signal at m/z 224 and 226 corresponds to silver complexes with the product of the aldol reaction – CH3–C(CH3)(OD)–CH2–(CO–CH3). This is clear because there is almost no H/D-scrambling in complexes with only one molecule of acetone (e.g. [Ag(CH3COCH3)(THF)]+).In the experiment with overnight activation of CD3COCD3 in the presence of H2O we detect [(PMe3)Au(CD2COCD3)]H+ (m/z 336, see Fig. 6b). In both experiments shown in Fig. 6, the ratio between the gold complexes of CH3COCH3 (m/z 331) and CD3COCD3 (m/z 337) right at the beginning of the experiment is close to 1. It perfectly reflects the relative concentration of CH3COCH3 and CD3COCD3 in solution and indicates that these signals are only due to the gold complexes with intact solvent molecules. On the other hand, [(PMe3)Au(CH2COCH3)]D+ (in Fig. 6a) and [(PMe3)Au(CD2COCD3)]H+ (in Fig. 6b) are formed by protonation of neutral gold acetonyl complexes formed overnight.
The same experiments with the [(IPr)AuBF4] complex led to analogous results. The spectra again showed a large build-up of the neutral gold–acetonyl complexes in an overnight experiment (see Fig. 7). All spectra of the reaction mixtures in which the gold acetonyl complexes were formed overnight reveal only small intensities of digold hydroxide and digold chloride complexes (Fig. S36–S43†). It can be assumed that most of the gold cations are incorporated into the gold acetonyl complexes. Also, the relative abundances of the other than gold acetonyl complexes do not change significantly during these experiments (Fig. S36–S43†).
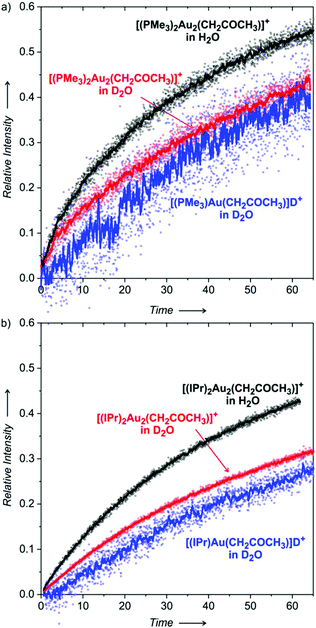
Next we plotted the time evolution of the relative ESI-MS signal intensities of the unlabelled and labelled digold acetonyl and monogold acetonyl complexes. The latter is possible by using the same strategy as we applied in the experiments shown in Fig. 4 and 5. The advantage of the mutual evaluation of the signals corresponding to the very same ions differing only in the isotopic labelling is that it is quantitative and directly corresponds to their relative concentrations in solution. Hence, it allows us to study the kinetics of the evolution of their concentrations. Note that the time evolutions of the signals of the unlabelled and labelled complexes are mirror images because they are evaluated with respect to each other. Therefore, we show only the unlabelled signals in Fig. 8.
We will discuss the experiments, where the deuterated gold acetonyl complexes were formed in the overnight experiment and then let to react with unlabelled acetone (Fig. 8; the opposite variant is a much slower reaction). The black points show the formation of [(L)2Au2(CH2COCH3)]+ (L = PMe3 in Fig. 8a and IPr in Fig. 8b) in the solution containing H2O, whereas the red points refer to the same experiment but in the presence of D2O. Clearly, H2O in the solution makes the reaction faster than D2O.
We know from the previous experiments that the equilibrium KIE is around 3.5 for L = PMe3 and around 5 for L = IPr (see Table 1, 50% water content). Here, after about one hour of the experiment in the presence of H2O we achieve a ratio of only slightly higher than 1 for L = PMe3 and we stay below 1 for L = IPr. The reaction is even slower in the presence of D2O. We can thus conclude that the formation of the digold acetonyl complexes is reversible, but the reaction is very slow. The mechanism most probably involves the protodeauration of the gold acetonyl complexes, therefore there is a significant effect of H2O vs. D2O.
Finally, we extracted the evolution of the concentrations of monogold complexes [(L)Au(CH2COCH3)] and [(L)Au(CD2COCD3)] in D2O with respect to each other (blue curves in Fig. 8; the extraction procedure was the same as described for Fig. 4 and 5). The results show that the rate of the equilibration of the monogold acetonyl complexes is similar to that of the digold acetonyl complexes. The better signal-to-noise ratio of the results obtained with the IPr ligand allows us to conclude that the equilibration of the monogold acetonyl complexes is somewhat slower than the digold acetonyl complexes.
Discussion
Thermochemistry
Our results clearly show that gold complexes with non-coordinating counter ions react in aqueous solutions as bases and convert acetone to gold(I) acetonyl complexes. The key question is why they can act as a base. To answer this question, we calculated the reaction enthalpies of equilibrium reactions in which the gold catalyst and water can take part. The calculations were performed in water or THF (using the continuum solvation model) and hydroxonium cations were treated as dimers (H5O2+) in order to at least partially account for the stabilization by explicit interactions with other solvent molecules in the solution.The reaction between [(PMe3)Au(H2O)]+ and a water molecule to form neutral [(PMe3)Au(OH)] and the hydroxonium ion is highly endothermic (79 kJ mol−1 in water and 119 kJ mol−1 in THF, Scheme 2). The subsequent interaction with another cation [(PMe3)Au(H2O)]+ to form [(PMe3)2Au2(OH)]+ is exothermic by 54 kJ mol−1 in water and 82 kJ mol−1 in THF. The overall reaction is thus endothermic by 25 kJ mol−1 in water and 37 kJ mol−1 in THF.
Our computational treatment of the hydroxonium cation is probably not sufficient and further stabilization by interactions with more molecules of water is expected.36 If we assume that the hydroxonium ion can be further stabilized by interactions with more basic molecules present in the solution (such as acetone or anions) it makes the overall energy balance as about thermoneutral. We can thus conclude that the stabilization of the hydroxide anion by interaction with two gold cations drives the formation of a base in solution. Furthermore, more polar solvents (here water) will shift the reaction more towards the formation of digold hydroxide than less polar solvents. This is mainly because of the stabilization of the hydroxonium ions.
The next step is the reaction of gold hydroxides with acetone. Both monogold hydroxide and digold hydroxide react exothermically with acetone in water to yield the acetonyl complexes. The less polar solvent THF makes the reaction to form digold acetonyl less favoured and we found it to be thermoneutral. These results are in agreement with the findings that a lower content of water led to a smaller conversion of digold hydroxide to digold acetonyl (see Fig. 3). Scheme 3 once more demonstrates that the formation of digold complexes is thermodynamically favoured and should largely prevail in solution.
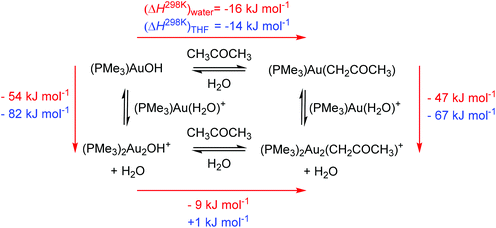 | ||
| Scheme 3 Thermochemistry of the digold acetonyl complex formation in water (red numbers) and in THF (blue numbers). | ||
Finally, we address a possible scenario of the decomposition of the gold acetonyl complexes. Similar to the digold hydroxide complexes, the transmetalation of one gold cation to another solvent molecule is endothermic (entries 1 and 2 in Scheme 4). Possible degradation can thus proceed only via protodeauration as the experiments suggested. The protodeauration of the digold acetonyl complex with hydroxonium ions in water is only 22 kJ mol−1 exothermic. This value is again probably overestimated by the treatment of the hydroxonium ion. Moreover, the reaction represents the interaction between two positively charged ions. This explains why the reaction is so slow and why we see in the experiment only a very slow equilibration between the digold acetonyl complexes once all gold cations are incorporated into the gold acetonyl complexes. The protodeauration of monogold acetonyl complexes is much more exothermic (entry 4 in Scheme 4) and will not be hindered by the cation–cation interaction. The half-life of the monoaurated acetonyl complexes should be therefore much shorter.
The results obtained in THF again suggest that the gold acetonyl complexes will be less stable in less polar solvents. As mentioned above, this is mainly due to the smaller stabilization of the hydroxonium ions. We can speculate that the addition of another base (that would bind the released protons) can change the results and the preference for the formation and stability of digold acetonyl complexes can be even larger in less polar solvents, because of the larger stabilization of the digold complexes with respect to the monogold complexes (see Scheme 3).
The experiments suggest that the equilibration of the monogold acetonyl complexes is somewhat slower than that of the digold acetonyl complexes. It cannot be caused by a larger stability of the monogold complexes (because the opposite is true). If the formation of the digold acetonyl complexes proceeds via the monogold acetonyl complexes then the monogold complexes would be formed either faster or with the same rate as the digold complexes. This is again opposed to the experimental results. Hence, the only explanation for the observed results is that primarily the digold acetonyl complexes are formed and they only slowly decompose into the monogold acetonyl complexes.
Mechanism of the C–H activation reaction
The remaining question is how the digold hydroxide complex activates the C–H bond of acetone and is transformed into the digold acetonyl complex. DFT calculations suggest that the gold–gold interaction plays an essential role in this transformation (Fig. 9). The initial complex between digold hydroxide and acetone (A) undergoes a rearrangement to the dimeric complex {([(PMe3)Au(CH3COCH3)]·[(PMe3)Au(OH)])+} (B). The monomeric units are oriented perpendicular to each other and interact via the gold atoms (see the optimized structure B in Fig. 9).37,38 The relative energy of B is only 7 kJ mol−1 higher than the initial complex A.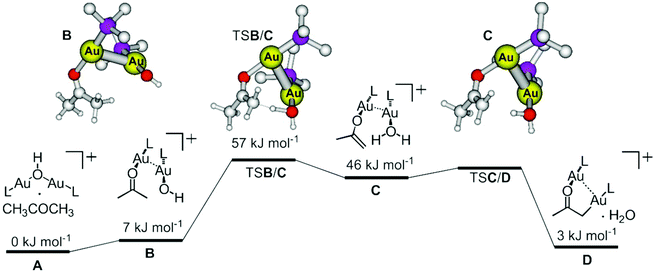 | ||
| Fig. 9 DFT potential energy surface for the C–H activation of acetone within the complex [(PMe3)2Au2(OH)(CH3COCH3)]+. The ball and stick models correspond to the optimized structures; the hydrogen atoms at the PMe3 ligands were removed for the clarity. The full optimization of the transition structure TSC/D was not successful, because it is a very shallow stationary point. Method: M06-D3/6-311+G*(Au:SDD), SMD approximation for the solvation by water (XYZ coordinates of all structures can be found in Table S1 in the ESI†). | ||
The proton transfer occurs within the dimeric complex (TSB/C) and leads to another dimer composed of the [(PMe3)Au(H2O)]+ and [(PMe3)Au(CH2C(O)CH3)] units. This step is endothermic (46 kJ mol−1), because it contains energetically disfavoured gold enolate. The final step is a simple slip of the gold atom to the methylene group (TSC/D) which leads to the formation of a complex between digold acetonyl and water. The overall reaction is endothermic by 3 kJ mol−1. As mentioned above, if isolated digold complexes are assumed as the starting and final points, then the reaction is exothermic by 9 kJ mol−1.
Kinetic isotope effect
A decrease of the kinetic isotope effect for the C–H activation of acetone with the increasing amount of water (Table 1) can be explained by the participation of another molecule of water in the proton transfer reaction.39 This explanation is in agreement with the fact that the most significant drop of KIEs is observed for the trimethylphosphino gold complex. The small ligand does not sterically hinder the participation of other water molecules in the transition state. On the other hand, for the complexes with large ligands, the KIE drop is much smaller (see the results for the complexes with the PPh3 ligand or IPr together with non-coordinating anion BF4−). The small change of the kinetic isotope effect indicates that the reaction mechanism stayed probably the same and the C–H activation proceeds in a “hydrophobic pocket” formed by the large ligands.40Conclusions
We have shown experimentally that a gold complex ([(L)AuX], L is a ligand, X is a counter ion) in a solution containing water can act as a strong base. It deprotonates acetone to form stable gold–acetonyl complexes. The reaction proceeds firstly via the formation of a digold hydroxide complex [(L)2Au2OH]+ and this complex can deprotonate acetone and form the digold acetonyl complex [(L)2Au2(CH2COCH3)]+. We can also observe the formation of monogold acetonyl complexes [(L)Au(CH2COCH3)], but the kinetics of their formation suggests that they are formed from the primary digold acetonyl complexes. The conversion of digold hydroxide to digold acetonyl is larger, if the solution contains more water.In order to evaluate the effects of ligands and counter ions in the reaction of gold complexes, we have measured the kinetic isotope effects of the C–H activation step. We showed that there is a negligible effect of counter ions with the exceptions of [(IPr)Au(OTf)] and [(IPr)Au(NTf2)] in a solution with a low content of water. Otherwise, counter ions are most probably not involved in the C–H activation reaction. Ligands influence the reaction which is consistent with the scenario that the gold complex is directly present in the transition structure of the reaction.
DFT calculations suggest that the interaction of two gold cations with the anion is essential and makes the formation of digold hydroxide and digold acetonyl complexes thermodynamically feasible. They also show that the monogold acetonyl complexes are prone to protodeauration with hydroxonium (or other protonated ions) in solution, whereas the cationic digold acetonyl complexes should be much more stable. The suggested reaction mechanism of the C–H activation reaction involves a dimer of gold complexes bound via the gold–gold interaction.
Experimental
Preparation of [(L)AuX]
Solutions of [(L)AuCl] with AgX in THF or dioxane (only for L = IPr) were sonicated for 10 minutes. The AgCl precipitate was filtered off. The details of the reaction mixture preparations are in the figure captions and in the ESI.† We use a convention that lists v/v amount of water in the reaction mixture before it is “isotopically labelled” (e.g. before CD3COCD3 is added with a time delay). We were looking at relative changes with increasing amount of water and slight variations in the preparations of the reaction mixtures did not influence the results.ESI-MS experiments
The spectra were acquired with a triple quadrupole mass spectrometer TSQ 7000 or a linear ion trap instrument LTQ, both equipped with an electrospray ionization source.41 Only a simple mode of the mass spectra acquisition was used here. The results are reproducible irrespective of the mass spectrometer used.Ion spectroscopy
IRPD spectra measurements were conducted with the ISORI (Ion Spectroscopy Of Reaction Intermediates) instrument based on the TSQ 7000 platform.42 The ionization and mass-selection is performed in the very same way as for the classical experiments with TSQ 7000. Mass-selected ions are then trapped with helium buffer gas in a wire quadrupole trap operating at 3 K. The ions relax in collisions with helium and attach a helium atom. Helium complexes are then used for the determination of the absorption of IR photons (from a Nd:YAG-pumped IR optical parametric oscillator/amplifier). The absorption leads to the helium detachment and therefore can be monitored as a mass change. The number of helium complexes with (Ni) and without (Ni0) laser irradiation is counted using a Daly-type detector. The IRPD spectra are constructed as (1 − Ni/Ni0). More details can be found in ref. 43 and 44.Density functional theory calculations
The calculations were performed with the M06-D3![[thin space (1/6-em)]](https://www.rsc.org/images/entities/char_2009.gif) 45,46 density functional theory method with the SDD basis set for gold and the 6-311+G* basis set for the remaining atoms using Gaussian 09 package.47 The solvent effect was modelled by the SMD method.48 The H3O+ cation was always considered as the [H2O–H+–OH2] dimer. All minima and transition structures were verified by the frequency calculation and the energies refer to enthalpies at 298 K including free solvation energy. The theoretical IR spectra were calculated at the B3LYP-D344,49–51 level with the same basis set in the gas phase. The scaling factor is 0.975.52
45,46 density functional theory method with the SDD basis set for gold and the 6-311+G* basis set for the remaining atoms using Gaussian 09 package.47 The solvent effect was modelled by the SMD method.48 The H3O+ cation was always considered as the [H2O–H+–OH2] dimer. All minima and transition structures were verified by the frequency calculation and the energies refer to enthalpies at 298 K including free solvation energy. The theoretical IR spectra were calculated at the B3LYP-D344,49–51 level with the same basis set in the gas phase. The scaling factor is 0.975.52
Conflicts of interest
There are no conflicts to declare.Acknowledgements
The project was supported by the European Research Council (ERC CoG No. 682275). The authors thank Prof. Steven P. Nolan for donating the [(IPr)2Au2OH]BF4 salt which led to the whole study. We further thank Dr. Thibault Terencio for preliminary theoretical calculations and Dr. Jiří Váňa for valuable discussion of the results.Notes and references
- S. K. Hashmi, Top. Organomet. Chem., 2013, 44, 143 CrossRef.
- M. Asiri and A. S. K. Hashmi, Chem. Soc. Rev., 2016, 45, 4471 RSC.
- W. W. Zi and F. D. Toste, Chem. Soc. Rev., 2016, 45, 4567 RSC.
- Z. T. Zheng, Z. X. Wang, Y. L. Wang and L. M. Zhang, Chem. Soc. Rev., 2016, 45, 4448 RSC.
- Homogeneous Gold Catalysis, Book Series: Topics in Current Chemistry-Series, ed. L. M. Slaughter, Springer, vol. 357, 2015 Search PubMed.
- L. Jašíková and J. Roithová, Organometallics, 2012, 31, 1935 CrossRef.
- L. Jašíková and J. Roithová, Organometallics, 2013, 32, 7023 CrossRef.
- D. J. Gorin and F. D. Toste, Nature, 2007, 446, 395 CrossRef CAS PubMed.
- R. E. M. Brooner and R. A. Widenhoefer, Angew. Chem., Int. Ed., 2013, 52, 11714 CrossRef CAS PubMed.
- A. S. K. Hashmi, M. Wieteck, I. Braun, P. Nösel, L. Jongbloed, M. Rudolph and F. Rominger, Adv. Synth. Catal., 2012, 354, 555 CrossRef CAS.
- S. P. Nolan, Acc. Chem. Res., 2011, 44, 91 CrossRef CAS PubMed.
- L. Jašíková, M. Anania, S. Hybelbauerová and J. Roithová, J. Am. Chem. Soc., 2015, 137, 13647 CrossRef PubMed.
- A. S. K. Hashmi, Acc. Chem. Res., 2014, 47, 864 CrossRef CAS PubMed.
- M. Wieteck, Y. Tokimizu, M. Rudolph, F. Rominger, H. Ohno, N. Fujii and A. S. K. Hashmi, Chem. – Eur. J., 2014, 20, 16331 CrossRef CAS PubMed.
- J. Roithová, Š. Janková, L. Jašíková, J. Váňa and S. Hybelbauerová, Angew. Chem., Int. Ed., 2012, 51, 8378 CrossRef PubMed.
- A. Gómez-Suárez, Y. Oonishi, A. R. Martin, S. V. C. Vummaleti, D. J. Nelson, D. B. Cordes, A. M. Z. Slawin, L. Cavallo, S. P. Nolan and A. Poater, Chem. – Eur. J., 2016, 22, 1125 CrossRef PubMed.
- A. Zhdanko and M. E. Maier, Chem. – Eur. J., 2014, 20, 1918 CrossRef CAS PubMed.
- M. M. Hansmann, R. Matthias, F. Rominger and A. S. K. Hashmi, Angew. Chem., Int. Ed., 2013, 52, 2593 CrossRef CAS PubMed.
- V. Vreeken, D. L. J. Broere, A. C. H. Jans, M. Lankelma, J. N. H. Reek, M. A. Siegler and J. I. van der Vlugt, Angew. Chem., Int. Ed., 2016, 55, 10042 CrossRef CAS PubMed.
- S. Tsupova, M. M. Hansmann, M. Rudolph, F. Rominger and A. S. K. Hashmi, Chem. – Eur. J., 2016, 22, 16286 CrossRef CAS PubMed.
- T. J. Brown, D. Weber, M. R. Gagné and R. A. Widenhoefer, J. Am. Chem. Soc., 2012, 134, 9134 CrossRef CAS PubMed.
- È. Casals-Cruañas, O. F. González-Belman, P. Besalú-Sala, D. J. Nelson and A. Poater, Org. Biomol. Chem., 2017, 15, 6416 Search PubMed.
- J. Schulz, J. Jašík, A. Gray and J. Roithová, Chem. – Eur. J., 2016, 22, 9827 CrossRef CAS PubMed.
- D. Gasperini, A. Collado, A. Goméz-Suárez, D. B. Cordes, A. M. Z. Slawin and S. P. Nolan, Chem. – Eur. J., 2015, 21, 5403 CrossRef CAS PubMed.
- X. L. Pei, Y. Yang, Z. Lei, S. S. Chang, Z. J. Guan, X. K. Wan, T. B. Wen and Q. M. Wang, J. Am. Chem. Soc., 2015, 137, 5520 CrossRef CAS PubMed.
- M. Gatto, P. Belanzoni, L. Belpassi, L. Biasiolo, A. Del Zotto, F. Tarantelli and D. Zuccaccia, ACS Catal., 2016, 6, 7363 CrossRef CAS.
- A. B. Gade and N. T. Patil, Org. Lett., 2016, 18, 1844 CrossRef CAS PubMed.
- J. Roithová, A. Gray, E. Andris, J. Jašík and D. Gerlich, Acc. Chem. Res., 2016, 49, 223 CrossRef PubMed.
- E. Stokvis, H. Rosing and J. H. Beijnen, Rapid Commun. Mass Spectrom., 2005, 19, 401 CrossRef CAS PubMed.
- D. Schröder, M. Semialjac and H. Schwarz, Int. J. Mass Spectrom., 2004, 233, 103 CrossRef.
- (a) G. H. Mayfield and W. E. Bull, J. Chem. Soc. A, 1971, 93, 2279 RSC; (b) A. Macchioni, Chem. Rev., 2005, 105, 1917 CrossRef PubMed; (c) L. Biasiolo, A. Del Zotto and D. Zuccaccia, Organometallics, 2015, 34, 1759 CrossRef CAS; (d) W. Beck and K. Suenkel, Chem. Rev., 1988, 88, 1405 CrossRef CAS; (e) I. Krossing and I. Raabe, Angew. Chem., Int. Ed., 2004, 43, 2066 CrossRef CAS PubMed; (f) A. T. Engesser, M. R. Lichtenthaler, M. Schleep and I. Krossing, Chem. Soc. Rev., 2016, 45, 789 RSC.
- (a) A. M. Trinchillo, P. Belanzoni, L. Belpassi, L. Biasiolo, V. Busico, A. D'Amora, L. D'Amore, A. Del Zotto, F. Tarantelli, A. Tuzi and D. Zuccaccia, Organometallics, 2016, 35, 641 CrossRef and references therein. (b) L. Biasiolo, G. Ciancaleoni, L. Belpassi, G. Bistoni, A. Macchioni, F. Tarantelli and D. Zuccaccia, Catal. Sci. Technol., 2015, 5, 1558 RSC; (c) G. Kovács, G. Ujaque and A. Lledós, J. Am. Chem. Soc., 2008, 130, 853 CrossRef PubMed.
- K. Seppelt, Angew. Chem., Int. Ed. Engl., 1993, 32, 1025 CrossRef.
- M. Jia and M. Bandini, ACS Catal., 2015, 5, 1638 CrossRef CAS.
- A. Kütt, T. Rodima, J. Saame, E. Raamat, V. Mäemets, I. Kaljurand, I. A. Koppel, R. Y. Garlyauskayte, Y. L. Yagupolskii, L. M. Yagupolskii, E. Bernhardt, H. Willner and I. Leito, J. Org. Chem., 2011, 76, 391 CrossRef PubMed.
- A. P. Kelly, C. J. Cramer and D. G. Truhlar, J. Phys. Chem. B, 2006, 110, 16066 CrossRef PubMed.
- F. Mendizabal and P. Pyykko, Phys. Chem. Chem. Phys., 2004, 6, 900 RSC.
- H. Schmidbaur and A. Schier, Chem. Soc. Rev., 2012, 41, 370 RSC.
- S. Cucinotta, A. Ruini, A. Catellani and A. Stirling, ChemPhysChem, 2006, 7, 1229 CrossRef PubMed.
- H. Clavier and S. P. Nolan, Chem. Commun., 2010, 46, 841 RSC.
- L. Ducháčková and J. Roithová, Chem. – Eur. J., 2009, 15, 13399 CrossRef PubMed.
- J. Jašík, J. Žabka, J. Roithová and D. Gerlich, Int. J. Mass Spectrom., 2013, 354–355, 204 CrossRef.
- D. Gerlich, J. Jašík, E. Andris, R. Navrátil and J. Roithová, ChemPhysChem, 2016, 17, 3723 CrossRef CAS PubMed.
- J. Jašík, D. Gerlich and J. Roithová, J. Phys. Chem. A, 2015, 119, 2532 CrossRef PubMed.
- Y. Zhao and D. G. Truhlar, Theor. Chem. Acc., 2008, 120, 215 CrossRef CAS.
- S. Grimme, J. Antony, S. Ehrlich and H. Krieg, J. Chem. Phys., 2010, 132, 154104 CrossRef PubMed.
- M. J. Frisch, et al., Gaussian 09, Revision D.01, Gaussian, Inc., Wallingford CT, 2013 Search PubMed.
- A. V. Marenich, C. J. Cramer and D. G. Truhlar, J. Phys. Chem. B, 2009, 113, 6378 CrossRef CAS PubMed.
- D. Becke, J. Chem. Phys., 1993, 98, 5648 CrossRef.
- C. Lee, W. Yang and R. G. Parr, Phys. Rev. B: Condens. Matter, 1988, 37, 785 CrossRef CAS.
- P. J. Stephens, F. J. Devlin, C. F. Chabalowski and M. J. Frisch, J. Phys. Chem., 1994, 98, 11623 CrossRef CAS.
- A. P. Scott and L. Radom, J. Phys. Chem., 1996, 100, 16502 CrossRef CAS.
Footnote |
| † Electronic supplementary information (ESI) available: Preparation of reaction mixtures; photodissociation theoretical IR spectra of gold complexes; details of the determination of kinetic isotope effects; data of the delayed reactant labelling experiments; ESI-MS spectra of reaction mixtures and the collision induced dissociation spectra of gold complexes; results of DFT calculations. See DOI: 10.1039/c7ob01905j |
| This journal is © The Royal Society of Chemistry 2017 |

