 Open Access Article
Creative Commons Attribution 3.0 Unported Licence
Large-scale immuno-magnetic cell sorting of T cells based on a self-designed high-throughput system for potential clinical application
Qian
Zhang†
a,
Ting
Yin†
a,
Rongrong
Xu
b,
Wenjun
Gao
c,
Hui
Zhao
c,
Joseph G.
Shapter
 d,
Kan
Wang
a,
Yulan
Shen
e,
Peng
Huang
a,
Guo
Gao
 *a,
Yanfeng
Wu
*b and
Daxiang
Cui
 *a
*a
aInstitute of Nano Biomedicine and Engineering, Shanghai Engineering Research Center for Intelligent diagnosis and treatment instrument, Department of Instrument Science and Engineering, School of Electronic Information and Electrical Engineering, Shanghai Jiao Tong University, 800 Dongchuan Rd, Shanghai 200240, China. E-mail: guogao@sjtu.edu.cn; dxcui@sjtu.edu.cn; Fax: +86-21-34206886; Tel: +86-21-34206886
bNational Key Laboratory of Medical Immunology, Institute of Immunology, Second Military Medical University, Shanghai 200433, China. E-mail: wuyf@immunol.org; Tel: +86-21-55620605
cDepartment of Instrument Science and Engineering, School of Electronic Information and Electrical Engineering, Shanghai Jiao Tong University, 800 Dongchuan Rd, Shanghai 200240, China
dSchool of Chemical and Physical Sciences, Flinders University, Bedford Park, Adelaide 5042, Australia
eDepartment of Radiology, Shanghai Jiao Tong University Affiliated Sixth People's Hospital, Shanghai JiaoTong University, Shanghai, 200240, China
First published on 23rd August 2017
Abstract
In this contribution, we designed four types of immuno-magnetic nanoparticles for separation of different T cells (CD3+, CD4+, CD8+ and CD14+ T cells), and we established a new large-scale immuno-magnetic cell sorting procedure to achieve an enrichment of particular T cells using our designed auto-IMACS device. This device could achieve recyclable large-scale cell sorting, for which the throughput of the system reached ∼4000 mL and the maximum cell capacity was 4 × 10¹⁰. The collected cells were analyzed by flow cytometry and visual cytology data, and the effective selection rates of CD3+, CD4+, CD8+ and CD14+ T cells were 79.3%, 74.1%, 57.1% and 67.9%, respectively. The sorted CD8+ T cells still retained good cytotoxic activity against specific cells. In addition, the sorted T cells can also be further incubated in vitro and proliferated, and even could be infused back into patients for immunotherapy in the near future.
1. Introduction
T cells, also called T lymphocytes, play a critical role in cellular immunity.1–3 During immunological processes, they can be helper cells (e.g., CD4+ T cells) to assist with other white blood cells for maturation of B cells or activation of macrophages and cytotoxic T cells.4 They can also be killer cells (e.g., CD8+ T cells) for destroying tumor cells or virus-infected cells.5 However, the rarity of T cells from human blood, particularly from patients, indicates an urgent need for generation of a method for their separation and proliferation in vitro.6,7In recent decades, immuno-magnetic activated cell sorting (IMACS) has emerged to be an outstanding strategy for separation and enrichment of cells of interest from a mixed cell population.8,9 This strategy utilizes magnetic nano-/micro-beads (or particles) labeled with antibodies specific to the receptors on the cell membrane of interest.10–12 Under the external magnetic field, the immuno-magnetic particles capture targeted cells stored in the magnetized column, resulting in the removal of unbound cells. Further flushing steps lead to the enrichment of targeted cells in the absence of magnetic field.13,14 This strategy has excellent specificity and separation efficiency, and some commercial products (such as CliniMACS®, Dynabeads®, MagniSort™ and Polyglobin N®) based on IMACS have been applied for different types of cells, including T cells,15 B cells,16 NK cells, macrophages and tumor cells.17 However, while these products are commonly used for basic research with separation of small amount of cells, their high cost limits their clinical applications for large number of cells.
Herein, in order to obtain large-scale collection of cells of interest, we developed an in vitro cellular approach to separate different types of T cells (CD3+, CD4+, CD8+ and CD14+ T cells) using a self-designed high-throughput system based on IMACS. In this study, immuno-magnetic nanoparticles (IMNPs) were fabricated, which could perfectly fit in the magnetic separation column in our designed auto-IMACS device. According to the immuno-magnetic cell sorting procedure, the targeted T cells (CD3+, CD4+, CD8+ and CD14+ T cells) could be collected in turn and enriched for further proliferation in cell culture. Scheme 1 shows that this large immuno-magnetic cell sorting system could be an effective part of a entire cyclic procedure from drawing blood, targeted T cell sorting, cell proliferation to infusion back into the patient. Such a process would have vast application prospects in clinical medicine.
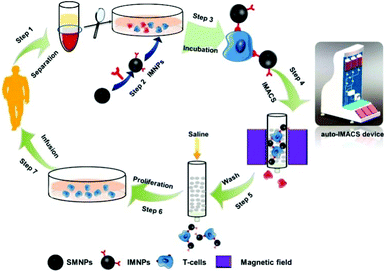 | ||
| Scheme 1 Schematic of large-scale immuno-magnetic cell sorting based on our self-designed high-throughput system. | ||
2. Experimental
2.1. Chemicals and materials
Ferrous chloride (FeCl2·4H2O), ferric chloride (FeCl3·6H2O), acrylic acid (98%), oleic acid (OLA, 90%), ammonium hydroxide, perchloric acid, hexane (98%), ethanol, cyclohexane, styrene, dialysis tube, sodium dodecylsulfate (SDS), sodium bicarbonate and potassium persulfate (KPS) were purchased from Sinopharm Chemical Reagent Co., Ltd. Bovine serum albumin (BSA, 96%) and N-(3-dimethylaminopropyl)-N′-ethylcarbodiimide hydrochloride (EDC) were obtained from Sigma-Aldrich. Centrifuge filters were obtained from Millipore Corporation. The monoclonal antibodies (mAb-CD3, mAb-CD4, mAb-CD8 and mAb-CD13) were supplied by Sinocelltech Ltd, China. T2 cell line (TAP-deficient, HLA-A2.1+), human colorectal adenocarcinoma cell lines SW620 (CEA+, HLA-A2.1+) and SK-BR3 (CEA−, HLA-A2.1+) were obtained from ATCC (American Type Culture Collection, Manassas, VA) and cultured according to the ATCC instructions. CAP-1 (CEA605–613, YLSGANLNL) peptide was synthesized at GL Biochem Ltd (Shanghai, China) and analyzed to be of >95% purity by reversed-phase HPLC, as confirmed by mass spectrometry. PE-Cy5 and PE were ordered from BD, USA. All the chemicals were used directly without further purification.2.2. Synthesis of superparamagnetic nanoparticles (SMNPs)
Monodisperse SMNPs were synthesized through facile coprecipitation of ferrous and ferric salt solutions and further coated with polystyrene.18–21 Briefly, a mixed solution of Fe3+/Fe2+ (molar ratio, 1.2/1) was first dissolved in 50 mL of Milliq-water, under magnetic stirring. Then, 40 mL of ammonium hydroxide solution was rapidly added into the solution and heated at 70 °C for 0.5 h, and the obtained black product was washed with Milliq-water and perchloric acid (18%, v/v), sequentially, and further dialyzed using dialysis tubes (Mw: 8 k–14 kDa) to remove excess acid. Following this, oleic acid in water (16%, w/v) was added into the black product and kept stirring for 1 h at 70 °C; then, excess oleic acid was rinsed with ethanol, and the oleic acid-coated Fe3O4 seeds were suspended in hexane for further use.In the next step, the oleic acid-modified Fe3O4 seeds were dispersed into a mix solution (0.1 g of cyclohexane and 1 mL of styrene) to form an oil phase under ultrasound for several seconds; SDS (0.277 mmol) and sodium bicarbonate (0.095 mmol) were dissolved in 30 mL of Milliq-water to form a water phase. Then, the oil phase and water phase were mixed together in an ice-cooled bath to form miniemulsion under ultrasound for 10 min. The KPS solution (0.11 M, 0.5 mL) was then added to the mixture and kept stirring overnight at 70 °C, and the polystyrene-coated Fe3O4 nanoparticles were obtained. The final product (SMNPs, dc ∼ 710 nm) was centrifuged for 2 h and kept in Milliq-water for further use.
2.3. Fabrication of immuno-magnetic nanoparticles (IMNPs)
The obtained SMNPs were functionalized with different types of monoclonal antibodies (mAb-CD3, mAb-CD4, mAb-CD8 and mAb-CD14) to obtain the corresponding immuno-magnetic nanoparticles (IMNPs-CD3, IMNPs-CD4, IMNPs-CD8 and IMNPs-CD14), respectively. The fabrication method of four types of IMNPs was acquired according to the covalent coupling by EDC chemistry using a similar process.22 Briefly, SMNPs (0.16 nM, 8 mg mL−1, 250 μL) were first washed with MES buffer (10 mM, pH 6.0), and then the mixture of EDC and NHS solution (10 mg mL−1, 200 μL) was added at 37 °C for activation. After 20 min, mAb (1 mg mL−1, 100 μL) was added for another 3 h to obtain the conjugation. Then, the magnetic separation rack was applied to remove the excess mAb solution, and the remaining sample was then dispersed into the PBST solution (KCl, 2.7 mmol L−1, Na2HPO4, 8.1 mmol L−1, KH2PO4, 1.5 mmol L−1, 1% BSA, 0.05% Tween 20) overnight at 4 °C. During this period, the BSA molecules were used for blocking the particle surface to avoid the nonspecific capture of cells.23 Finally, the obtained IMNPs were rinsed twice with fresh PBST solution and dispersed into the PBST solution (0.5% BSA) for further use. The entire process was carried out under aseptic conditions and the solution was sterilized using a syringe filter (Millipore, 0.22 μm, sterile).2.4. Characterization
Transmission electron microscopy (TEM) images were obtained using JEM-2100F (Japan) to observe the morphology of SMNPs. Scanning electron microscopy (SEM) images were recorded using a JEOL JSM-7800F Prime (China) system. UV–Vis spectra of SMNPs and IMNPs were recorded using a UV–Vis spectrophotometer (Varian Inc., USA). M–H curves of SMNPs and IMNPs at 300 K were analyzed using a Physical Property Measurement System (PPMS-9 T, USA) with a 3 T magnetic field.2.5. Biocompatibility study of IMNPs based on MGC-803 cell lines
As the typical cell model, a MGC-803 cell line was applied for biocompatibility studies of IMNPs using resazurin assay in this experiment.24,25 Briefly, 100 μL of cell medium (medium contained DMEM supplemented with 10% FBS, 0.1 mg mL−1 streptomycin and 100 U mL−1 penicillin) was seeded into 96-well plates at a cell density of 1 × 10⁵ mL−1. The cells were cultured overnight at 37 °C (5% CO2). The next day, the cell medium was replaced with a fresh medium containing various concentrations of IMNPs and incubated for 24 h. Afresh medium without IMNPs was considered to be the control group. Then, the cell medium was removed by rinsing with PBS twice, and 100 μL of fresh medium containing 10% resazurin (In Vitro Toxicology Assay Kit, Sigma-Aldrich) was added and cultured for another 4 h. Finally, the fluorescence intensity (λex: 560 nm, λem: 587 nm) was recorded by ELISA (Tecan, Switzerland), and the cell viability was analyzed using the following equation: cell viability = (I587 nm of adding IMNPs)/(I587 nm of control) × 100%. Herein, higher cell viabilities mean that IMNPs have good biocompatibility, which is safer for the cells.2.6. Development of auto-IMACS device
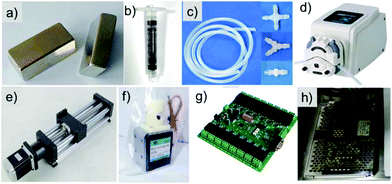
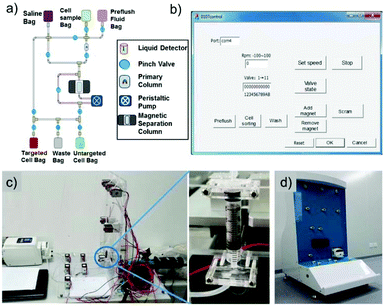
The automatic immune magnetic cell sorting device (auto-IMACS device) was designed and developed for large-scale immune magnetic cell sorting so that it could be applied for clinical medical applications.26 The auto-IMACS device consists of five parts: magnetic separation unit, computer control unit, sample transport unit, control software system and equipment shell. As the core component of the device, the magnetic separation unit includes a magnetic separation column, a NdFeB magnet and a motor module. The computer control unit contains the control circuit and regulated power supply, which supplies enough power for the entire system. The sample transport unit was designed with a waterfall approach, in which the initial sample is infused from the top of the system and the targeted sample, as well as the waste, is collected from the bottom of the system. This unit is all connected by sterile medical silicone tubing controlling the switch by a pinch valve and regulating the sample flow rate by a peristaltic pump. The control software system is programmed based on the auto-IMACS device and controls the movement of the NdFeB magnet for the specific collection of targeted samples. Equipment shell has a unitized configuration design to contain all the equipment inside, and it has a USB interface to connect the device with the PC.2.7. Clinical magnetic activated cell sorting based on IMNPs
Fresh blood measuring 50 mL was obtained from a blood donor and was first pretreated by the lymphocyte separation medium (Cedarlane Laboratories, Canada) to separate the red blood cells.27 The protocol for clinical magnetic cell sorting of CD3+, CD4+, CD8+ and CD14+ T cells based on their corresponding IMNPs is as follows: briefly, four types of IMNPs (0.05 nM, 30 μL) were added separately into 15 mL centrifuge tubes, and 160 μL of the prepared cell suspension (1.25 × 10⁸ cells per mL) was incubated for 15 min at 4 °C. During this time, the mixture was patted twice to ensure that IMNPs could completely interact with positive cells. Then, 10 mL of saline was added into the tubes. This mixture was centrifuged for 5 min at a speed of 1500 rpm. The supernatant was discarded and the collected pellet was re-dissolved in 1 mL of saline.All the pipes, tubing and cell separation column in the auto-IMACS device were cleaned with abundant medicinal alcohol and saline before use. Under the external magnetic field, the re-dissolved suspension was pumped into the injection port at a speed of 1 mL min−1. The IMNPs were magnetized, and their captured targeted cells were stored in the cell separation column. Then, a small amount of saline was pumped into the column to remove the unbound cells. Then, in the absence of an external magnetic field, 5 mL of saline was pumped into the cell separation column with a flushing fluid of 5–10 rpm, and the targeted cells were rinsed and collected in the plates. All the experiments were carried out under sterile conditions.
2.8. Targeted T cell analysis by flow cytometry (FCM)
For flow cytometry, 50 μL of four groups of collected cells (e.g., IMNPs-CD3, IMNPs-CD4, IMNPs-CD8 and IMNPs-CD14) was concentrated by centrifugation, and incubated with 5 μL of specific fluorescent Ab (PE-Cy5 for IMNPs-CD3 and IMNPs-CD4, PE for IMNPs-CD8 and IMNPs-CD14) for 20 min. Saline measuring 500 μL was added separately into the cell solution, which was followed by centrifugation (5000 rpm, 5 min). The supernatant was removed. The collected cells at the bottom were dispersed into 300 μL of saline. Finally, the effective separation rate was analyzed by counting 1.2 × 10⁴ cells per sample using flow cytometry (LSR II flow cytometer (BD, CA) and CellQuest software (BD) or FlowJo Software). The visual cytology data were recorded by counting the cell numbers using optical microscopy.2.9. In vitro CTL induction and specific lysis study based on the sorted CD8+ T cells
Cytotoxic T lymphocytes (CTLs) were inducted following a previous protocol.28 Specifically, peripheral blood mononuclear cells (PBMCs) were isolated from healthy donors by Ficoll/Hypaque (Sigma, St Louis, MO) density gradient centrifugation. The obtained PBMCs were seeded into 6-well plates at a density of 1 × 10⁷ cells per well and cultured in RPMI1640 medium supplemented with 10% FCS at 37 °C (5% CO2). After incubation for 2 h, non-adherent cells (effector lymphocytes) were removed and the resultant adherent cells containing dendritic cells (DCs) were cultured in RPMI1640 medium supplemented with 10% FCS, 500 U mL−1 rhGM-CSF and 10 ng mL−1 rhIL-4. During this time, half of the medium was replaced with a fresh medium and 20 U mL−1 rhIL-2 was supplemented every 2 days. The obtained cells were harvested at day 6 and transferred into 24-well plates at a density of 2 × 10⁵ cells per well for stimulation in presence of 10 μg mL−1 CEA protein and CAP-1, respectively. The PBS solution was added for negative control. All the cells were collected after 4 h and washed twice by centrifugation in order to remove excess stimulant.CD8+ T cells sorted by the self-designed high-throughput system were incubated with RPMI1640 medium supplemented with 10% FCS at a density of 4 × 10⁶ cells per mL; then, CD8+ T cells were cultured together with autologous DCs for stimulation (number ratio is 10![[thin space (1/6-em)]](https://www.rsc.org/images/entities/char_2009.gif) :
:![[thin space (1/6-em)]](https://www.rsc.org/images/entities/char_2009.gif) 1) at 37 °C (5% CO2), 20 U mL−1 rhIL-2 was supplemented at day 5, and all the cells were collected at day 7. CD8+ T cells were restimulated each week using the same method. After the third round of restimulation, the CD8+ T cells as effector cells were harvested and incubated with different types of targeted cells. According to different surface expressions of the cells, targeted cells were divided into four groups: SW620 (CEA+, HLA-A*0201+), SK-BR3 (CEA−, HLA-A*0201+), T2 cells pulsed CAP-1 and T2 cells. Various ratios of effector cells to targeted cells (E/T ratio) were selected to analyze the specific lysis capability. Finally, the lysis was determined by measuring the OD value at 490 nm using a microplate reader (Biotek, USA), and the specific lysis was determined using the formula: specific lysis (%) = (experimental release − T cells release − spontaneous release)/(maximum release − spontaneous release) × 100%.
1) at 37 °C (5% CO2), 20 U mL−1 rhIL-2 was supplemented at day 5, and all the cells were collected at day 7. CD8+ T cells were restimulated each week using the same method. After the third round of restimulation, the CD8+ T cells as effector cells were harvested and incubated with different types of targeted cells. According to different surface expressions of the cells, targeted cells were divided into four groups: SW620 (CEA+, HLA-A*0201+), SK-BR3 (CEA−, HLA-A*0201+), T2 cells pulsed CAP-1 and T2 cells. Various ratios of effector cells to targeted cells (E/T ratio) were selected to analyze the specific lysis capability. Finally, the lysis was determined by measuring the OD value at 490 nm using a microplate reader (Biotek, USA), and the specific lysis was determined using the formula: specific lysis (%) = (experimental release − T cells release − spontaneous release)/(maximum release − spontaneous release) × 100%.
3. Results and discussion
3.1. Synthesis and characterization of IMNPs
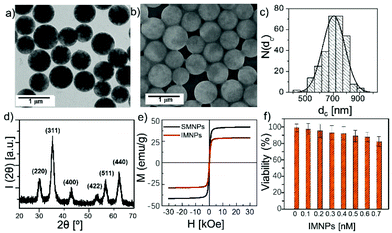
The characterization of IMNPs is shown in Fig. 1. The polystyrene-coated SMNPs synthesized through facile coprecipitation of ferrous and ferric salt solutions show a spherical structure and uniform size as shown in the TEM image (Fig. 1a). The fabricated IMNPs were well dispersed into MilliQ-water without agglomeration, and the diameter was determined to be 710.3 ± 14 nm using the ImageJ software (Fig. 1b and c). The XRD pattern shown in Fig. 1d verified that SMNPs used in this experiment were Fe3O4 NPs.The physico-chemical properties of IMNPs were investigated by measurement of magnetization loops at 300 K using the SQUID equipment (Fig. 1e). The magnetization loops of SMNPs and IMNPs based on different magnetic fields show smooth curves without hysteresis, which means that both of them present superparamagnetic behaviors. The saturated magnetization values (Ms) can reach 41.4 emu g−1 and 29.8 emu g−1, respectively. The superparamagnetic behavior of IMNPs is a key point in this study, indicating that the IMNPs will exhibit magnetic behavior and get trapped by a strong external magnetic field, while the magnetic behavior will disappear immediately after removing the strong external magnetic field. In this case, the IMNPs after capturing the targeted cells can be easily stored in the cell separation column with the combined effect of magnetic beads and strong external magnetic field. Then, they can be rinsed again to be further cultured in the absence of the magnetic field.
UV–Vis spectra of four types of fabricated IMNPs based on different monoclonal antibodies were studied, and the results are displayed in Fig. 2. After modification with mAb and BSA molecules on the surface of SMNPs, the functionalized IMNPs (including IMNPs-CD3, IMNPs-CD4, IMNPs-CD8 and IMNPs-CD14) showed a small absorption peak at 275 nm, which was not present for SMNPs. The mAb molecule could specifically target the receptors on the surface of T cells, and the BSA molecule was applied for blocking the residual surface of the particle to avoid nonspecific targeting. In addition, the hydrodynamic size d(h) and the zeta potential value ζ of SMNPs and IMNPs are shown in Table 1.
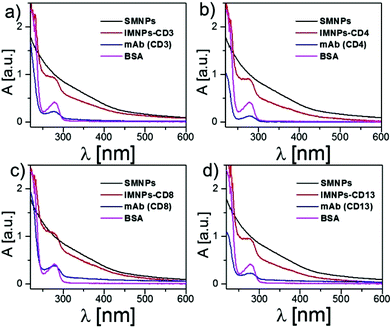 | ||
| Fig. 2 UV–Vis spectra of SMNPs, IMNPs, mAb and free BSA, respectively. (a) IMNPs-CD3, (b) IMNPs-CD4, (c) IMNPs-CD8 and (d) IMNPs-CD14. | ||
| Sample | d (h) [nm] | ζ [mV] |
|---|---|---|
| SMNPs | 785 ± 25 | −17.2 ± 1.8 |
| IMNPs-CD3 | 850 ± 67 | −19.5 ± 2.2 |
| IMNPs-CD4 | 843 ± 30 | −20.2 ± 1.4 |
| IMNPs-CD8 | 875 ± 21 | −16.9 ± 2.1 |
| IMNPs-CD14 | 796 ± 27 | −22.0 ± 2.6 |
In order to study the biocompatibility between IMNPs and cells, cytotoxicity tests of IMNPs based on the viability of MGC-803 cell lines were carried out via resazurin assay at concentrations of IMNPs from 0.1 nM to 0.7 nM. From Fig. 1f, we can see that after incubation of the cells with IMNPs for 24 h, they still retained a high cell viability (>80%), which indicates that IMNPs have good biocompatibility and low toxicity toward cells.
3.2. Development of auto-IMACS device
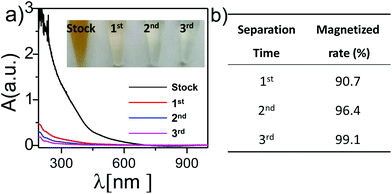
Large-scale immuno-magnetic cell sorting was achieved by separation of targeted cells based on IMNPs using a home-made auto-IMACS device, which comprised several basic parts (cf.Fig. 3). This device is an integrated system for sample transport, magnetic separation, PC control and control software, with numerous parameter design functions. This device has the potential for extensive application in the clinic medicine for large-scale immuno-magnetic cell sorting (image of the device with its inner structure and controlled software interface is shown in Fig. 4). The auto-IMACS device uses a top-down design methodology in which the sample bags (including saline bag, cell sample bag and preflush fluid bag) are on the top, and collection bags (including targeted cell bag, untargeted cell bag and waste bag) are at the bottom (cf.Fig. 4a). The samples are pumped into the magnetic separation column, and the targeted cell separation is driven by a strong external magnet. Then, the targeted cells are rinsed in the absence of an external magnetic field for further proliferation at 37 °C (5% CO2). In this sealed sterile device, the total length of pipes is about 5 m to ensure enough sample capacity, and cycle immuno-magnetic cell sorting can be obtained by continually pumping cells, sorting the cells and rinsing using the auto-IMACS device to achieve large-scale cell collection.Next, we investigated the magnetized efficiency of IMNPs in the magnetic separation column to study the matches between IMNPs and auto-IMACS device (cf.Fig. 5). Briefly, under an external magnetic field, 1 mL of IMNPs (0.2 nM) dispersed into saline was pumped into the separation column (fluid speed: 0.1 mL min−1). With the effect of external magnetic field, the magnetization of steel balls in the separation column was amplified resulting in almost all of the IMNPs being kept in the column. Un-magnetized IMNPs rinsed with saline were pumped into the column again until this step was repeated 3 times. The rinsed solution was collected and analyzed using a UV–Vis spectrophotometer. From Fig. 5a, we can see that the stock IMNPs solution exhibited a brown color, and there were distinct peaks at 450 nm in the UV–Vis spectra; thereby, we identified that λ450 is the specific absorption peak of magnetic nanoparticles. After going through the first separation, the brown color from the solution almost disappeared with a significant decrease in absorption at 450 nm in the UV–Vis spectra. This means that almost all the IMNPs were magnetized in the separation column during the first separation and the magnetized rate reached 90.7% (cf.Fig. 5b). Moreover, there was a small amount of IMNPs left from the washout solution and the magnetized rate from the second and third separations was 96.4% and 99.4%, respectively. Therefore, the IMNPs fit well with the auto-IMACS device, which could be used for immuno-magnetic cell sorting.
3.3. Clinical magnetic cell sorting based on IMNPs
The cell collection rate and positive separation rate through auto-MACS device were analyzed to investigate any cell damage and determine the ratio of targeted T cells to the total T cells in the blood after the application of the magnetic cell sorting process. When the cells were passing through the separation column, the pressure between the magnetic beads could break the cells to decrease the cell viability, resulting in depletion of T cells. The visual cytology data recorded by optical microscopy is shown in Table 2, where the total collected cell rate (rc), the positive separation cell rate (rp) and the number of negative separated cells are discussed. The total cell number means all collected cells after magnetic sorting. Table 2 shows that the total collected cell rate from all four groups reached 70%, which already decreased the cell depletion to the maximum extent during the cell sorting. This result is also quite similar to the existing techniques from the previous study.29 Besides, the positive separation rate indicated the sorted cells rate bonded in the separation column by IMNPs according to the monoclonal antibodies. The low positive separation rate highlighted the rare amount of targeted T cells in the blood reinforcing the significant necessity for cell separation and proliferation in this study. Negative separated cells means the unbounded cells, which were rinsed out from the column directly. The high rate also reflects the low concentration of targeted cells in the blood.| Groups | IMNPs-CD3 | IMNPs-CD4 | IMNPs-CD8 | IMNPs-CD14 |
|---|---|---|---|---|
| Total cell no. before separation N(t) | 2 × 10⁷ | 2 × 10⁷ | 2 × 10⁷ | 2 × 10⁷ |
| No. cells of negative separation N(n) | 1.1 × 10⁷ | 1.3 × 10⁷ | 1.34 × 10⁷ | 1.41 × 10⁷ |
| No. cells of positive separation N(p) | 3.51 × 10⁶ | 2.26 × 10⁶ | 1.64 × 10⁶ | 1.92 × 10⁶ |
| Total cells no. after separation N(a) = N(n) + N(p) | 1.45 × 10⁷ | 1.5 × 10⁷ | 1.5 × 10⁷ | 1.6 × 10⁷ |
| Positive separation rate r(p) = N(p)/N(t) × 100% | 17.5% | 11.3% | 8.2% | 9.6% |
| All collected cell rate r(c) = N(a)/N(t) × 100% | 72.5% | 76.3% | 75.2% | 80.1% |
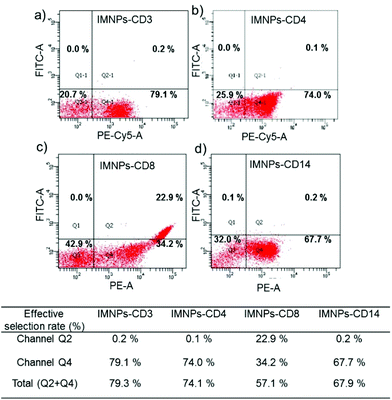
Next, quantitative assessments of the T cells from positive separation were carried out by flow cytometry to analyze the effective selection rate. The effective selection rate (reff) was calculated using the equation (reff) = (no. of aimed cells/no. of positive separation cells) × 100%. Fig. 6 demonstrated that most of the targeted T cells were successfully collected by magnetic cell sorting and the effective selection rate of CD3+, CD4+, CD8+ and CD14+ T cells was 79.3%, 74.1%, 57.1% and 67.9%, respectively. This result indicated that the separation and enrichment of targeted T cells could be accomplished using our self-designed high-throughput system. Then, the cells collected under aseptic conditions were incubated in the cell medium at 37 °C (5% CO2) with a good cell viability, and there was an obvious cell proliferation after 48 h, which means that the cells could be further proliferated in vitro for further infusion to patients in the future.
Herein, negative separated cells = unbounded cells, and positive separated cells = sorted cells.
3.4. Specific lysis study based on the sorted CD8+ T cells
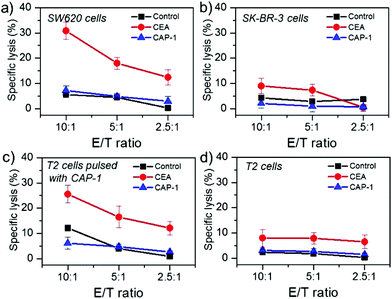
CD8+ T cells after stimulation by autologous DCs can lyse specific cells to obtain their killing effect for their targeted cells. In order to detect whether the sorted CD8+ T cells could procure target cell membrane fragments, CD8+ T cells sorted from the self-designed high-throughput system were co-incubated with four types of targeted cell lines, which included SW620 (CEA+, HLA-A*0201+), SK-BR-3 (CEA−, HLA-A*0201+), T2 cells and T2 cells pulsed with CAP-1, and each cell line was cultured in a medium supplemented with PBS (as control), carcino-embryonic antigen (CEA), and CAP-1, respectively. The cytotoxic activity of sorted CD8+ T cells against target cells with a range of E/T ratio is shown in Fig. 7. In the presence of CEA protein, sorted CD8+ T cells presented an obvious specific lysis ability against cell lines of SW620 and T2 cells pulsed with CAP-1, with the increasing E/T ratio from 2.5![[thin space (1/6-em)]](https://www.rsc.org/images/entities/char_2009.gif) :
:![[thin space (1/6-em)]](https://www.rsc.org/images/entities/char_2009.gif) 1 to 10
1 to 10![[thin space (1/6-em)]](https://www.rsc.org/images/entities/char_2009.gif) :
:![[thin space (1/6-em)]](https://www.rsc.org/images/entities/char_2009.gif) 1, where the percentage of SW620 cells increased from 12.4% to 30.8%, and the percentage of T2 cells pulsed with CAP-1 increased from 12.0% to 25.5%. However, there was no enhancement of specific lysis in the presence of PBS or CAP-1, because the CEA protein is identified as the cell-surface-anchored glycoprotein, which is primarily expressed on the targeted cells. In contrast, there is no obvious cytotoxic activity of CD8+ T cells against nonspecific cells lines (SK-BR-3 cells and T2 cells). Therefore, the sorted CD8+ T cells still keep good cytotoxic activity against specific cells.
1, where the percentage of SW620 cells increased from 12.4% to 30.8%, and the percentage of T2 cells pulsed with CAP-1 increased from 12.0% to 25.5%. However, there was no enhancement of specific lysis in the presence of PBS or CAP-1, because the CEA protein is identified as the cell-surface-anchored glycoprotein, which is primarily expressed on the targeted cells. In contrast, there is no obvious cytotoxic activity of CD8+ T cells against nonspecific cells lines (SK-BR-3 cells and T2 cells). Therefore, the sorted CD8+ T cells still keep good cytotoxic activity against specific cells.
4. Conclusions
In conclusion, we have successfully designed four types of immuno-magnetic nanoparticles (e.g., IMNPs-CD3, IMNPs-CD4, IMNPs-CD8 and IMNPs-CD14) based on polystyrene-coated superparamagnetic nanoparticles and selectively captured and separated CD3+, CD4+, CD8+ and CD14+ T cells using our designed auto-IMACS device. After the immune magnetic cell sorting process, the effective selection rate of these four cells are 79.3%, 74.1%, 57.1% and 67.9%, respectively, and the sorted CD8+ T cells still retain good cytotoxic activity against specific cells. During the study, the monodisperse IMNPs can perfectly fit with the separation column of the auto-IMACS device, which ensures that the targeted cells can be successfully sorted. Compared with some micro-bead products for research applications, our system, which combined the cell soring technology with mechanical automation, not only avoids the bacterial infection in this sealed pipeline during the cell sorting, but is also less expensive for further industrialization, since this system can achieve a recyclable large-scale cell sorting (the cell capacity of the separation column reached 105 ∼ 4 × 10¹⁰, and the throughput reached 200–4000 mL). The effective selection rate for T cells still needs to be improved in further studies. Nevertheless, based on our strategy, several types of IMNPs could be developed for separation of other rare cells in the human blood, and large-scale immuno-magnetic cell sorting could be further used in clinical medicine in the near future.Abbreviations
| SMNPs | Superparamagnetic nanoparticle |
| IMNPs | Immuno-magnetic nanoparticles |
| IMACS | Immuno-magnetic cell sorting |
| mAb | Monoclonal antibody |
| auto-IMACS device | Automatic immune magnetic cell sorting device |
Author contributions
All the authors contributed to the data analysis and the writing of this manuscript, and all authors reviewed the manuscript and have given approval to the final version of the manuscript.Conflicts of interest
There are no conflicts to declare.Acknowledgements
This work was supported by 863 High-Tech project of China (2014AA020701, 2014AA020702), the National Natural Science Foundation of China (81671737, 81571835) and 973 Project (2017YFA0205301). The funding from Shanghai Engineering Research Center for Intelligent diagnosis and treatment instrument (15DZ2252000) is also acknowledged.References
- S. Hori, T. Nomura and S. Sakaguchi, Science, 2003, 299, 1057–1061 CrossRef CAS PubMed.
- E. Tran, S. Turcotte, A. Gros, P. F. Robbins, Y. C. Lu, M. E. Dudley, J. R. Wunderlich, R. P. Somerville, K. Hogan and C. S. Hinrichs, Science, 2014, 344, 641–645 CrossRef CAS PubMed.
- T. Lehner, Immunology, 2008, 123, 40–44 CrossRef CAS PubMed.
- L. E. Harrington, R. D. Hatton, P. R. Mangan, H. Turner, T. L. Murphy, K. M. Murphy and C. T. Weaver, Nat. Immunol., 2005, 6, 1123–1132 CrossRef CAS PubMed.
- M. K. Maini, C. Boni, C. K. Lee, J. R. Larrubia, S. Reignat, G. S. Ogg, A. S. King, J. Herberg, R. Gilson and A. Alisa, J. Hepatol., 2000, 191, 1269 CAS.
- S. I. Mannering, J. S. Morris, K. P. Jensen, A. W. Purcell, M. C. Honeyman, P. M. van Endert and L. C. Harrison, J. Immunol. Methods, 2003, 283, 173–183 CrossRef CAS PubMed.
- M. Bodinier, M. A. Peyrat, C. Tournay, F. Davodeau, F. Romagne, M. Bonneville and F. Lang, Nat. Med., 2000, 6, 707–710 CrossRef CAS PubMed.
- M. Gil, V. Sarshalom, Y. M. Sivira, R. Carreras and M. A. Checa, J. Assist. Reprod. Genet., 2013, 30, 479–485 CrossRef PubMed.
- E. K. Dirican, O. D. Özgün, S. Akarsu, K. O. Akın, Ö. Ercan, M. Uğurlu, Ç. Çamsarı, O. Kanyılmaz, A. Kaya and A. Ünsal, J. Assist. Reprod. Genet., 2008, 25, 375–381 CrossRef PubMed.
- Y. Wang, H. Xu, M. Wei, H. Gu, Q. Xu and W. Zhu, Mater. Sci. Eng., C, 2009, 29, 714–718 CrossRef CAS.
- T. J. Yoon, K. N. Yu, E. Kim, J. S. Kim, B. G. Kim, S. H. Yun, B. H. Sohn, M. H. Cho, J. K. Lee and S. B. Park, Small, 2006, 2, 209–215 CrossRef CAS PubMed.
- A. E. Saliba, L. Saias, E. Psychari, N. Minc, D. Simon, F. C. Bidard, C. Mathiot, J. Y. Pierga, V. Fraisier, J. Salamero, V. Saada, F. Farace, P. Vielh, L. Malaquin and J. L. Viovy, Proc. Natl. Acad. Sci. U. S. A., 2010, 107, 14524–14529 CrossRef CAS PubMed.
- J. Schmitz, Magnetic cell sorting, 2008 Search PubMed.
- R. Marek, M. Caruso, A. Rostami, J. B. Grinspan and S. J. Das, J. Neurosci. Meth., 2008, 175, 108–118 CrossRef PubMed.
- D. Freund, J. Oswald, S. Feldmann, G. Ehninger, D. Corbeil and M. Bornhäuser, Cell Proliferation, 2006, 39, 325 CrossRef CAS PubMed.
- C. Chalouni, J. Banchereau, A. B. Vogt, V. Pascual and J. Davoust, Int. Immunol., 2003, 15, 457 CrossRef CAS PubMed.
- A. Benez, A. Geiselhart, R. Handgretinger, U. Schiebel and G. Fierlbeck, J. Clin. Lab. Anal., 1999, 13, 229–233 CrossRef CAS PubMed.
- F. Yan, J. Li, J. J. Zhang, F. Q. Liu and W. S. Yang, J. Nanopart. Res., 2009, 11, 289–296 CrossRef CAS.
- F. Yan, X. W. Zheng, Z. M. Sun and A. H. Zhao, Polym. Bull., 2012, 68, 1305–1314 CrossRef CAS.
- H. Shang, W. S. Chang, S. Kan, S. A. Majetich and G. U. Lee, Langmuir, 2006, 22, 2516–2522 CrossRef CAS PubMed.
- H. Xu, L. L. Cui, N. H. Tong and H. C. Gu, J. Am. Chem. Soc., 2006, 128, 15582–15583 CrossRef CAS PubMed.
- S. Puertas, P. Batalla, M. Moros, E. Polo, P. del Pino, J. Guisan, V. Grazu and J. de la Fuente, ACS Nano, 2011, 5, 4521–4528 CrossRef CAS PubMed.
- Q. Zhang, I. Castellanos-Rubio, R. Munshi, I. Orue, B. Pelaz, K. I. Gries, W. J. Parak, P. del Pino and A. Pralle, Chem. Mater., 2015, 27, 7380–7387 CrossRef CAS.
- A. M. Abdelmonem, B. Pelaz, K. Kantner, N. C. Bigall, P. del Pino and W. J. Parak, J. Inorg. Biochem., 2015, 153, 334–338 CrossRef CAS PubMed.
- Q. Zhang, T. Yin, G. Gao, J. G. Shapter, W. Lai, P. Huang, W. Qi, J. Song and D. Cui, ACS Appl. Mater. Interfaces, 2017, 9, 17777–17785 CAS.
- W. Gao, W. Tao and H. Zhao, Simulation and Analysis of Magnetic Beads Sorting in High Gradient Magnetic Field and Efficiency Study, Springer, Singapore, 2016 Search PubMed.
- H. Liu, J. Y. Li, F. M. Wang, Y. T. Gao, Y. Luo, P. Wang, C. L. Li and Z. Y. Zhu, Tumor Biol., 2015, 36, 2299–2307 CrossRef CAS PubMed.
- B. Li, Y. Wang, J. Chen, H. Wu and W. Chen, Clin. Exp. Immunol., 2005, 140, 310–319 CrossRef CAS PubMed.
- X. D. Tong, Y. Xiong, M. Zborowski, S. S. Farag and J. J. Chalmers, Exp. Hematol., 2007, 35, 1613–1622 CrossRef CAS PubMed.
Footnote |
| † These authors contributed equally to this work. |
| This journal is © The Royal Society of Chemistry 2017 |

