
 Open Access Article
 This Open Access Article is licensed under a
 Creative Commons Attribution 3.0 Unported Licence
Nanoscale patterning of self-assembled monolayer (SAM)-functionalised substrates with single molecule contact printing†
M.
Sajfutdinow
a,
K.
Uhlig
b,
A.
Prager
c,
C.
Schneider
a,
B.
Abel
 c and
D. M.
Smith
*a
c and
D. M.
Smith
*a
aDNA Nanodevices Group, Fraunhofer Institute for Cell Therapy and Immunology, Perlickstr. 1, 04103, Leipzig, Germany. E-mail: david.smith@izi.fraunhofer.de
bBioanalytics and Bioprocesses, Fraunhofer Institute for Cell Therapy and Immunology, Am Mühlenberg 13, 14476, Potsdam, Germany
cChemical Department, Leibniz-Institute of Surface Modification (IOM), Permoserstr. 15, 04318, Leipzig, Germany
First published on 2nd October 2017
Abstract
Defined arrangements of individual molecules are covalenty connected (“printed”) onto SAM-functionalised gold substrates with nanometer resolution. Substrates were initially pre-functionlised by coating with 3,3′-dithiodipropionic acid (DTPA) to form a self-assembled monolayer (SAM), which was characterised by atomic force microscopy (AFM), contact angle goniometry, cyclic voltammetry and surface plasmon resonance (SPR) spectroscopy. Pre-defined “ink” patterns displayed on DNA origami-based single-use carriers (“stamp”) were covalently conjugated to the SAM using 1-ethyl-3-(3-dimethylamino-propyl)carbodiimide (EDC) and N-hydroxy-succinimide (NHS). These anchor points were used to create nanometer-precise single-molecule arrays, here with complementary DNA and streptavidin. Sequential steps of the printing process were evaluated by AFM and SPR spectroscopy. It was shown that 30% of the detected arrangements closely match the expected length distribution of designed patterns, whereas another 40% exhibit error within the range of only 1 streptavidin molecule. SPR results indicate that imposing a defined separation between molecular anchor points within the pattern through this printing process enhances the efficiency for association of specific binding partners for systems with high sterical hindrance. This study expands upon earlier findings where geometrical information was conserved by the application of DNA nanostructures, by establishing a generalisable strategy which is universally applicable to nearly any type of prefunctionalised substrate such as metals, plastics, silicates, ITO or 2D materials.
1. Introduction
Current trends in miniaturisation for the fabrication of microcircuitry, sensing devices and array-based analytical systems amplify the demand for precise and cost-effective enabling technologies for nanoscale surface lithography.1 High-performance photo- or imprint lithography rank as the present gold standards but are practically limited in terms of sufficient fabrication yields for sub-10 nm structures and further minimized half-pitches driving up costs.2In the life sciences, there is a strong and still growing need for generating precise arrangements consisting of a few or even single biomolecules on a wide variety of substrate materials. Micro- and nano-arrays, in particular, are of central importance to both high-throughput screening and analysis applications for proteins, nucleic acids, peptides and carbohydrates.3 One approach that has attained single molecule resolution, single-molecule cut and paste, utilises an atomic force microscope to transport single DNA strands from a repository to exact locations on a surface via the atomically sharp tip of a cantilever.4 Despite this technique's remarkable resolution, natural limits on throughput imposed by the serial, molecule-by-molecule construction of patterns make it inapplicable, both in terms of speed and cost, for the large scale production of analytical platforms.
Promisingly, methods integrating molecular self-assembly hold the potential to supersede effort- and cost-intensive top-down procedures as the preferred lithographic methods for high-precision molecular patterning. One popular method for self-assembling nanometre-precise structures is DNA origami.5 With this technique, a collection of short, synthetically produced “staple” oligonucleotides fold a long, single-stranded “scaffold” strand into a precise shape through complementary base-pairing. The scaffold strand is typically derived from the M13 bacteriophage genome and around 7000 bases long, which allows it to be folded by the approximately 200 staple strands into nearly any 2D or 3D structure, with typical dimensions on the order of tens or hundreds of nanometers. This technique offers the unmatched possibility to deterministically program the shape and surface functionality of nanostructures that self-assemble in a scalable, high-yield assembly reaction, and the possibility to achieve sub-nanometre spatial resolution for individual molecules.6 This elegant method enables the positioning and detailed study of individual nano-objects e.g. biomolecules,7 nanoparticles8 or dyes9 in a straightforward manner with high precision via a simple breadboard system. However, the structural integrity of DNA-based self-assembled structures is sensitive with respect to pH, ionic buffer conditions, temperature, detergents or any other physiochemical factors that can affect the hydrogen bonds of individual base-pairs or electrostatic interactions between negatively-charged DNA strands. This imposes an inherent and potentially inconvenient limitation; the window of chemical conditions required for the stability of DNA-based structures is not always compatible with the optimal conditions for the functionality of the arranged nano-objects.
This results in the need for structural stabilisation in order to conserve the geometrical functionality of the breadboards, both in terms of their overall shapes and positions of individual functional molecules. Reported stabilisation strategies for DNA nanostructures include chemical ligation of abutting 5′ and 3′ termini of DNA strands,10 the photo- or chemically activated crosslinking of DNA strands,11–13 carbonisation of DNA nanostructures,14 assembly in the presence of polyvalent ions such as spermidine,15 and encapsulation in polymer16 and lipid membrane17 shells or under graphene layers.18 The utilisation of DNA nanostructures as masks in various etching19 and imprint processes20 has also been used as a way to preserve shape characteristics.
As an alternative strategy, several studies have employed a transfer process for placing patterns of DNA strands on either streptavidin coated gold films,21 gold nanoparticles22,23 or bare gold substrates.24 In these cases, specific functional groups such as biotin or thiol on the deposited DNA strands were chosen according to the substrate. Although these do preserve both the global morphology as well as internal resolution of individual molecules within DNA nanostructures, in each case they remain limited to specific substrates (e.g. streptavidin or gold) and the requisite transfer chemistries (biotin or thiol). Hence, the common drawback of all these methods is a very specialized applicability defined by the substrate material.
Herein, we report a procedure for universalising the deposition of DNA-templated, single-molecule patterns onto nearly any type of solid substrate, termed “single-molecule contact printing” (Fig. 1). Our strategy encompasses the pre-functionalisation of inert bare substrate with a self-assembled monolayer that also carries an additional functional group for covalent coupling to printed DNA “ink” strands. Here, the functionalisation is carried out on a gold substrate by common and simple thiol-directed self-assembled monolayers, which are known to arrange in dense and stable coatings on metals such as gold, silver or copper.25 The thiol-containing molecules comprising the monolayer can also carry an additional moiety (e.g. amine or azide groups) for covalently depositing (“printing”) secondary molecules via bioconjugation. In this study, a carboxylic acid group facilitated the printing of common amine-labeled DNA strands, arranged in distinct patterns by a DNA origami carrier.
 | ||
| Fig. 1 Schematic process of single molecule contact printing (from left to right). First, DTPA (I) forms a self-assembled monolayer (II) on gold-substrates. The carboxylic groups of SAM are activated by EDC–NHS (III). By substituting NHS, the SAM forms covalent amide bonds with primary-amine modified ink strands pre-patterned on the single-use DNA origami stamps. Covalently bound stamps were analysed by AFM (IV). The pattern is developed by applying several washing steps with ethanolamine, EDTA, NaOH (V). Afterwards single stranded DNA ink pattern can be used to arrange further biomolecules; here, single-stranded biotin-labelled (B) DNA probe-oligonucleotides (VI). Signal amplification for AFM and surface plasmon resonance (SPR) analysis was enabled by applying high-molecular weight tag-protein streptavidin (STV) (VII). Steps III to VII were further followed by SPR. | ||
2. Experimental
If not otherwise noted chemicals were purchased from Sigma Aldrich Co. LLC (St Louis, Missouri, USA). Absolute ethanol was purchased from Carl Roth GmbH & Co. KG (Karlsruhe, Germany).2.1. Deposition of self-assembled monolayers (SAM)
For the following experiments two types of bare non-derivatised gold substrates were used. Since common sputtered gold surfaces exhibit high roughness relative to the size of typical biomolecules, template-stripped ultra-flat gold films (Platypus Technologies LLC, Nobel Drive, Madison, USA) were used. We should note that stripped films do not require further cleaning, as evidenced by the 2.7 Å roughness seen through AFM imaging shown in Fig. 2A. | ||
| Fig. 2 Gold film substrates were pre-coated with DTPA SAM. Atomic force micrographs of (A) bare respectively. (B) DTPA coated Platypus substrates. Length scale 200 nm, height scale 3 nm. Contact angles Θ and Rms roughness were added to corresponding images. (C) Cyclic voltammetry for bare and DTPA coated Platypus substrates in 5 mM [Fe(CN)]3−/4− and 0.16 M H2SO4 with scan speed of 0.1 V s−1. (D) Surface plasmon resonance spectra for bare and DTPA coated Xantec substrates. Red arrow indicates shift due to SAM coating. | ||
For SPR characterisation, bare, underivatised gold chips purchased from XanTec bioanalytics GmbH (Dueseldorf, Germany) were used. These chips were pre-cleaned with oxygen plasma treatment (Diener electronic GmbH & Co. KG, Ebhausen, Germany) and successively rinsed in ethanol, distilled water then again ethanol, and finally dried with a stream of nitrogen.
SAM deposition was done on freshly cleaned gold films. Chips were dipped into 5 mM ethanolic 3,3′-dithiodipropionic acid (DTPA) solution for at least 24 h to form a densely packed SAM (Fig. 1A and B). Afterwards they were rinsed several times with ethanol and distilled water.
2.2. SAM characterization
The gold coated glass chip was mounted onto the sample holder and a BK7 prism (Linos Photonics GmbH, Göttingen, Germany) was attached to the glass side of the chip using immersion oil (n = 15![[thin space (1/6-em)]](https://www.rsc.org/images/entities/char_2009.gif) 220, Cargille Labs, Cedar Grove, USA). The intensity of reflected light on the gold film was measured for angles from 35° to 55°. Spectroscopy curves were post-aligned according to the angle of total reflection due to slight setup changes and averaged regarding corresponding samples.
220, Cargille Labs, Cedar Grove, USA). The intensity of reflected light on the gold film was measured for angles from 35° to 55°. Spectroscopy curves were post-aligned according to the angle of total reflection due to slight setup changes and averaged regarding corresponding samples.
2.3. DNA origami assembly and characterisation
The circular, 7249-base DNA scaffold strand for DNA origami structures was produced and purified as previously described.5 For a typical annealing reaction, 10 nM of the scaffold strand was combined with 100 nM of each corresponding staple strand and 5 μM of 3′-amine-labeled ssDNA (ink strands) in origami annealing buffer (10 mM Tris, 1 mM EDTA, 10 mM MgCl2). The reaction mixture was initially denatured for 5 min at 90 °C and annealed through a temperature decreasing ramp with −1 K min−1 from 89 °C to 20 °C. DNA origami samples were purified from excess staple and ink strands and exchanged to the printing buffer (137 mM NaCl, 2.7 mM KCl, 12 mM phosphate and 10 mM MgCl2) by ultrafiltration (Amicon® Ultra 0.5 mL 100 kDa, Merck KGaA, Darmstadt, Germany). The typical concentration of the total double-stranded DNA in origami sample following buffer exchange and purification was ∼4 nM.Correct DNA origami folding was verified by AFM imaging. Freshly cleaved mica surfaces (Plano GmbH, Wetzlar, Germany) were coated with 100 μL of 0.01% poly-L-ornithine for 5 min and subsequently rinsed with origami buffer. Origami samples were immobilized on the surfaces for 10 min. Imaging was carried out with intermittent contact mode in origami buffer using BL-AC40TS cantilevers.
2.4. dsDNA-probe as randomly deposited control
The random deposition of ink strands on the substrate was used to exclude random pattern formation (section 2.5), and to assess the maximal response in surface plasmon resonance measurements for dense coverage (section 2.6). 8 μM of ink strands and 5′-biotin-TEG-labelled ssDNA in printing buffer were initially denatured for 2 min at 90 °C and successively hybridised in linearly decreasing temperature ramp for 10 min to 20 °C.2.5. General printing protocol
The SAM-coated gold film was first activated for 30 minutes with a freshly prepared solution containing 200 mM 1-ethyl-3-(3-dimethylamino-propyl)carbodiimide (EDC) and 50 mM N-hydroxy-succinimide (NHS). Afterwards, this activation solution was replaced by either 2 nM origami (65 fmol cm−2) or 8 μM of a positive control strand consisting of the ink strand hybridised to a complement with a 5′-biotin-TEG label (450 fmol cm−2) for 2 hours.For pattern development, the DNA-containing sample was discarded and the surface was initially blocked for 10 min with 1 M ethanolamine (pH 8.2) to deactivate any remaining NHS-esters and minimise any non-specific binding of protein probes. Afterwards the sample was treated with 10 mM EDTA for 10 min to deplete Mg2+-ions and weaken the DNA origami structure for subsequent denaturation. The sample was rinsed twice with 25 mM NaOH and then denatured for 30 s with 25 mM NaOH. Samples were then rinsed with washing buffer (1× HBS-EP+, GE Healthcare, Solingen, Germany). For randomly deposited control samples, initial surface characterisation was carried out before the denaturation step.
For probing printed patterns, 1 μM of a 5′ biotin-labeled complement strand (200 fmol cm−2) in washing buffer was hybridized to the printed ink strands for 20 min at ambient temperature. Again samples were rinsed with washing buffer. Afterwards, 25 ng μL−1 streptavidin in washing buffer was added to films and incubated for 10 min. The samples were rinsed with washing buffer and dried under a stream of nitrogen.
2.6. Characterisation of printed surfaces
The chip was first primed with washing buffer and cleaned for 30 s with 10 mM NaOH and 50 mM glycine (pH 2) until the response became steady. Regeneration of surfaces that contain dsDNA (printed or randomly deposited), was done by injection of 25 mM NaOH for 24 s with flow rate of 10 μL min−1. The DTPA-coated gold films were activated with activation solution for 10 min. Since a higher sample volume was necessary for SPR experiments, similar amounts of the origami sample and biotin-functionalised dsDNA for the randomly deposited control were diluted to 0.5 nM and 1 μM, respectively, and injected for 10 min.
Patterns were developed as described in section 2.5 and immobilised origami were denatured by regeneration cycle.
Probing for immobilised ink strands was done according to the protocols in section 2.5. Due to the expected low coverage response arising from the low mass of the DNA, the signal was amplified by the binding of streptavidin to the biotin molecules. 2.5 ng μL−1 of streptavidin in washing buffer was injected until saturation. Afterwards the films were regenerated.
For reversibility assays, the probing procedure was repeated once for both printed and randomly deposited control samples.
A negative control for the unspecific association of streptavidin to dsDNA was carried out by repeating the probing procedure with an unmodified ssDNA strand complementary to the ink strand, without biotin.
The SPR signal is shown in response units, which correspond to the change in reflection angle, proportional to the mass adsorbed to surface. Analysis for the streptavidin amplified response was done by subtracting the absolute response before association and after dissociation (during equilibration) for all measurements. Response changes were further purged from unspecific interaction of streptavidin and dsDNA and compared to the initial response of the randomly deposited control sample.
3. Results and discussion
In order to universalise the protocol for printing patterns of ink molecules positioned on DNA origami stamps, targeted substrates first need to be pre-functionalised. As an example, we deposited 3,3′-dithiodiproppionic acid (DTPA), which is used to form self-assembled monolayers on sensor transducers,29 onto an ultra-flat, template-stripped gold chip (Fig. 1I + II). Our analyses confirmed the deposition of a dense layer of DTPA, consistent with earlier findings on similar substrates. AFM-based imaging shows a smoothing (2.16 Å) of topological features (Fig. 2A and B) and contact angle measurement reveals change of 42° towards higher hydrophilicity typical of coated gold films (Fig. 2A, B and Fig. S1†).25 Moreover, cyclic voltammetry analysis (Fig. 2C) exhibits shifts of peak potentials that are typical for metal surface coatings29 and surface plasmon resonance reveals an expected increase of the angle for maximal plasmon excitation (Fig. 2D).Bioconjugation of DNA strands to the SAM-coated surface was facilitated by forming amide-bonds between the carboxylic acid groups on the DTPA molecules and amine groups on the ink strands. For activation of the exposed carboxy groups extending outward from the DTPA layer, we utilise common, low-cost activation agents, i.e. EDC and NHS, thus forming intermediate NHS-esters (Fig. 1III).30 However, other conjugation chemistries can be applied, e.g. a click-based strategy when using a molecule such as 11-azido-1-undecanethiol to form the SAM. Since plasmon excitation at the total internal reflection angle is very sensitive to the molecular nature of the surface, SPR27 is a suitable method to both follow and quantify the bioconjugation, and thus printing process. As seen in Fig. 3, panel III, the change in SPR response as measured for the adsorbed mass was observed for the formation of NHS-esters. These active esters form amide bonds with primary amines in high yield.30 It has been shown that this conjugation principle can be used to position DNA origami structures within lithographically pre-patterned surfaces for higher positioning performance,31 but not to transfer a pattern to a substrate.
 | ||
| Fig. 3 Exemplary sensorgram of printing with DNA origami stamps onto a DTPA coated gold film. (III) The coated gold film is activated with EDC/NHS. (IV) DNA origami stamps carrying primary amines were applied to activated surface. (V) Afterwards, the pattern was developed by applying (a) ethanolamine, (b) EDTA and (c) NaOH. The patterns were probed with (VI) biotin-labelled single stranded DNA and (VII) streptavidin. | ||
To test whether it is possible to print geometrical information via bioconjugation using DNA origami templates (Fig. 1IV) we first defined a clear and simple stripe pattern on a rectangular DNA origami structure. The pattern consists of 16 identical 17-base overhanging sequences at the 5′-end, evenly spaced along two adjacent double helices of the backbone, with a nearest neighbour of 6 nm. The predefined pattern was programmed to have a length of approximately 90 nm (Fig. 4A inlet) and a width of 2.5 nm. The overhanging sequences were hybridised to complementary sequences carrying primary 3′-amine groups, which react with the intermediate NHS-esters to form covalent bonds with the pre-activated SAM. Adsorption and immobilisation of the DNA origami stamps on the SAM was tracked by SPR, revealing a significantly increased plateau of the dissociation curve in the sensorgram (Fig. 3IV, arrow), corresponding to their immobilisation on the surface. This was also directly confirmed through fluid-based AFM measurements (Fig. 4B). Convincing clarity of adsorbed DNA origami templates in intermittent contact mode could not be achieved in height imaging, but was seen in phase contrast imaging. The phase shift of cantilever oscillation in intermittent contact mode results from energy dissipation during tip–sample interaction.32 Difference in e.g. adhesion or stiffness between nano-objects and their corresponding surrounding environment generates image contrasts, where brighter areas correspond to higher energy dissipation.
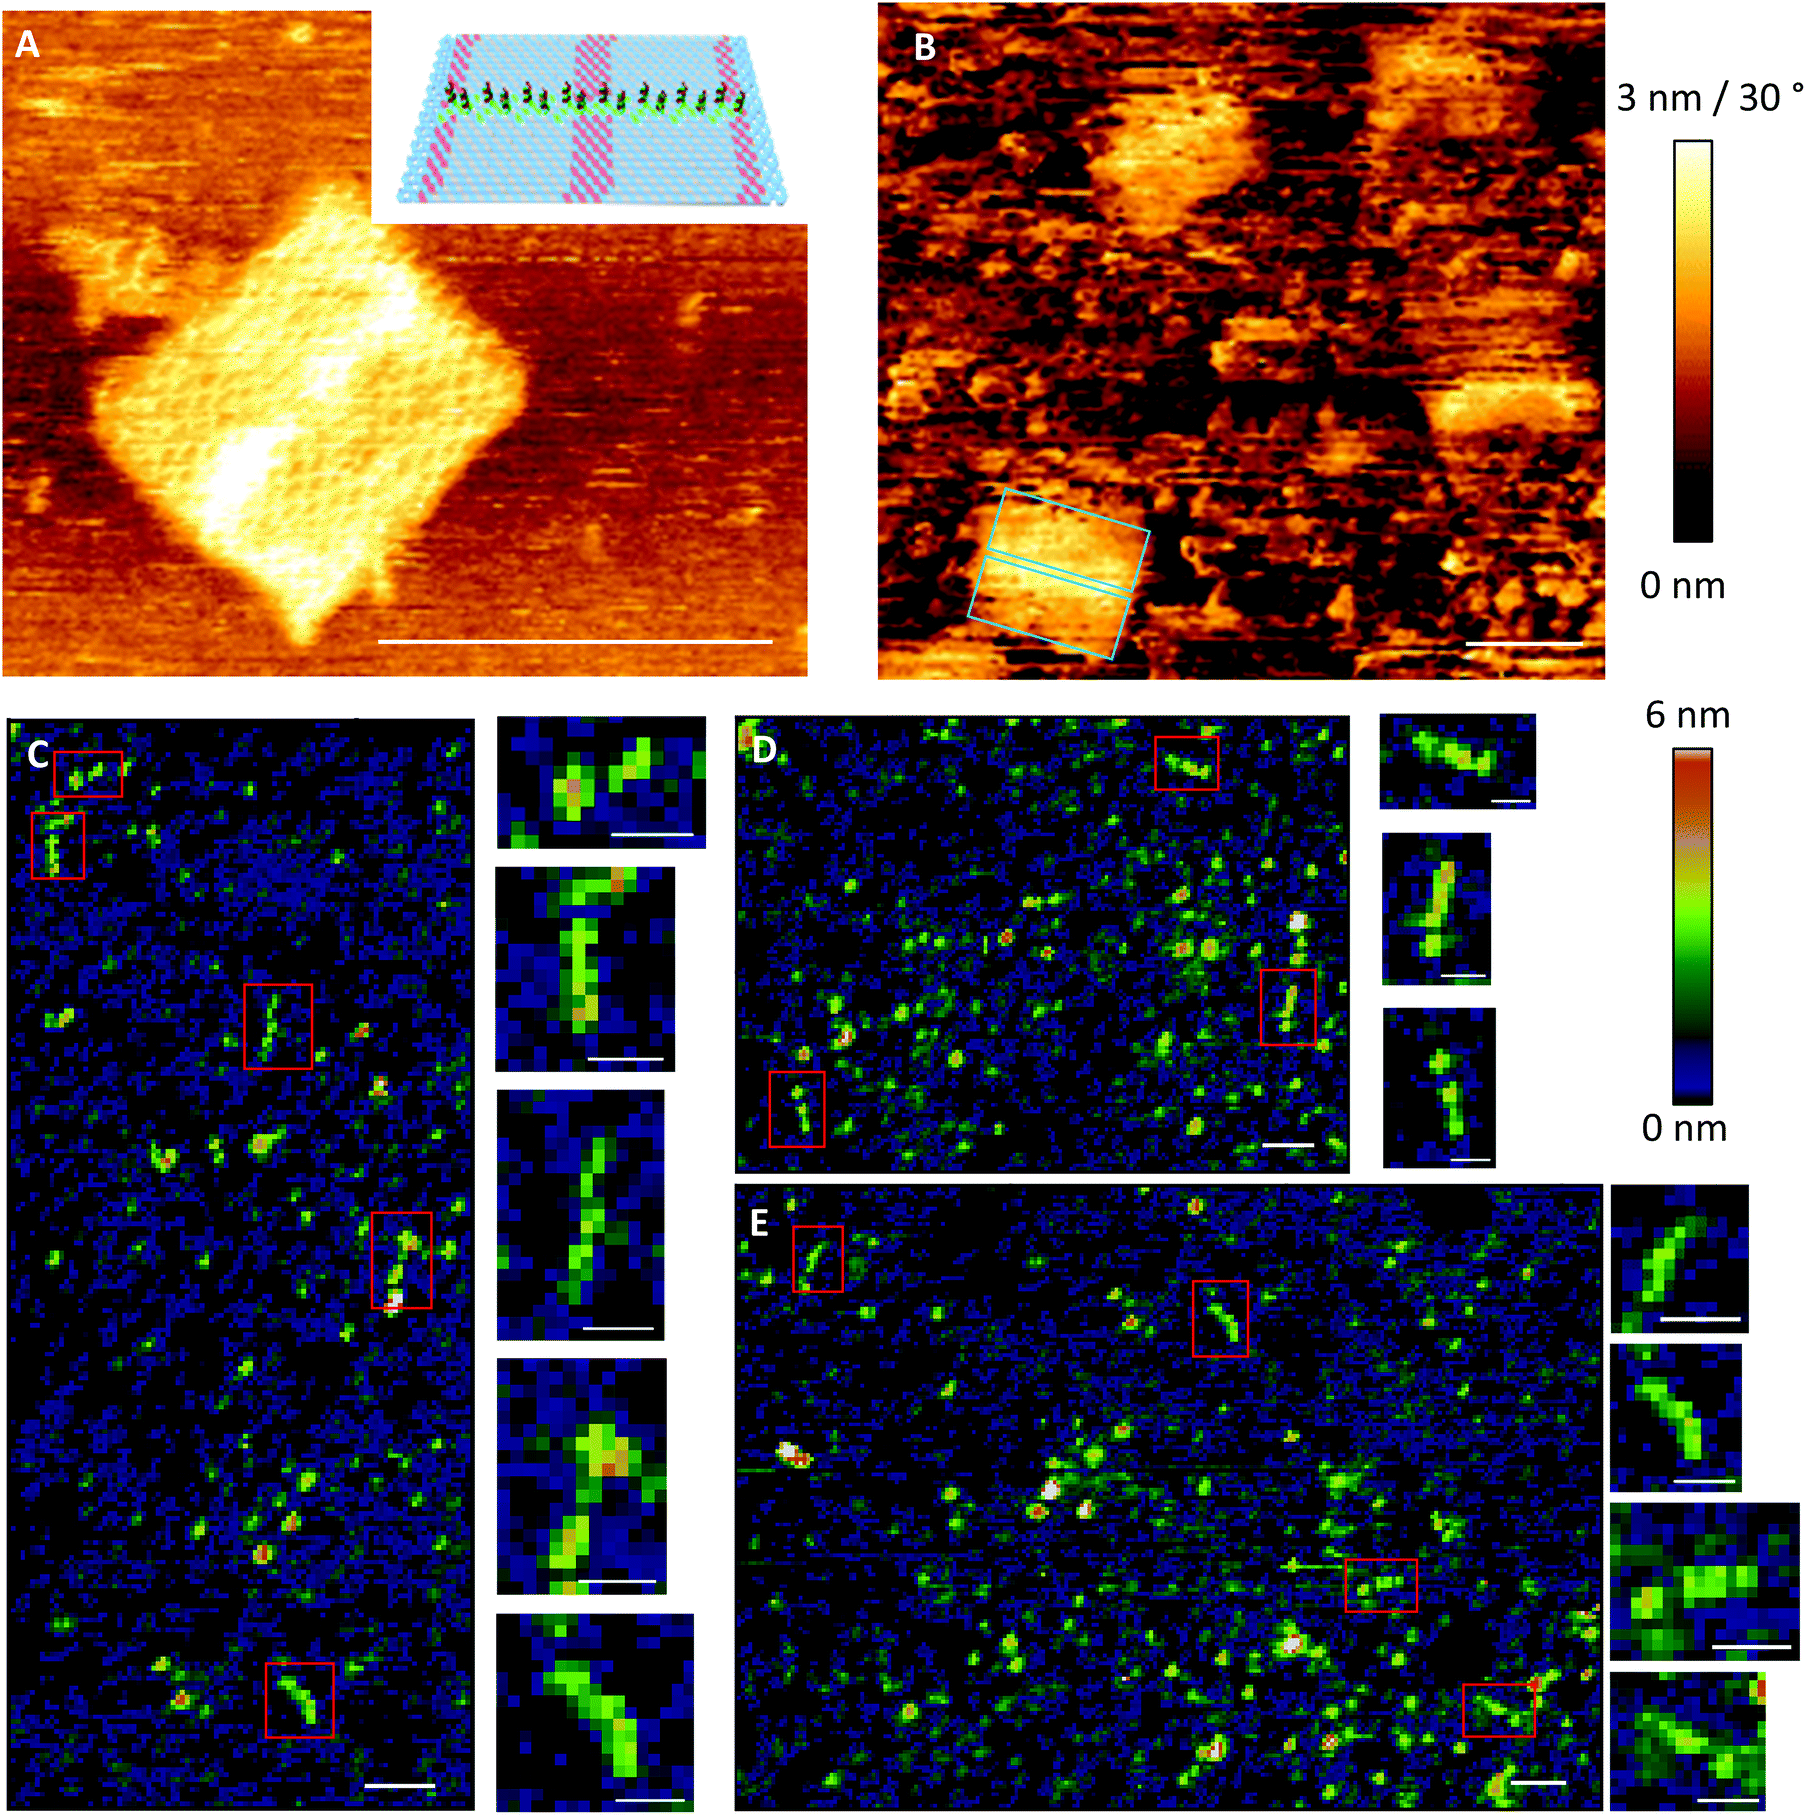 | ||
| Fig. 4 (A) A rectangular DNA origami stamp structure was designed (inlet) to carry unilateral printable ink DNA strands. Length scale bar 100 nm, height scale bar 3 nm. (B) After SAM activation the origami stamps were applied to surface. Blue inlet represents scales of observable origami. Length scale bar 100 nm, height scalebar 30°. (C–E) The stamps were sacrificed and the patterns used to arrange biotin-labelled DNA probe and streptavidin. Exemplary patterns were highlighted by red boxes and magnified. Occurence in downward order. Length scale bar of overview images represent 100 nm, for magnified images 40 nm. Height scale bar 6 nm. | ||
Subsequent to the adsorption-based printing step, the pattern was developed (Fig. 1V). First, the sample was rinsed with ethanolamine (Fig. 3Va) in order to chemically react with and passivate all remaining NHS-esters which were not conjugated with printed DNA strands, or which did not spontaneously hydrolyse during the previous step. Afterwards, the chelating agent EDTA was added to deplete Mg2+ and thus destabilise the covalently immobilised DNA origami structure (Fig. 3Vb). This was followed by a final denaturation step with 25 mM NaOH to disrupt all base pairing within the DNA origami template, thereby leaving only covalently printed ink strands on the surface (Fig. 3Vc). Again, SPR (Fig. 3Vc, arrow) characterisation reveal the removal of substantial material from surface.
Based on the estimated lateral coverage of a short, single-stranded DNA segment, we estimate that the 16 ink strands printed by the 70 × 100 nm DNA origami template would correspond to a maximum of 0.5% (∼2.5 × 10¹¹ molecules per cm2) surface coverage compared to the highest achievable density of ∼5 × 10¹³ molecules per cm2.33 While such a sparse coverage of roughly 5.6 kDa DNA oligonucleotides would be effectively undetectable by either AFM or SPR, large biomolecules such as proteins act as a natural amplification strategy. Here, we relied upon the high-affinity interaction between biotin and the 60 kDa tetravalent protein streptavidin34 as our model system (Fig. 1VII). Subsequent to the printing and development steps, the single-stranded DNA pattern was hybridized to a complement labelled with a 5′-biotin. Biotin was anchored close to surface (Fig. 1VI) to minimise streptavidin fluctuation during the AFM imaging that was used to directly visualise the printed, stripe-shaped streptavidin arrays. Fig. 4C shows a typical image section of printed patterns. Additional wide-area views can be seen in ESI section 1.3.† Stripe-shaped patterns were recognized only on printed substrates, whereas control substrates (Fig. S8†) composed of a dense layer of biotinylated double-stranded DNA segments revealed a rough carpet of biomolecules such as DNA and streptavidin. It should be noted that the printed substrates do still display a non-negligible amount of background debris. This could be attributed to nonspecific adsorption of streptavidin proteins, partially printed patterns, contamination with freely diffusing ink DNA strands even after purification, or other debris resulting from working outside of cleanroom conditions.
Previous work reported the spatial dimensions for streptavidin molecules bound to biotinylated dsDNA, revealing a mean height of 2.31 nm and a diameter of 11.1 nm using intermittent contact mode AFM in air.28 Those dimensions deviate drastically from common concept of a roughly spherical approximation of a globular protein. In accordance with the analysis in ref. 28, the length of a pattern identified via AFM imaging is determined as the distance between half-heights (i.e. 1.15 nm) at either end. The distribution of 41 such patterns extracted from images are plotted in the histogram in Fig. 5B. Binning was set to expected pattern length starting from the estimated pattern length of 90 nm and integer diameter of 12 nm to correspond to two anchor points, or roughly one streptavidin molecule. As shown in Fig. 5B detected pattern lengths occurring within the 78–90 nm bin are the dominant population with nearly 30%. An additional 40% of patterns show a variation of length corresponding to ±1 streptavidin molecules. The mean height for the analysed patterns was determined to be 2.29 (±0.83 SD) nm (Fig. 5C), which matches well with previously reported observations mentioned above.
 | ||
| Fig. 5 Qualitative analysis of pattern printing. (A) Comparison of random control and printed samples in initial printing and reversibility experiments. The relative signal change Δ of the angle of maximum plasmon excitation was measured after biotin-DNA and streptavidin probing. (B) Relative frequency F of length distribution of 41 cross sections from AFM images. Bin sizes correspond to expected length and horizontal diameter of streptavidin.28 (C) Average curve of center aligned cross-sections for 41 analysed patterns (±SEM). Vertical and horizontal arrows indicate mean height of all cross sections (2.29 nm) and length at half-height (∼90 nm), respectively. | ||
The negative skew of the distribution, with approximately half falling under the optimal range, indicates imperfections in either the printing of ink strands or attachment of streptavidin to biotin molecules, resulting in shorter patterns. Additionally, since the intermolecular distance of anchored biotin-molecules is roughly 6 nm, it is likely that many, if not most of the streptavidin molecules bind to multiple biotinylated anchor strands. Due to the near-covalent strength of the biotin–streptavidin bond, this would lead to variations in the number of streptavidin molecules bound to the 16 available biotin molecules in the printed pattern, affecting the overall length.
Both the printing process as well as the ability to use the deposited patterns of DNA strands as re-usable anchor points were also monitored through SPR measurements. The application of streptavidin to the substrates changed the response signal significantly for both the printed sample as well as a random control where a saturating density of biotinylated double-stranded segments were randomly deposited on the surface (Fig. S4†). Although the estimated surface coverage of printed patterns is expected to be less than 1% of random control, the magnitude of the SPR response following streptavidin binding was surprisingly around 60% of random control. Since the biotin label was chosen to anchor streptavidin very close to surface (Fig. 1VI) to minimise fluctuations during AFM analysis, we hypothesise that saturated surface coverage in the randomly deposited control limits the binding capacity of streptavidin molecules onto the surface through steric hindrance by the dense carpet of dsDNA segments.
This suggestion is further supported by reversibility tests carried out to demonstrate the cyclic re-use of the substrates. Here, the biotinylated complement strands and bound streptavidin molecules were dissociated through a NaOH regeneration step in order to leave only the printed or randomly-deposited single-strands covalently linked to the SAM-coated substrate. This was followed by the re-association of the biotinylated complement DNA strands and subsequent application of streptavidin as described above. Surprisingly, this led to a nearly identical signal amplification for the printed substrates (Fig. 5A and Fig. S4†). In contrast, the control substrates only demonstrated a 10% recovery of signal, likely due to sterically hindered hybridisation of the biotinylated complement or binding of the streptavidin molecule as suggested above. Similar observations of such steric hindrance were already shown in previous studies,35 and optimal densities of DNA molecules randomly deposited onto substrates have up to now only been empirically discovered.36
We would like to point out that this ability deterministically limit steric hindrance through printed deposition would be particularly beneficial for precise arrangements of larger objects of a non-biological nature. Previous reported results22–24 and our own studies have shown a similar technique applied to large gold nanoparticles, supporting the broadness of this asset. As described in more detail in ESI section 2,† we used a similar strategy as with previous studies to directly deposit thiol-functionalised DNA strands onto bare gold substrates. These were used to either deposit DNA-functionalised gold nanoparticles with distinct separations between the molecules (Fig. S12†). More generally, this method provides a fully reversible method for depositing molecules in a controllably accessible arrangement.
Other bioorthogonal conjugation strategies e.g. click chemistry, typically exhibit nearly 100% reaction yields. Thus we are optimistic that changing the conjugation reaction can improve the overall printing process as well as eliminate the possibility for any unwanted bond formation between unpassivated surface moieties and proteins, which are an inherent risk with either thiol- or amine-based strategies.
4. Conclusions
The strategy reported here offers a unique and fully scalable method to assemble single biomolecules into pre-defined patterns on nearly any kind of solid substrate. The modular design and one-pot, scalable assembly of the DNA origami stamps, and their ability to display nearly any desired arrangement of functional ink strands also create potential advantages in terms of time and cost for its wider application. Since the printed pattern can be easily controlled by simply selecting the positions of the functionalised ink strands on the surface of the DNA structure, this strategy can be combined with computer-aided design and commonly used, robotic liquid handling systems for a fully automated workflow.While we chose the convenient model of streptavidin binding to biotinylated DNA strands, numerous methods for site-specific attachment of DNA strands to proteins make this method suitable for the guided deposition of nearly any other type of protein, especially enzymes8 or antibodies,37 onto printed arrays of DNA anchor points. Our specific implementation of the strategy relies upon the attachment of the protein or other target molecule to a strand that hybridises to the anchor points. However, direct covalent attachment of proteins to the SAM could be implemented through a secondary conjugation between the protein and an orthogonal reactive group on a two-component SAM.38
Most importantly, in contrast to a printing onto bare gold surfaces22–24 this generalised approach of printing onto a pre-deposited SAM enables the overall principle to be universally applied to nearly any type of substrate material where a stable (see ESI note 2.3†), functional monolayer can be covalently or even non-covalently deposited. This opens the door for fabricating functional, nanometer-precise, single-molecule arrays on two-dimensional materials such as graphene and dichalcogenides, silanised silicates, ceramics, other metals such as titanium, semi-conducting substrates like ITO or even cheap plastics.
Conflicts of interest
There are no conflicts of interest to report.Acknowledgements
The authors acknowledge Fraunhofer IZI for generous Attract Funding and Dr Claus Duschl (Fraunhofer IZI, Potsdam) for helpful discussions.References
- K. Cooper, Micromachines, 2017, 8, 20 CrossRef.
- M. C. Traub, W. Longsine and N. van Truskett, Annu. Rev. Chem. Biomol. Eng., 2016, 7, 583–604 CrossRef PubMed.
- J. Sobek, K. Bartscherer, A. Jacob, J. D. Hoheisel and P. Angenendt, Comb. Chem. High Throughput Screening, 2006, 9, 365–380 CrossRef CAS PubMed.
- S. K. Kufer, E. M. Puchner, H. Gumpp, T. Liedl and H. E. Gaub, Science, 2008, 319, 594–596 CrossRef CAS PubMed.
- P. W. K. Rothemund, Nature, 2006, 440, 297–302 CrossRef CAS PubMed.
- J. J. Funke and H. Dietz, Nat. Nanotechnol., 2016, 11, 47–52 CrossRef CAS PubMed.
- (a) B. Sacca, R. Meyer, M. Erkelenz, K. Kiko, A. Arndt, H. Schroeder, K. S. Rabe and C. M. Niemeyer, Angew. Chem., Int. Ed, 2010, 49, 9378–9383 CrossRef CAS PubMed; (b) J. Fu, M. Liu, Y. Liu, N. W. Woodbury and H. Yan, J. Am. Chem. Soc., 2012, 134, 5516–5519 CrossRef CAS PubMed.
- A. Kuzyk, R. Schreiber, Z. Fan, G. Pardatscher, E.-M. Roller, A. Hogele, F. C. Simmel, A. O. Govorov and T. Liedl, Nature, 2012, 483, 311–314 CrossRef CAS PubMed.
- I. H. Stein, C. Steinhauer and P. Tinnefeld, J. Am. Chem. Soc., 2011, 133, 4193–4195 CrossRef CAS PubMed.
- (a) P. O'Neill, P. W. K. Rothemund, A. Kumar and D. K. Fygenson, Nano Lett., 2006, 6, 1379–1383 CrossRef PubMed; (b) R. P. Goodman, I. A. T. Schaap, C. F. Tardin, C. M. Erben, R. M. Berry, C. F. Schmidt and A. J. Turberfield, Science, 2005, 310, 1661–1665 CrossRef CAS PubMed; (c) M. de Stefano and K. Vesterager Gothelf, ChemBioChem, 2016, 17, 1122–1126 CrossRef CAS PubMed; (d) M. Kalinowski, R. Haug, H. Said, S. Piasecka, M. Kramer and C. Richert, ChemBioChem, 2016, 17, 1150–1155 CrossRef CAS PubMed; (e) V. Cassinelli, B. Oberleitner, J. Sobotta, P. Nickels, G. Grossi, S. Kempter, T. Frischmuth, T. Liedl and A. Manetto, Angew. Chem., Int., Ed, 2015, 54, 7795–7798 CrossRef CAS PubMed.
- A. Rajendran, M. Endo, Y. Katsuda, K. Hidaka and H. Sugiyama, J. Am. Chem. Soc., 2011, 133, 14488–14491 CrossRef CAS PubMed.
- D. Zhang and P. J. Paukstelis, ChemBioChem, 2016, 17, 1163–1170 CrossRef CAS PubMed.
- H. O. Abdallah, Y. P. Ohayon, A. R. Chandrasekaran, R. Sha, K. R. Fox, T. Brown, D. A. Rusling, C. Mao and N. C. Seeman, Chem. Commun., 2016, 52, 8014–8017 RSC.
- F. Zhou, W. Sun, K. B. Ricardo, D. Wang, J. Shen, P. Yin and H. Liu, ACS Nano, 2016, 10, 3069–3077 CrossRef CAS PubMed.
- A. Chopra, S. Krishnan and F. C. Simmel, Nano Lett., 2016, 16, 6683–6690 CrossRef CAS PubMed.
- N. P. Agarwal, M. Matthies, F. N. Gur, K. Osada and T. L. Schmidt, Angew. Chem., Int. Ed, 2017, 56, 1–6 CrossRef PubMed.
- S. D. Perrault and W. M. Shih, ACS Nano, 2014, 8, 5132–5140 CrossRef CAS PubMed.
- A. Matković, B. Vasić, J. Pešić, J. Prinz, I. Bald, A. R. Milosavljević and R. Gajić, New J. Phys., 2016, 18, 25016 CrossRef.
- (a) Z. Jin, W. Sun, Y. Ke, C.-J. Shih, G. L. C. Paulus, Q. Hua Wang, B. Mu, P. Yin and M. S. Strano, Nat. Commun., 2013, 4, 1663 CrossRef PubMed; (b) B. Shen, V. Linko, K. Tapio, M. A. Kostiainen and J. J. Toppari, Nanoscale, 2015, 7, 11267–11272 RSC; (c) S. P. Surwade, F. Zhou, Z. Li, A. Powell, C. O'Donnell and H. Liu, Chem. Commun., 2016, 52, 1677–1680 RSC.
- C. Tian, H. Kim, W. Sun, Y. Kim, P. Yin and H. Liu, ACS Nano, 2017, 11, 227–238 CrossRef CAS PubMed.
- K. Busuttil, A. Rotaru, M. Dong, F. Besenbacher and K. V. Gothelf, Chem. Commun., 2013, 49, 1927–1929 RSC.
- Y. Zhang, J. Chao, H. Liu, F. Wang, S. Su, B. Liu, L. Zhang, J. Shi, L. Wang, W. Huang, L. Wang and C. Fan, Angew. Chem., Int. Ed., 2016, 128, 8168–8172 CrossRef.
- T. G. W. Edwardson, K. L. Lau, D. Bousmail, C. J. Serpell and H. F. Sleiman, Nat. Chem., 2016, 8, 162–170 CAS.
- I. Gallego, B. Manning, J. D. Prades, M. Mir, J. Samitier and R. Eritja, Adv. Mater., 2017, 29, 1603233 CrossRef PubMed.
- J. C. Love, L. A. Estroff, J. K. Kriebel, R. G. Nuzzo and G. M. Whitesides, Chem. Rev., 2005, 105, 1103–1169 CrossRef CAS PubMed.
- S. Campuzano, M. Pedrero, C. Montemayor, E. Fatás and J. M. Pingarrón, J. Electroanal. Chem., 2006, 586, 112–121 CrossRef CAS.
- R. Karlsson, J. Mol. Recognit., 2004, 17, 151–161 CrossRef CAS PubMed.
- C. S. Neish, I. L. Martin, R. M. Henderson and J. M. Edwardson, Br. J. Pharmacol., 2002, 135, 1943–1950 CrossRef CAS PubMed.
- L. Codognoto, E. Winter, J. A. R. Paschoal, H. B. Suffredini, M. F. Cabral, S. A. S. Machado and S. Rath, Talanta, 2007, 72, 427–433 CrossRef CAS PubMed.
- N. Stephanopoulos and M. B. Francis, Nat. Chem. Biol., 2011, 7, 876–884 CrossRef CAS PubMed.
- A. Gopinath, E. Miyazono, A. Faraon and P. W. K. Rothemund, Nature, 2016, 535, 401–405 CrossRef CAS PubMed.
- (a) J. Tamayo and R. García, Appl. Phys. Lett., 1997, 71, 2394–2396 CrossRef CAS; (b) J. Tamayo and R. García, Appl. Phys. Lett., 1998, 73, 2926–2928 CrossRef CAS; (c) J. P. Cleveland, B. Anczykowski, A. E. Schmid and V. B. Elings, Appl. Phys. Lett., 1998, 72, 2613–2615 CrossRef CAS.
- A. B. Steel, R. L. Levicky, T. M. Herne and M. J. Tarlov, Biophys. J., 2000, 79, 975–981 CrossRef CAS PubMed.
- J. Wong, A. Chilkoti and V. T. Moy, Biomol. Eng., 1999, 16, 45–55 CrossRef CAS PubMed.
- (a) F. Ricci, R. Y. Lai, A. J. Heeger, K. W. Plaxco and J. J. Sumner, Langmuir, 2007, 23, 6827–6834 CrossRef CAS PubMed; (b) R. J. White, N. Phares, A. A. Lubin, Y. Xiao and K. W. Plaxco, Langmuir, 2008, 24, 10513–10518 CrossRef CAS PubMed; (c) F. Yu, D. Yao and W. Knoll, Nucleic Acids Res., 2004, 32, e75 CrossRef PubMed.
- S. Chen, M. F. Phillips, F. Cerrina and L. M. Smith, Langmuir, 2009, 25, 6570–6575 CrossRef CAS PubMed.
- (a) S. A. Kazane, D. Sok, E. H. Cho, M. L. Uson, P. Kuhn, P. G. Schultz and V. V. Smider, Proc. Natl. Acad. Sci. U. S. A., 2012, 109, 3731–3736 CrossRef CAS PubMed; (b) C. B. Rosen, A. L. B. Kodal, J. S. Nielsen, D. H. Schaffert, C. Scavenius, A. H. Okholm, N. V. Voigt, J. J. Enghild, J. Kjems, T. Torring and K. V. Gothelf, Nat. Chem., 2014, 6, 804–809 CrossRef CAS PubMed; (c) S. Agasti, Y. Wang, F. Schueder, A. Sukumar, R. Jungmann and P. Yin, Chem. Sci., 2017, 8, 3080–3091 RSC.
- M. S. Azam, S. L. Fenwick and J. M. Gibbs-Davis, Langmuir, 2011, 27, 741–750 CrossRef CAS PubMed.
Footnote |
| † Electronic supplementary information (ESI) available. See DOI: 10.1039/c7nr03696e |
| This journal is © The Royal Society of Chemistry 2017 |