
 Open Access Article
 This Open Access Article is licensed under a
 Creative Commons Attribution 3.0 Unported Licence
Ligand-core NLO-phores: a combined experimental and theoretical approach to the two-photon absorption and two-photon excited emission properties of small-ligated silver nanoclusters†
Isabelle
Russier-Antoine
a,
Franck
Bertorelle
a,
Nathalie
Calin
b,
Željka
Sanader
cd,
Marjan
Krstić
c,
Clothilde
Comby-Zerbino
a,
Philippe
Dugourd
a,
Pierre-François
Brevet
a,
Vlasta
Bonačić-Koutecký
*ce and
Rodolphe
Antoine
 *a
*a
aUniv Lyon, Université Claude Bernard Lyon 1, CNRS, Institut Lumière Matière, F-69622, Lyon, France. E-mail: rodolphe.antoine@univ-lyon1.fr
bUniv Lyon, Ecole Normale Supérieure de Lyon, CNRS Université Lyon 1, Laboratoire de Chimie UMR 5182, 46 allée d'Italie, Lyon, France
cCenter of excellence for Science and Technology-Integration of Mediterranean region (STIM) at Interdisciplinary Center for Advanced Sciences and Technology (ICAST), University of Split, Meštrovićevo šetalište 45, HR-21000 Split, Republic of Croatia
dFaculty of Science, University of Split, Teslina 12, HR-21000 Split, Republic of Croatia
eDepartment of Chemistry, Humboldt Universitat zu Berlin, Brook-Taylor-Strasse 2, 12489 Berlin, Germany. E-mail: vbk@cms.hu-berlin.de
First published on 14th December 2016
Abstract
We report a combined experimental and theoretical study of the two-photon absorption and excited emission properties of monodisperse ligand stabilized Ag11, Ag15 and Ag31 nanoclusters in aqueous solutions. The nanoclusters were synthesized using a cyclic reduction under oxidative conditions and separated by vertical gel electrophoresis. The two-photon absorption cross-sections of these protected noble metal nanoclusters measured within the biologically attractive 750–900 nm window are several orders of magnitude larger than that reported for commercially available standard organic dyes. The two-photon excited fluorescence spectra are also presented for excitation wavelengths within the same excitation spectral window. They exhibit size-tunability. Because the fundamental photophysical mechanisms underlying these multiphoton processes in ligand protected clusters with only a few metal atoms are not fully understood yet, a theoretical model is proposed to identify the key driving elements. Elements that regulate the dipole moments and the nonlinear optical properties are the nanocluster size, its structure and the charge distribution on both the metal core and the bound ligands. We coined this new class of NLO materials as “Ligand-Core” NLO-phores.
Introduction
Two-photon absorption (TPA) defined as the electronic excitation of a molecular system induced by the simultaneous absorption of a pair of photons was first proposed theoretically by M. Göppert-Mayer in 1931.1 TPA was then only demonstrated experimentally in 1961, soon after the invention of the laser.2 TPA is obtained with photons at a frequency half of the actual energy gap between the ground and excited states. As a result, for transitions in the visible to blue side of the optical spectrum, TPA is readily accessible with the femtosecond pulses delivered by standard femtosecond oscillators with a wavelength tunability in the 700–1300 nm range. This is therefore a definite advantage to access a deeper penetration depth into the heavily scattering biological tissue media. TPA has thus gained a widespread popularity in the biology community especially in the development of microscopy. Other applications like photodynamic therapy with in situ photon conversion have also been recently proposed as an alternative method to the more conventional one-photon absorption (OPA) one. Besides the deeper penetration depth of long wavelength irradiation into tissues, a gain in the spatial resolution is also observed owing to the multiphoton character of the interaction of light with the medium.3 Similarly, the technique of two-photon excited fluorescence (TPEF), that entails a TPA process in the first stage before emission of the fluorescence photon, is also gaining a widespread popularity within the same community.4 Here, the advantages not only lie in the increased penetration depth in tissues but also in the reduced background fluorescence of the images collected.Within this context, considerable efforts have been made to engineer molecular systems or nanoparticles with the largest TPA and TPEF cross-sections. Interestingly, it is also attractive to compare these cross-sections with their molecular first hyperpolarizability. The latter is the cross-section for the process of frequency doubling better known as Second Harmonic Generation (SHG). SHG relies on the quadratic or first hyperpolarizability whereas TPA and TPEF rely on the cubic nonlinearity or second hyperpolarizability. In the case of SHG for instance, the standard class of molecular systems is known as asymmetric push–pull chromophores whereas for the TPEF process it is rather customary to have centrosymmetric systems.5–7 Push–pull chromophore systems consist of donor and acceptor end-groups connected by a charge conjugation path. The latter introduces the possibility of a large charge transfer along the conjugated molecular axis upon excitation. Recently, Ågren and collaborators have proposed a simple relationship between the metric of the charge transfer excitation Δr of a bright π–π* state, involved in the first hyperpolarizability, and the two-photon absorption cross-section for two families of push–pull π-conjugated systems.8 The change in the dipole moment upon excitation Δr can also be viewed as a measure of the average hole–electron distance upon excitation and can therefore be used to link hyperpolarizability values to the conjugated chain length of push–pull systems. While extremely appealing as efficient chromophores, or more precisely nonlinear optical (NLO)-phores, for quadratic and cubic nonlinear processes, such push–pull systems in the form of dipolar organic dyes usually suffer from poor water solubility, severe photobleaching and high cytotoxicity. Alternatives to organic NLO-phores must therefore be sought.
Noble metal nanoclusters constitute another route to provide efficient linear optical (LO)-9 and NLO-phores.10 The search for ultra-bright emitting metal nanoclusters has been developed over the last 12 years or so using the concept of a ligand shell protected metal core. The latter core is however composed of only a few metal atoms in order to avoid developing a surface plasmon resonance.11,12 Different ligand shell templates have been proposed, from small organic compounds13,14 to larger proteins,15 DNA16 and dendrimers for example.17 Such nanoclusters then display intense luminescence with large Stokes shifts and long lifetimes along with good photostability.18 In addition, the use of peptides or proteins as templates brings a good biocompatibility and low cytotoxicity, rendering these nanoclusters highly appealing for bio-imaging applications.19 Moreover, these nanoclusters display giant TPA cross sections in the NIR region as shown by Goodson and collaborators20 and more recently by our group.21,22 In particular, biocompatible glutathione capped gold nanoclusters are excellent one- and two-photon excited fluorescence (OPEF and TPEF) contrast agents for live cell imaging, as proposed by Polavarapu et al.23
However, predicting the emission properties upon one- and two-photon excitation in these nanoclusters remains a difficult task. Radiative de-excitation pathways involving either metal–metal transitions within the metal core or ligand-to-metal and ligand-to-metal–metal charge transfer (LMCT and LMMCT, respectively) transitions are rather efficient.24,25 It is the purpose of this contribution to propose through a combined experimental and theoretical study of concepts to design ligand protected nanoclusters with large cross-sections for quadratic and cubic nonlinear processes based on the interplay between the ligand role and the non-uniform delocalisation of electrons within the metal core.
In a recent communication, we have reported theoretical results on the TPA cross section of small thiolated silver nanoclusters Ag15L11 where L stands for the –SH ligand. This system exhibits an extremely large TPA cross-section on the red side of the visible spectrum.26 Such large TPA cross-sections at long wavelengths are indeed expected when a resonance between a TPA and an OPA process to the final excited state occurs. Also, the leading excitations in states yielding large TPA cross-sections always involve ligands and not just the metal core. The TPA process is accompanied by a large charge transfer upon excitation. In the present work, we have adapted our size-focusing separation method to produce glutathione (SG) ligand protected Ag11, Ag15 and Ag31 nanoclusters. This achievement allows us to explore the size effect on the TPA and TPEF cross-sections. The size influences the optical band gap and then both the resonance effects and the charge transfer effects. Both result from a change in the metal core charge distribution, including the confinement of core electrons. A thorough comparison of the experimental findings with DFT and TDDFT calculations therefore allowed us to reveal the structural and electronic properties of these low nuclearity liganded silver nanoclusters constituting the new class of nonlinear nanomaterials termed “Ligand-Core” NLO-phores.
Results and discussion
Linear optical properties
Three of the smallest silver nanoclusters, previously denoted as bands 1, 2, and 6 in the synthesized mixtures obtained by Bigioni and collaborators27 were produced in a “size-focusing” way using a cyclic reduction under oxidative conditions.28,29 Two of these species have been formally identified previously using electrospray-ionization (ESI) mass spectrometry (MS) as Ag31(SG)19 (band 6) and Ag15(SG)11 (band 2).29 The smallest size (band 1) has been identified as the Ag11(SG)7 species in a recent study.30 PAGE and ESI-Time-of-Flight (TOF) MS analysis on band 1 in water/methanol (50/50 v/v) are shown for this band in Fig. S1 and S2.† Two charge states for Ag11(SG)7 were observed, namely [M − 2H+]2− and [M − 3H+]3−, in the mass spectra. In addition to Ag11(SG)7, minor Ag14(SG)10 species along with fragmented species were also present in the ESI-MS spectra, see in Fig. S2.† In an effort to structurally better characterize our cluster species, we also performed X-ray Powder Diffraction (see Fig. S3†). For Ag31(SG)19, the peak positions correspond to the fcc lattice arrangement for silver.31 The “metal core” sizes of the silver nanoclusters were estimated according to the broadening of the full width at half-maximum of the (111) diffraction peak by the Debye–Scherrer formula.32,33 These sizes are in reasonable agreement with the ones obtained using the DFT structures reported in this work (see Fig. 3 and Table S1 in the ESI†).Optical absorption and fluorescence spectra for the three nanocluster sizes, namely Ag11(SG)7, Ag15(SG)11 and Ag31(SG)19, were then recorded, as shown in Fig. S4.† The Ag15(SG)11 and Ag11(SG)7 absorption spectra are rather similar. They do not exhibit prominent features, only a monotonous increase of the absorption at wavelengths below 600 nm with a plateau between 400 and 500 nm. In contrast, the Ag31(SG)19 absorption spectrum shows a large characteristic peak centered at about 490 nm with an absorption onset near 700 nm. This band is attributed to a core-to-core excitation within the metal core, from the P-cluster-core orbital to the D-cluster-core-orbital.29 The fluorescence spectra for these nanoclusters were also recorded, as shown in Fig. S4b.† All solutions were excited at 450 nm. Ag15(SG)11 and Ag11(SG)7 display similar fluorescence spectra with a broad emission band centred at about 700 nm. Ag11(SG)7 though presents a small blue-shift of its emission band as compared to Ag15(SG)11. The quantum yields were measured to be 1.5 ± 1% and 2 ± 1% for Ag11(SG)7 and Ag15(SG)11, respectively, using DCM dye as the reference. Ag31(SG)19 is found to be extremely weakly fluorescent upon one-photon excitation at 450 nm. A slowly rising onset of fluorescence appears though in the NIR region but remains very low. While the present spectra for Ag15(SG)11 and Ag11(SG)7 are in qualitative agreement with those reported by Bigioni and collaborators,34 they clearly disagree for band 6. Indeed, Ag31(SG)19 is here found to be non-fluorescent whereas clusters in band 6 were previously found to be fluorescent in ref. 34 with a behaviour very similar to those of Ag15(SG)11 and Ag11(SG)7. We speculate that this discrepancy may arise from the synthesis as band 6 was previously attributed to the Ag32(SG)19 stoichiometry.35 One may therefore argue that the Ag31 and Ag32 metal cores introduce very different absorption and fluorescence properties. Note also that two small peaks at 335 and 635 nm were reported in the Ag32 absorption spectra, peaks that we do not observe in our synthesis, see Fig. S4.†
Two-photon excited fluorescence spectra
TPEF spectra with an excitation at 800 nm were recorded for the Ag11(SG)7, Ag15(SG)11 and Ag31(SG)19 nanoclusters, see Fig. 1. A broad band in the visible range between 400 and 650 nm with a large characteristic peak centered at about 530 nm is observed for Ag31(SG)19, whereas the TPEF spectra are red-shifted between 550 and 750 nm for Ag11(SG)7 and Ag15(SG)11. Also, while the TPEF and OPEF spectra are closely related for Ag11(SG)7 and Ag15(SG)11, the TPEF spectrum for Ag31(SG)19 is dramatically contrasted as compared to its linear OPEF counterpart where only an extremely weak emission in the NIR is observed, see Fig. 1. This Ag31(SG)19 TPEF spectrum though bears some similarity with the corresponding absorption spectrum. Fig. S5† reports the same TPEF spectrum albeit with an excitation at 780 nm but no change as compared to an excitation at 800 nm is observed. Such a difference between the emission spectra resulting from one or two photon excitation has already been reported for Ag29 silver nanoclusters in a previously reported study.21 One reason for this difference stems from a high symmetry dependence of the fluorescence spectra because OPEF and TPEF processes do not obey the same selection rules. The differences observed between the OPEF and TPEF spectra may therefore be accounted for by the different electronic distributions in the states involved in the metal-to-metal excitation within the silver nanocluster core and the LMCT and LMMCT excitations. We attempted to determine the TPA and TPEF cross-sections for these silver nanoclusters, using the methods reported in our previous studies.22 Experimentally, we found that the TPEF cross-sections at 800 nm excitation are 3.3 × 10⁻⁴, 0.00169 and 0.066 GM for the Ag11(SG)7, Ag15(SG)11 and Ag31(SG)19 nanoclusters, respectively, see Table 1. These experimental TPEF cross-sections are related to the TPA ones through the quantum yield (QY), namely QY = σTPEF/σTPA, see also Table 1. For the silver nanoclusters, this quantum yield is therefore found to be roughly constant at about 5 × 10⁻³ %. Similarly to gold nanoclusters, ligand protected silver nanoclusters are therefore excellent two-photon absorbers but present a limited two-photon emission cross-section due to a rather low quantum yield. Yet, the two-photon quantum yields for these small silver nanoclusters remain about two orders of magnitude higher than that of the gold nanoclusters.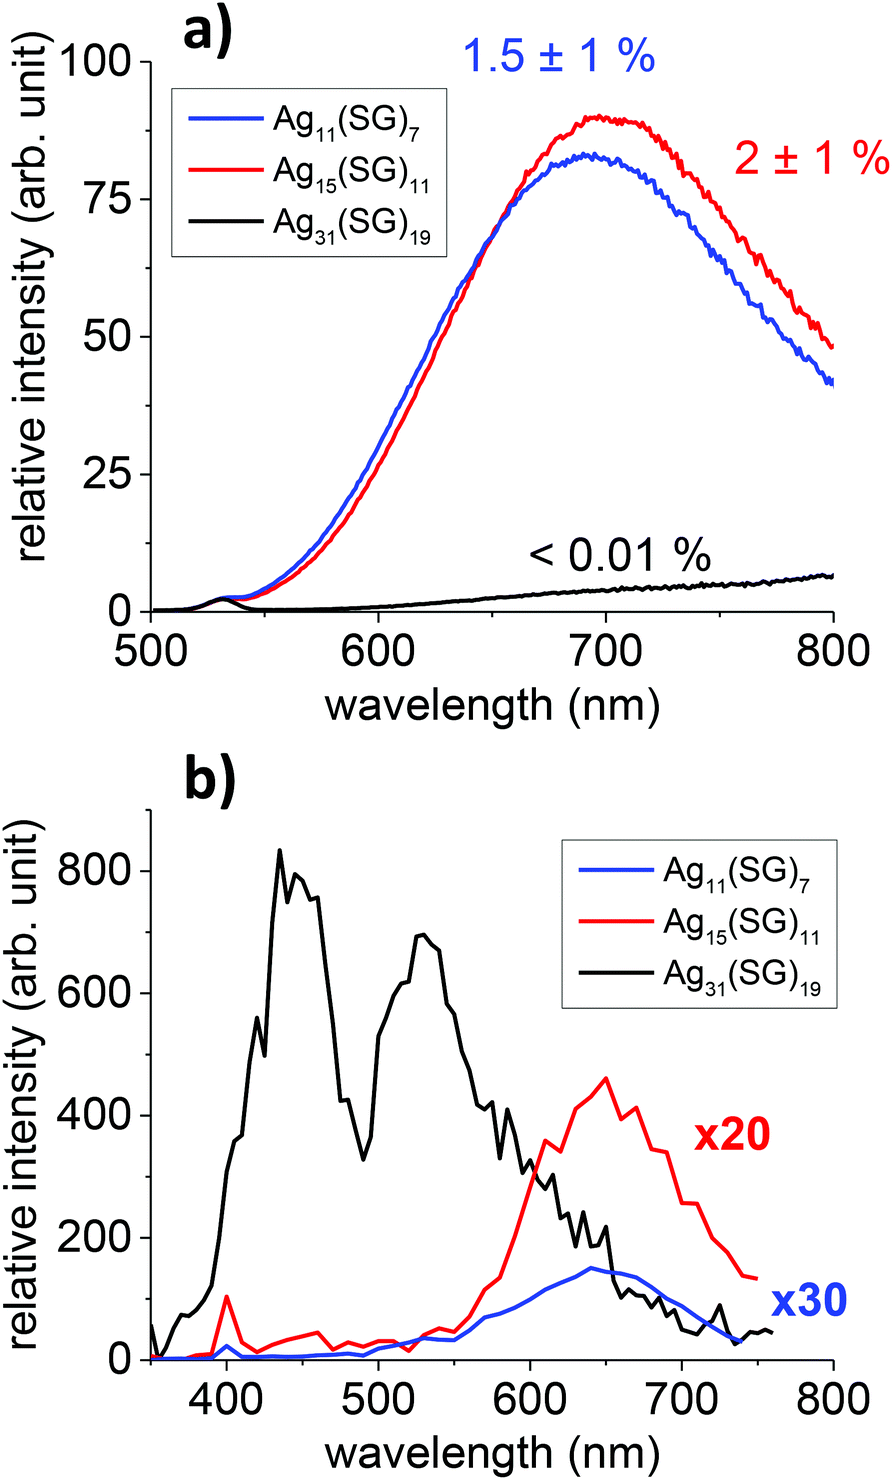 | ||
| Fig. 1 OPEF (a) and TPEF (b) spectra of Ag11(SG)7, Ag15(SG)11 and Ag31(SG)19 nanoclusters with an excitation at 450 nm (OPEF) and 800 nm (TPEF). | ||
| Silver nanoclusters | TPA cross section (in GM units) | TPEF cross section (in GM units) | Two photon QY (in %) |
|---|---|---|---|
| Ag11(SG)7 (band 1) | 6.6 | 3.3 × 10⁻⁴ | 4.9 × 10⁻³ |
| Ag15(SG)11 (band 2) | 63.5 | 0.00169 | 2.7 × 10⁻³ |
| Ag31(SG)19 (band 6) | 950 | 0.066 | 6.9 × 10⁻³ |
Two-photon absorption cross section
In parallel to the two-photon excited emission properties, we also investigated the TPA cross-section as a function of the laser excitation wavelength. Fig. 2 displays the cross-section for different wavelengths for the three nanocluster stoichiometries. Clearly, two trends emerge. First, the larger the nanocluster size, or more precisely the higher the number of silver atoms’ content, the larger is the TPA cross-section. Second, the TPA cross-section increases as the excitation wavelength shortens. Here, it must be emphasized that the TPA cross-sections are reported on a logarithmic scale. The observed effects are therefore large. TPA cross-sections are derived from the imaginary part of the second hyperpolarizability. A simple three-state model, involving a ground, an intermediate and a final state was proposed to qualitatively describe the TPA cross-sections for push–pull organic dye molecules. In this model, the TPA cross-sections depend on the transition energy between the ground to the intermediate and the intermediate to the final state and the related transition dipole moments. The resonance effect describes the possibility to have an excitation resonant at one or two photons between the three states involved. In ligated clusters, the transition dipole moment effect is related to the geometry taken by the core metal atoms and the ligands. These two effects have been further investigated with a theoretical approach. | ||
| Fig. 2 TPA cross-sections as a function of wavelength for the Ag11(SG)7 Ag15(SG)11 and Ag31(SG)19 nanoclusters. | ||
Structural, electronic and nonlinear optical properties of small ligand protected silver nanoclusters
 | ||
| Fig. 3 Comparison of TDDFT TPA spectra (a–c) of Ag11(SCH3)7, Ag15(SCH3)11 and Ag31(SCH3)19 nanoclusters for the lowest energy structures involving 4, 8 and 12 delocalized electrons in the metal core. Red asterisks label experimental values, while the black ones label theoretical values. Damping factor of 0.02 is used for Ag15(SCH3)11 yielding lower TPA cross-section values within 2 orders of magnitude. For Ag31(SCH3)19, a three state model is used accounting for only leading transition dipole moment contributions to the TPA cross section avoiding the calculation for transition dipole moments of all excited states. This allows correcting the values of the TPA cross-sections for S43 within 4 orders of magnitude, instead of using the damping factor. Structures of the clusters together with the electron localization function (ELF) representing delocalized electrons within the core plotted for the isovalue 0.20 (d–f). Leading excitations responsible for the large TPA cross-sections illustrating the participation of the ligands and the core are also shown (d–f). | ||
All the above listed factors are illustrated in Fig. 3 and 4. In the case of the Ag11L7 nanoclusters, the resonance between the OPA process with an excited S1 state localised at a wavelength of about 450 nm (see Fig. S4†) cannot be achieved considering a manifold increase of about 100 states within the calculation. The ELF representing delocalized electrons within the core in Ag11L7 nanoclusters (see Fig. 3d) shows an electron delocalization distributed in between all core atoms. This induces low values for the transition dipole moments through LMMCT excitations. For this stoichiometry, the central metal core is formed with one central Ag atom and two symmetrical Ag3 subunits. In contrast, for the Ag15L11 and Ag31L19 nanoclusters, the situation is strikingly different, as illustrated in Fig. 3b and c. First, there is a resonance between the low lying states accessible through OPA and TPA in the spectral range around 590 nm (in the case of Ag15L11) and 730 nm (in the case of Ag31L19). Second, in both cases, the delocalised electron distributions within the core are non-uniform as shown by the electron localization function (ELF) in the lower part of Fig. 3(e and f). This is a prerequisite for large transition dipole moments of LMMCT excitations involving ligands and the metal core. Notice that in the case of Ag15L11 with L = SCH3 the wavelength of the largest cross-sections is blue shifted by 56 nm with respect to the previously published result for Ag15L11 with L = SH,26 thus the structure of the ligands influences the results quantitatively but not qualitatively. Of course, an increase in the size of the metal core induces a red shift of the resonance between OPA and TPA and therefore plays an important role in the context of applications where the excitation wavelength lies in the NIR window.
 | ||
| Fig. 4 (a) Comparison of TPA spectra of Ag11(SCH3)7 without and with an external charge on the central Ag atom illustrating an increase of transition dipole moments as well as transition from (b) uniform delocalized electrons (q = 0) to non-uniform delocalized electrons (q = 0.05). Blue – positive, red – negative delocalization of electronic charge. Leading excitation from the ligand to the core for the considered excited state in inset. Values of maximal transition dipole moments (Debye) and cross sections (GM) for three values of external charge: q = 0 are 4.2 Debye (6 GM), q = 0.02 are 4.6 Debye (26 GM) and q = 0.05 are 16.3 Debye (36 GM). | ||
The influence of changing the charge distribution from uniform to non-uniform on the values of cross-sections is illustrated in Ag11L7 by introducing a positive external charge on the central Ag atom of the metal core. This pushes the electron distribution from the Ag3 group towards the central part of the core. The redistribution of electron density causes the increase of transition dipole moments through LMMCT excitations and induces an increase in TPA, as shown in Fig. 4a and b. However, this underlines that not only the size of the core but also the structure of the metal core responsible for the distribution of the charge might be important for giving rise to large TPA.
Altogether, despite the simplification of the nanocluster ligand nature, our findings suggest that, in addition to the role of ligands as acceptors or donors, the structural properties of the core, responsible for charge distribution of the delocalized electrons, play an important role in the design of large TPA cross-section systems.
The experimental and theoretical values for the TPA cross-sections are in acceptable agreement considering the simplification introduced. However, the wavelengths predicted with the theoretical calculations to yield very high TPA cross-sections are not yet experimentally accessible. From the application point of view, the design of NLO-phores with large TPA cross-sections in the NIR spectral window is desirable and can be realised according to the above proposed criteria.
Concluding remarks
As already observed for Ag29 nanoclusters, it appears that the different selection rules involved for one- and two-photon excitations are indeed playing a critical role in determining cross-sections for TPA, TPEF and SHG processes. In the case of the TPA cross-sections which we have investigated based also on theoretical contributions, a resonance between TPA and OPA is essential. Large transition dipole moments are due to ligand-to-core or inversely core-to-ligand excitations, and are reinforced by a non-uniform electronic distribution in the metal core. Therefore, large dipoles are a consequence of both the structural properties of the metal core and its size. Besides this analysis, the optical band gap decreases as the size of the silver nanoclusters increases, shifting the spectra towards the NIR spectral region, a feature useful for bio-imaging applications. Altogether, an understanding of leading factors governing non-linear properties of ligated small silver nanoclusters presented in this communication allows us to propose novel ligand-core NLO-phores with potential for different applications.Materials and methods
Experimental
12 hours later, the mixture is cooled to −10 °C and irradiated with a commercial UV lamp (“black light” lamp type, λmax 365 nm, 25 W). 50 mg (powder) of tetrabutylammonium borohydride is quickly added under agitation. After one hour, 20 mg (powder) of tetrabutylammonium borohydride is added and the solution is agitated for one more hour. Then, clusters are precipitated (and centrifuged) by adding 0.5 ml of 1 M NaOH (or KOH) solution. After being redissolved in water (≈1 ml), 20 ml of methanol is added. The precipitate was centrifuged again. This cycle (dissolution/precipitation/centrifugation) is repeated one more time before drying the powder under vacuum.
For characterization, PAGE separation was carried out by using a vertical gel electrophoresis unit with a size of 0.2 cm × 20 cm × 20 cm. The separating and stacking gels were prepared by acrylamide/bis-(acrylamide) monomers with the total content of 35 wt% (acrylamide/bis-(acrylamide) 94![[thin space (1/6-em)]](https://www.rsc.org/images/entities/char_2009.gif) :6). The eluting buffer consisted of 192 mM glycine and 25 mM tris(hydroxymethylamine). The as-prepared Ag(SG) clusters were dissolved in a 15% (v/v) glycerol/water solution (6 mg in 100 μl). The sample solutions were loaded onto the stacking gel (10 μl per well) and eluted for 7 h at a constant voltage (150 V) to achieve sufficient separation. After gel separation, our synthesis led to a major band closely located near “band 1”, “band 2” and “band 6” of the Bigioni synthesis.27
:6). The eluting buffer consisted of 192 mM glycine and 25 mM tris(hydroxymethylamine). The as-prepared Ag(SG) clusters were dissolved in a 15% (v/v) glycerol/water solution (6 mg in 100 μl). The sample solutions were loaded onto the stacking gel (10 μl per well) and eluted for 7 h at a constant voltage (150 V) to achieve sufficient separation. After gel separation, our synthesis led to a major band closely located near “band 1”, “band 2” and “band 6” of the Bigioni synthesis.27
X-ray powder diffraction experiments were carried out using a PANalytical EMPYREAN diffractometer with a PIXcel 3D detector using Cu-Kα monochromatic radiation and a High resolution Theta-Theta goniometer. XRD patterns were measured between 12 and 80° in 2θ at room temperature (with a step size of 0.026° and a time per step of 600 s).
| T = Ce−αL = Ce−(α+δI)L | (1) |
| T(I) ≈ T(0) − T(0)δLeffI | (2) |
 | (3) |
 | (4) |
For the silver atoms (Agn, n = 11, 15, 31), the 19-e-relativistic effective core potential (19-e-RECP) from the Stuttgart group38 taking into account scalar relativistic effects has been employed. For all atoms, triple zeta plus polarisation atomic basis sets (TZVP) have been used.38,39 The Perdew–Burke–Ernzerhof (PBE)40 functional and Coulomb-attenuated version of Becke's three-parameter non-local exchange functional together with the Lee–Yang–Parr gradient-corrected correlation functional (CAM-B3LYP)41 have been employed to determine the structural and optical properties.
For the calculation of the TPA cross section (σ),42 the two-photon absorption probability (δ) is needed which can be obtained from two-photon absorption transition matrices from the ground to the excited state using either a single residue8,43 or a double residue quadratic response procedure. In the latter case, the sum-over-states (SOS) approach can be used which also contains the dumping factor Γ serving to prevent the TPA cross-sections from blowing up near the one-photon resonances. This allowed TPA cross-sections to be adequately corrected when necessary as well as the inclusion of manifold states, usually 20 to 30 excited states. In some cases the “few states” model was used as a simplified version in which only the dominating terms in the two-photon absorption transition amplitude tensor are accounted for.44 For calculations the DALTON42,43 program and its modified version were used.
References
- M. Göppert-Mayer, Ann. Phys., 1931, 401, 273–294 CrossRef.
- W. Kaiser and C. G. B. Garrett, Phys. Rev. Lett., 1961, 7, 229–232 CrossRef CAS.
- A. V. Kachynski, A. Pliss, A. N. Kuzmin, T. Y. Ohulchanskyy, A. Baev, J. Qu and P. N. Prasad, Nat. Photonics, 2014, 8, 455–461 CrossRef CAS.
- W. Denk, J. Strickler and W. Webb, Science, 1990, 248, 73–76 CAS.
- C. Barsu, R. Cheaib, S. Chambert, Y. Queneau, O. Maury, D. Cottet, H. Wege, J. Douady, Y. Bretonniere and C. Andraud, Org. Biomol. Chem., 2010, 8, 142–150 CAS.
- F. Terenziani, C. Katan, E. Badaeva, S. Tretiak and M. Blanchard-Desce, Adv. Mater., 2008, 20, 4641–4678 CrossRef CAS.
- M. Kivala and F. Diederich, Acc. Chem. Res., 2009, 42, 235–248 CrossRef CAS PubMed.
- N. H. List, R. Zaleśny, N. A. Murugan, J. Kongsted, W. Bartkowiak and H. Ågren, J. Chem. Theory Comput., 2015, 11, 4182–4188 CrossRef CAS PubMed.
- R. Jin, Nanoscale, 2015, 7, 1549–1565 RSC.
- S. H. Yau, O. Varnavski and T. Goodson, Acc. Chem. Res., 2013, 46, 1506–1516 CrossRef CAS PubMed.
- L.-Y. Chen, C.-W. Wang, Z. Yuan and H.-T. Chang, Anal. Chem., 2015, 87, 216–229 CrossRef CAS PubMed.
- I. Diez and R. H. A. Ras, Nanoscale, 2011, 3, 1963–1970 RSC.
- J. Akola, M. Walter, R. L. Whetten, H. Hakkinen and H. Gronbeck, J. Am. Chem. Soc., 2008, 130, 3756–3757 CrossRef CAS PubMed.
- M. Zhu, C. M. Aikens, F. J. Hollander, G. C. Schatz and R. Jin, J. Am. Chem. Soc., 2008, 130, 5883–5885 CrossRef CAS PubMed.
- J. Xie, Y. Zheng and J. Y. Ying, J. Am. Chem. Soc., 2009, 131, 888–889 CrossRef CAS PubMed.
- J. T. Petty, J. Zheng, N. V. Hud and R. M. Dickson, J. Am. Chem. Soc., 2004, 126, 5207–5212 CrossRef CAS PubMed.
- J. Zheng and R. M. Dickson, J. Am. Chem. Soc., 2002, 124, 13982–13983 CrossRef CAS PubMed.
- X.-R. Song, N. Goswami, H.-H. Yang and J. Xie, Analyst, 2016, 141, 3126–3140 RSC.
- X. Qu, Y. Li, L. Li, Y. Wang, J. Liang and J. Liang, J. Nanomater., 2015, 2015, 23 Search PubMed.
- G. Ramakrishna, O. Varnavski, J. Kim, D. Lee and T. Goodson, J. Am. Chem. Soc., 2008, 130, 5032–5033 CrossRef CAS PubMed.
- I. Russier-Antoine, F. Bertorelle, R. Hamouda, D. Rayane, P. Dugourd, Z. Sanader, V. Bonacic-Koutecky, P.-F. Brevet and R. Antoine, Nanoscale, 2016, 8, 2892–2898 RSC.
- I. Russier-Antoine, F. Bertorelle, M. Vojkovic, D. Rayane, E. Salmon, C. Jonin, P. Dugourd, R. Antoine and P.-F. Brevet, Nanoscale, 2014, 6, 13572–13578 RSC.
- L. Polavarapu, M. Manna and Q.-H. Xu, Nanoscale, 2011, 3, 429–434 RSC.
- K. G. Stamplecoskie and P. V. Kamat, J. Am. Chem. Soc., 2014, 136, 11093–11099 CrossRef CAS PubMed.
- K. G. Stamplecoskie, Y.-S. Chen and P. V. Kamat, J. Phys. Chem. C, 2014, 118, 1370–1376 CAS.
- Z. Sanader, M. Krstic, I. Russier-Antoine, F. Bertorelle, P. Dugourd, P.-F. Brevet, R. Antoine and V. Bonacic-Koutecky, Phys. Chem. Chem. Phys., 2016, 18, 12404–12408 RSC.
- S. Kumar, M. D. Bolan and T. P. Bigioni, J. Am. Chem. Soc., 2010, 132, 13141–13143 CrossRef CAS PubMed.
- N. Cathcart, P. Mistry, C. Makra, B. Pietrobon, N. Coombs, M. Jelokhani-Niaraki and V. Kitaev, Langmuir, 2009, 25, 5840–5846 CrossRef CAS PubMed.
- F. Bertorelle, R. Hamouda, D. Rayane, M. Broyer, R. Antoine, P. Dugourd, L. Gell, A. Kulesza, R. Mitric and V. Bonacic-Koutecky, Nanoscale, 2013, 5, 5637–5643 RSC.
- A. Baksi, M. S. Bootharaju, X. Chen, H. Häkkinen and T. Pradeep, J. Phys. Chem. C, 2014, 118, 21722–21729 CAS.
- Y. Negishi, R. Arai, Y. Niihori and T. Tsukuda, Chem. Commun., 2011, 47, 5693–5695 RSC.
- A. R. West, Solid state chemistry and its applications, Wiley, Chichester [West Sussex], New York, 1989 Search PubMed.
- M. Farrag, M. Tschurl and U. Heiz, Chem. Mater., 2013, 25, 862–870 CrossRef CAS.
- B. A. Ashenfelter, A. Desireddy, S. H. Yau, T. Goodson and T. P. Bigioni, J. Phys. Chem. C, 2015, 119, 20728–20734 CAS.
- J. Guo, S. Kumar, M. Bolan, A. Desireddy, T. P. Bigioni and W. P. Griffith, Anal. Chem., 2012, 84, 5304–5308 CrossRef CAS PubMed.
- J.-M. Lamarre, F. Billard, C. H. Kerboua, M. Lequime, S. Roorda and L. Martinu, Opt. Commun., 2008, 281, 331–340 CrossRef CAS.
- V. Bonacic-Koutecky, A. Kulesza, L. Gell, R. Mitric, R. Antoine, F. Bertorelle, R. Hamouda, D. Rayane, M. Broyer, T. Tabarin and P. Dugourd, Phys. Chem. Chem. Phys., 2012, 14, 9282–9290 RSC.
- D. Andrae, U. Haeussermann, M. Dolg, H. Stoll and H. Preuss, Theor. Chim. Acta, 1990, 77, 123–141 CrossRef CAS.
- F. Weigend and R. Ahlrichs, Phys. Chem. Chem. Phys., 2005, 7, 3297–3305 RSC.
- J. P. Perdew, K. Burke and M. Ernzerhof, Phys. Rev. Lett., 1996, 77, 3865–3868 CrossRef CAS PubMed.
- T. Yanai, D. P. Tew and N. C. Handy, Chem. Phys. Lett., 2004, 393, 51–57 CrossRef CAS.
- L. Frediani, Z. Rinkevicius and H. Ågren, J. Chem. Phys., 2005, 122, 244104 CrossRef PubMed.
- P. Norman, Phys. Chem. Chem. Phys., 2011, 13, 20519–20535 RSC.
- P. N. Day, K. A. Nguyen and R. Pachter, J. Chem. Theory Comput., 2010, 6, 2809–2821 CrossRef CAS PubMed.
Footnote |
| † Electronic supplementary information (ESI) available: PAGE for Ag(SG) clusters, ESI MS of the clusters in the negative ion mode, XRD patterns of Ag(SG) nanoclusters. Optical absorption and fluorescence spectra of the three cluster sizes, TPEF spectrum of Ag31(SG)19 with its absorption spectrum. TPA cross-section measurements using the P-scan technique. Two-photon emission spectra at different pump powers for Ag(SG) clusters. See DOI: 10.1039/c6nr07989j |
| This journal is © The Royal Society of Chemistry 2017 |