 Open Access Article
Creative Commons Attribution 3.0 Unported Licence
The first electrochemical and surface analysis of 2-aminobenzimidazole as a corrosion inhibitor for copper in chloride solution
Klodian
Xhanari
 ab and
Matjaž
Finšgar
 *a
*a
aUniversity of Maribor, Faculty of Chemistry and Chemical Engineering, Smetanova ulica 17, 2000 Maribor, Slovenia. E-mail: matjaz.finsgar@um.si; Tel: +386 2 2294 447
bUniversity of Tirana, Faculty of Natural Sciences, Boulevard “Zogu I”, 1001 Tirana, Albania
First published on 9th June 2017
Abstract
For the first time, 2-aminobenzimidazole (2-ABI) was tested as a corrosion inhibitor for copper in 3 wt% NaCl solution at 25 °C using cyclic voltammetry (CV), chronopotentiometry, electrochemical impedance spectroscopy (EIS), and potentiodynamic curve (PD) techniques. The EIS measurements indicated that the corrosion of Cu in the presence of 2-ABI followed kinetic- and diffusion-controlled processes. After 100 h of immersion, the potentiodynamic curves showed that 2-ABI acts as a mixed-type inhibitor, with a predominant action on the anodic corrosion reaction. ATR-FTIR confirmed the adsorption of 2-ABI on the Cu surface, which resulted in increased hydrophobicity of the copper surface and reduced its surface roughness.
1 Introduction
Copper is extensively used in a wide range of applications, including structures open to the atmosphere, heat exchangers in marine environments, freshwater supply lines, industrial, chemical, and power-generating plant equipment and electronic devices.1,2 The selection of copper is due to the combination of its excellent electrical and thermal conductivity, wide range of attainable mechanical properties, and its ease of fabrication, joining, and soldering. In addition, copper shows resistance to biofouling.1,3 Although the corrosion rates of copper in non-oxidizing acids, water, and unpolluted air are negligible, its corrosion susceptibility increases in oxidizing acids, oxidizing heavy-metal salts, sulfur, ammonia, and chloride-containing solutions.2,4 Different approaches have been considered to minimize the corrosion of copper,5–7 among which the use of organic corrosion inhibitors is by far the one most frequently explored.4,8 Azoles have been extensively tested as corrosion inhibitors for copper in different solutions9–13 due to the presence of N-atoms in a five-membered ring as potential adsorption centers. The azole compounds inhibit the corrosion of copper by adsorbing on the metal surface through the free electron pairs in these atoms. Benzotriazole and imidazole derivatives are the two main groups of azole compounds that have been tested in particular as corrosion inhibitors for copper in chloride-containing solutions. Benzotriazole (BTAH) is well known for its corrosion inhibition efficiency for copper in various solutions,4 including also chloride-containing solutions.14–20 The adsorption of BTAH on the copper surface and the formation of the Cu(I)BTA complex was reported to be the main inhibition mechanism for this compound.4 Several BTAH derivatives have also been investigated as corrosion inhibitors for copper in chloride-containing solutions.18,21,22The same inhibition mechanism as for BTAH (adsorption followed by the formation of the surface complex) was proposed for imidazole.8 The influence of different substitution groups on the inhibition efficiency of imidazole derivatives was also investigated.23–25 Otmačić and Stupnišek-Lisac25 investigated the inhibition efficiency of imidazole and its derivatives, i.e. 4-methylimidazole, 4-methyl-1(4-methoxyphenyl)imidazole, 1-(p-tolyl)-4-methylimidazole, and 1-phenyl-4-methylimidazole in sodium chloride solutions. They concluded that the inhibition efficiency increased with increasing molecular weight and with the presence of the phenyl ring. The inhibition of the last two imidazole derivatives increased with increasing pH, due to the stronger adsorption of the neutral imidazole molecule, as expected at high pH values.24 The higher efficiency of the mercapto-substituted imidazoles is connected to the stronger bond they form with the surface due to their tendency to deprotonate upon adsorption.23
Herein, 2-aminobenzimidazole (2-ABI) was tested in chloride-containing solution and the results were compared to previous studies of 1-hydroxybenzotriazole (BTAOH) and BTAH,14 2-mercaptobenzimidazole (MBIH),26,27 2-mercaptobenzoxazole (MBOH),28 2-mercaptobenzothiazole (MBTH),29 and 4-methyl-2-phenyl-imidazole (MePhI),30 performed under similar conditions. 2-ABI is a benzimidazole (BI) derivative consisting of a combination of a benzene and an imidazole ring in which one hydrogen atom is substituted by an amine group. Fig. 1 shows the structures of 2-ABI and the above-mentioned azole compounds.
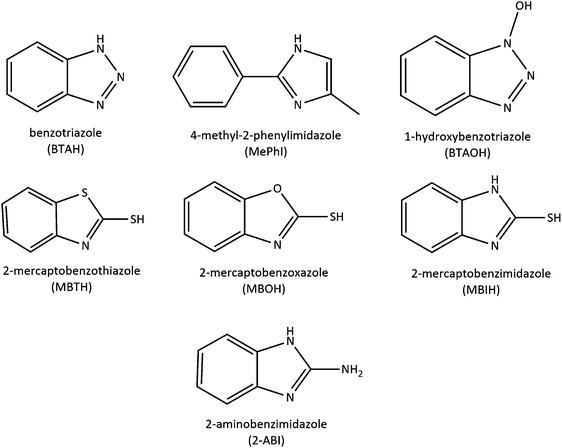 | ||
| Fig. 1 The structures of 2-ABI and the other azole compounds previously tested as corrosion inhibitors for copper under similar conditions.14,26–30 | ||
The first reports concerning the use of 2-ABI as a corrosion inhibitor are for 70–30 brass in 1.0 M ammonia solution.31,32 The authors reported that 2-ABI acted as a mixed-type inhibitor and attributed its inhibition action to the formation of a protective film of Cu(II) and Zn(II) complexes on the brass surface.31
2-ABI has been tested mainly as a corrosion inhibitor for steel in acidic33–36 and chloride-containing solutions.37–39 Popova et al.36 compared 2-ABI with BI and MBIH as corrosion inhibitors for mild steel in 1 M HCl solution. They reported that 2-ABI demonstrated the highest inhibition efficiency and chemisorbed on the steel surface. A bond is formed between the free electrons of nitrogen in the imidazole ring in 2-ABI and the vacant d-orbitals in iron.33,36 However, Zhang et al.33 reported a combination of physisorption and chemisorption as the possible adsorption mechanism for 2-ABI on mild steel in 1 M HCl solution. The same adsorption mechanism was previously reported by Ghanbari et al.35 for 2-ABI on mild steel in 1 M H3PO4 solution. Based on potentiodynamic polarization measurements, they concluded that 2-ABI acted as a mixed-type inhibitor in both acid solutions.33,35 Finšgar et al.39 reported that 2-ABI showed corrosion inhibition for mild steel in 3 wt% NaCl solution at 25 °C, but not at 70 °C. At both temperatures, the corrosion inhibition efficiency increased with the addition of KI. The corrosion inhibition of 2-ABI for steel in 2.5 and 3.5 wt% NaCl solutions was found to be higher compared with 5-(p-tolyl)-1,3,4-triazole.38 The authors attributed this to the planar orientation of 2-ABI facilitating the coverage of the metal surface.
A 3 wt% NaCl solution is a highly corrosive environment, and the resulting higher corrosion rates more starkly evidence the inhibition action of the inhibitor to be tested. Hitherto, to the best of our knowledge, this is the first study reporting the inhibition efficiency of 2-ABI in the corrosion of copper in chloride-containing solutions. The selected corrosion inhibitor concentration (1 mM) is close to the 0.1 wt% inhibitor concentration that is frequently employed for corrosion tests in industry.40 In addition, the 1 mM inhibitor concentration chosen will enable direct comparison of 2-ABI with other azole compounds tested previously as corrosion inhibitors for copper in 3 wt% NaCl solution.14,26–30
The aim of this work is to investigate the inhibition efficiency of 2-ABI in the corrosion of copper in 3 wt% NaCl solution at room temperature. First, CV measurements were performed after a short period of immersion (1 h) to understand the influence of 2-ABI on the oxidation and reduction behavior of copper immersed in 3 wt% NaCl solution. Next, EIS was employed to investigate the corrosion mechanism of copper in the presence of 2-ABI after a long period of immersion (up to 100 h). The inhibitor type was defined using PD measurements. Finally, surface analyses (i.e. ATR-FTIR contact angle, 3D-profilometry and FE-SEM measurements) were performed in order to prove the adsorption of 2-ABI and its influence on the surface roughness and hydrophobicity of the copper samples.
2 Experimental
2.1 Sample and solutions preparation
Copper (99.999% purity) in the form of 2 mm thick foil, temper Half Hard, was supplied by Goodfellow (Cambridge, UK). The copper samples used for the immersion tests were cut into rectangular shapes with dimensions of 50 mm × 20 mm × 2 mm and used for immersion tests. Disc-shaped samples with a diameter of 15 mm were cut out and used for the electrochemical measurements. The sample preparation procedure, including grinding and cleaning in an ultrasonic bath (with a 50 vol% ethanol/50 vol% ultrapure water mixture) is the same as reported previously.14,27–302-ABI with purity >99 wt% was supplied by Acros Organic (New Jersey, USA), while NaCl and ethanol (for analysis-ACS quality) were supplied by Carlo Erba Reagents (Milan, Italy). All of the 3 wt% NaCl solutions with and without the addition of 1 mM 2-ABI were prepared using ultrapure water (with a resistivity of 18.2 MΩ cm) obtained from Milli-Q, Millipore Corporation (Massachusetts, USA). All the experiments were carried out at 25 °C.
2.2 Immersion tests
The samples prepared as described above were weighed before being immersed in closed vials (volume of 100 mL) in a non-stirring 3 wt% NaCl solution with or without the addition of 1 mM 2-ABI for 31 days at 25 °C. In order to avoid crevice corrosion, the samples were in contact with the vial only at the four edges. At the end of the immersion period, the samples were first treated as described before27–30,39 and then weighed again. The average mass loss was calculated based on three replicate measurements. Possible outliers were checked according to ref. 41 but none was detected.2.3 Electrochemical measurements
The electrochemical measurements were performed in a closed-to-air, three-electrode cell, under stagnant conditions at 25 °C, using the same equipment and reference and counter electrodes as described before.27,28,30 The working electrode consisted of a disc-shaped sample embedded in a Teflon holder, with a 1 cm2 area exposed to the solution. All potentials reported herein refer to the saturated calomel electrode, SCE (0.244 V vs. SHE). CV measurements were performed after 1 h of immersion in the potential range from −0.800 V to 1.000 V vs. SCE using a potential scan rate of 20 mV s−1. Chronopotentiometry measurements were performed starting from the moment of immersion and in between the EIS measurements. The EIS spectra were recorded at different immersion times (1, 3, 5, 10, 30, 50, and 100 h) in the frequency range from 1 MHz to 5 mHz using 10 points per decade and a 10 mV (peak to peak) amplitude of the excitation signal at the open circuit potential, Eoc. The EIS response obtained was fitted based on equivalent electrical circuits (EECs), using the Gamry EChem Analyst software. At least three replicate measurements were performed and the average values are presented after discarding outliers using Grubb's chemometric test.41 The potentiodynamic curve (PD) measurements started at −0.250 V vs. Eoc after 100 h of immersion. A potential scan rate of 0.1 mV s−1 was employed to increase the potential in the anodic direction. Three replicate measurements were performed in each case and the most representative curve was reported.2.4 Surface characterization
Contact angle and attenuated total reflectance Fourier transform infrared spectroscopy (ATR-FTIR) measurements were performed on the disc-shaped samples after immersion for 1 h in 3 wt% NaCl solution with and without the addition of 1 mM of 2-ABI. After immersion, the samples were rinsed with ultrapure water and dried under a stream of nitrogen. The contact angles were measured using a Krüss DSA 20 tensiometer (Krüss GmbH, Hamburg, Germany). Drop shape analysis software was used to determine the contact angle of a deionized water drop on the surface of the samples. The average value of at least three replicate measurements for samples immersed in 3 wt% NaCl solution, with and without the addition of 1 mM 2-ABI, was reported (possible outliers were checked according to ref. 41 but none was detected). A Shimadzu IRAffinity-1 (Colombia, MD, USA) spectrometer was used to perform the ATR-FTIR analysis.Additional surface characterization of the copper samples immersed for 31 days in 3 wt% NaCl solution, with and without the addition of 1 mM 2-ABI was performed through 3D-profilometry measurements and field emission scanning electron microscopy (FE-SEM) analysis. The surface topography of the copper samples was investigated using a profilometer, model Form Talysurf Series 2 (Taylor Hobson), with a vertical resolution of about 5 nm. A spot size of 4 mm2 was analyzed. The data were processed using TalyMap Gold 4.1 software and the average surface roughness was calculated. In addition, the surface profile was created. The general geometrical shape and possible measurement-induced misfits were corrected to level the profile.27,28 Several measurements in parallel directions 10 μm apart were combined to obtain the topography of the surface. A Supra 35 VP (Carl Zeiss, Germany) FE-SEM was employed to analyze the surface morphology of the copper samples.
3 Results and discussion
3.1 Immersion tests
The copper samples immersed in 3 wt% NaCl solution containing 1 mM 2-ABI showed mass gain after 31 days. This is most likely a result of deposition of corrosion products on the sample surface, which were not possible to remove with the procedure used. However, the fact that no mass loss was measured after such a long immersion time is an indication of the high corrosion inhibition efficiency of 2-ABI. The latter was further investigated using electrochemical techniques.3.2 CV measurements
The cyclic voltammograms of the copper samples after 1 h of immersion in 3 wt% NaCl solution with and without the addition of 1 mM 2-ABI are presented in Fig. 2. Two anodic peaks at 0.342 V and 0.503 V vs. SCE and one cathodic peak at −0.460 V vs. SCE were observed for copper immersed in 3 wt% NaCl solution.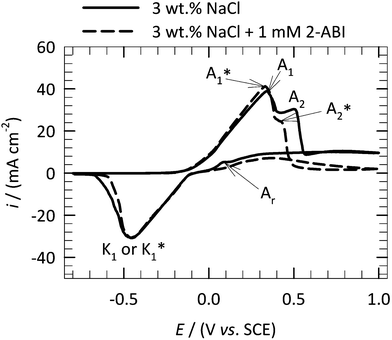 | ||
| Fig. 2 CV curves for copper samples immersed in 3 wt% NaCl solution at 25 °C with and without the addition of 1 mM of 2-ABI obtained with a 20 mV s−1 potential scan rate. | ||
The first anodic peak, A1, as designated in Fig. 2, indicates the formation of CuCl according to the electrochemical reaction shown in eqn (1).
| Cu + Cl− ⇄ CuClads + e− | (1) |
| CuClads + Cl− ⇄ CuCl2− | (2) |
| CuCl2− ⇄ Cu2+ + 2Cl− + e− | (3) |
When 1.000 V vs. SCE was reached, the potential shifted to the cathodic direction. A small anodic reactivation peak, Ar, at 0.091 V vs. SCE was observed. This peak can be formed either as a result of the oxidation of the patches of non-oxidized copper in the forward scan, or due to the formation of a poorly protective film in the forward scan, which enabled further oxidation even though the cathodic scan direction was applied.17 At even more negative potentials, it is possible that either cuprous chlorides or Cu2+ undergo reduction. The soluble Cu2+ species leave the electrode surface, while cuprous chlorides accumulate.42,43 Therefore, the only cathodic peak, K1, observed at −0.460 V vs. SCE, is related to the reduction of CuCl2− or CuCl.17,30
No significant change in the first current anodic peak, A1, was observed when 1 mM 2-ABI was added to the 3 wt% NaCl solution. In fact, the first peak in the inhibited solution, denoted as A1*, was detected at 0.336 V vs. SCE. This indicates that the addition of 2-ABI does not inhibit the Cu(I) formation. As the potential increases towards more positive values, the second current anodic peak, A2*, in the inhibited solution is detected at 0.430 V vs. SCE. The observed decrease in the A2* peak (inhibited solution) compared to the A2 peak (non-inhibited solution), indicates that less Cu(II) is formed in the presence of 2-ABI. The current plateau in the inhibited solution is less intense, demonstrating that the corrosion of copper was inhibited by the formation of a 2-ABI surface layer on its surface (presumably a Cu(I)–2-ABI complex was formed). Moreover, no reactivation peak was observed for the inhibited solution most likely due to full coverage of the surface, leaving no possibility of Cu oxidation.
One cathodic peak, K1*, was detected in the cathodic scan. The cathodic peak in the inhibited solution has the same intensity and peak potential position as the cathodic peak of the non-inhibited sample. However, a lower cathodic peak area (less electric charge passed) was observed, meaning that less Cu(I) was formed in the anodic scan, due to the inhibition process. This implies that the addition of 2-ABI does influence the formation of Cu(I).
3.3 Chronopotentiometric measurements
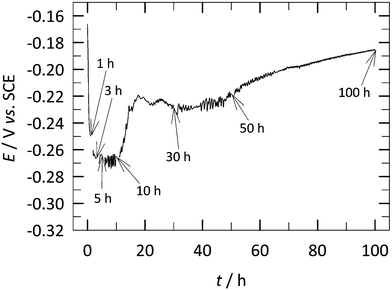
The E vs. t measurements for the copper samples performed from the moment of immersion in 3 wt% NaCl solution containing 1 mM 2-ABI over 100 h of immersion are presented in Fig. 3. These measurements were performed in between the EIS measurements (at 1, 3, 5, 10, 30, 50, and 100 h of immersion), which is reflected in the discontinuous chronopotentiometric curve (indicated in Fig. 3). No significant change in the potential was observed after the EIS measurements.A decrease in the potential was observed at the moment of copper immersion in the solution containing 2-ABI. The potential stabilized (no significant change was observed) between 1 and 10 h of immersion.
A significant increase in the potential was observed after 10 h of immersion. This potential increase was more pronounced between 10–30 h and after 50 h of immersion. After 100 h of immersion (before starting the PD measurement), a potential of −0.185 V vs. SCE was measured. The addition of 2-ABI to the 3 wt% NaCl solution, after 100 h of immersion, caused a shift in the potential of the copper samples to more positive values. The potential of the copper samples immersed in non-inhibited 3 wt% NaCl solution was previously reported to be −0.263 V vs. SCE.30 This potential shift is also an indication of the corrosion inhibition efficiency of this compound, which acts as an anodic-type inhibitor, making the whole system nobler.
3.4 EIS measurements
Fig. 4 shows the EIS spectra measured after 1 h, 3 h, 5 h, 10 h, 30 h, 50 h and 100 h, at 25 °C, for copper samples immersed in 3 wt% NaCl solution containing 1 mM 2-ABI. The relatively long immersion time employed allows the achievement of a steady-state condition needed for the EIS spectra to be valid.44 EIS measurements for pure Cu immersed in non-inhibited 3 wt% NaCl solution were reported before.27 | ||
| Fig. 4 The measured (dotted symbols) and fitted (solid line) EIS measurements for copper in 3 wt% NaCl solution at 25 °C containing 1 mM 2-ABI after 1, 3, 5, 10, 30, 50, and 100 h of immersion. The EIS response was fitted using the EEC model represented in Fig. 5. | ||
The EIS response of copper samples immersed in 2-ABI shows different behaviors in high (10–1000 kHz), middle (1–1000 Hz), and low (below 1 Hz) frequency regions (Fig. 4). Typical resistor behavior is observed in the high frequency region when a horizontal amplitude is reached (Fig. 4b), while the phase angle approaches 0° (Fig. 4c). The behavior in this case is attributed to an uncompensated resistance, RΩ, where the solution resistance has the largest contribution. In the middle region, a linear relationship between |Z| and f is observed (Z and f are impedance and frequency, respectively). The slope of the response in this area is close to −1 (Fig. 4b) and the phase angle approaches −90° (Fig. 4c). These indicate typical capacitor behavior. In the low frequency region, no horizontal amplitude is observed, which would indicate the presence of diffusion and/or adsorption/desorption processes.14,27,28,30,44,45 Moreover, the low frequency region of the 2-ABI-inhibited samples after 100 h of immersion is shifted two orders of magnitude higher compared with the same region of the EIS spectra for copper in non-inhibited 3 wt% NaCl solution reported previously.27 This is another indication of the corrosion inhibition efficiency of 2-ABI for copper in 3 wt% NaCl solution. After 100 h of immersion, the low frequency region of the Bode plots (Fig. 4b) suggested similar resistive behaviour (similar |Z| values) of 2-ABI-inhibited samples compared with those inhibited by MePhI.30 Higher |Z| values (a more resistive system) were observed for the same copper samples immersed in 3 wt% NaCl solution containing MBOH,28 MBTH,29 and MBIH.27
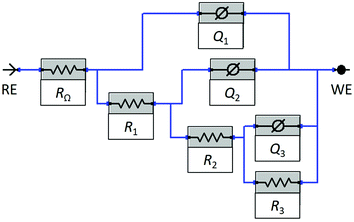
As described above, three relaxation processes were taken into consideration for the fitting procedure, including diffusion. No additional relaxation process was taken into consideration as it was not possible to separate it from the other processes. The EIS response of copper immersed in 3 wt% NaCl solution containing 1 mM 2-ABI was fitted using the nested equivalent electrical circuit (EEC) model RΩ(Q1(R1(Q2(R2(Q3R3))))) shown in Fig. 5. The same EEC model (or RΩ(Q1(R1(Q2(R2W)))), where W represents the element for the unrestricted diffusion) was used by Van Ingelgem et al.45 to fit the EIS results for copper immersed in non-inhibited 0.4–0.6 M NaCl solutions. This EEC model is used to fit the response of an electrode coated with a porous layer.46–49 Similarly, three relaxation processes were considered for copper inhibited by MBIH.27 In contrast, four relaxation processes were taken into account in the case of MBOH- and MePhI-inhibited copper samples.28,30
The selected EEC model (Fig. 5) consists of three relaxation processes in series with the uncompensated resistance, RΩ. The solution resistance is the main contributor to the RΩ. The impedance of the constant phase element (CPE), described by Q (the non-ideal capacitance), is given by eqn (4):50
| Z(CPE) = (Q(jω)n)−1 | (4) |
The first relaxation process, R1Q1, characterizes the surface layer, which consists of a combination of the Cu2O passive layer and the adsorption of 2-ABI on the surface of the copper samples. The second relaxation process, R2Q2, describes the charge transfer resistance, R2, and the double-layer capacitance (described by Q2). The diffusion of the ionic species (Cu2+) from the metal surface to the bulk solution is described by the third relaxation process, R3Q3. A detailed explanation of why this is described in such a manner is given below. The average values obtained by fitting the EIS response using the EEC model in Fig. 5 are presented in Table 1. The capacitance (C) values are calculated from the respective Q values according to eqn (5):
| Cx = (RxQx)1/nx/Rx | (5) |
| Immersion time [h] | χ 2 | R Ω | n 1 | R 1 | Q 1 | n 2 | R 2 | Q 2 | n 3 | R 3 | Q 3 |
|---|---|---|---|---|---|---|---|---|---|---|---|
| 1 | 0.25 | 9.6 | 0.90 | 4.48 | 5.97 | 0.67 | 8.07 | 37.92 | 0.51 | 12.56 | 346.30 |
| 3 | 0.20 | 9.7 | 0.91 | 4.34 | 5.78 | 0.65 | 7.61 | 23.30 | 0.54 | 7.92 | 256.80 |
| 5 | 0.20 | 9.7 | 0.92 | 3.27 | 5.22 | 0.66 | 5.83 | 20.23 | 0.51 | 10.48 | 218.30 |
| 10 | 0.24 | 9.9 | 0.92 | 4.53 | 3.77 | 0.66 | 6.19 | 15.54 | 0.51 | 13.50 | 172.30 |
| 30 | 0.55 | 11.1 | 0.84 | 2.96 | 5.56 | 0.64 | 7.58 | 22.21 | 0.53 | 44.38 | 194.50 |
| 50 | 0.60 | 11.5 | 0.86 | 1.10 | 4.01 | 0.64 | 10.70 | 11.48 | 0.53 | 48.53 | 169.10 |
| 100 | 0.93 | 11.8 | 0.86 | 0.53 | 3.08 | 0.65 | 5.19 | 34.67 | 0.53 | 86.94 | 102.30 |
Fig. 6a presents the variation of the surface layer (C1) and double-layer capacitance (C2) with increasing immersion time from 1 to 100 h. The calculation of C3 was not relevant in this case since Q3 describes unrestricted diffusion, as confirmed by the value of n3 being close to 0.5 (Table 1). The higher the impedance of the diffusion process the slower the diffusion process occurs.27Table 1 shows that the Q3 value decreases with increasing the immersion time. This implies that the diffusion of the ionic species travelling through the surface layer is restricted due to the increase of the surface layer thickness with increasing immersion time (as can be seen below from the variation of the C1 values with immersion time).
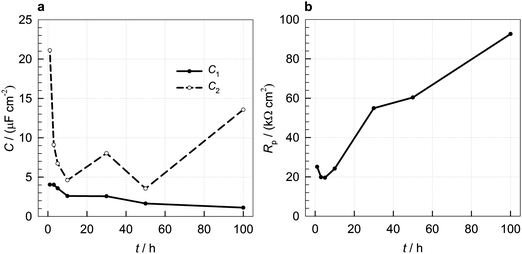 | ||
| Fig. 6 Variation of (a) capacitance (C) and (b) Rp values with increasing immersion time for copper samples immersed in 3 wt% NaCl solution at 25 °C containing 1 mM 2-ABI. | ||
The thickness of the surface layer, d, is inversely proportional to the surface layer capacitance, C1, as given in eqn (6):
 | (6) |
The C1 values calculated according to eqn (5) decrease with increasing immersion time (Fig. 6a), which implies an increase of the surface layer thickness. This increase is connected to the Cu2O passive layer and the adsorption of the 2-ABI on the copper surface.
The double-layer capacitance is connected to the active part of the surface area. The higher this capacitance, the smaller the surface covered by the corrosion inhibitor or oxide.51 The C2 values decrease up to 10 h of immersion, due to the adsorption of 2-ABI, which covers the active parts on the copper surface. Then, the double-layer capacitance increased between 10 and 30 h of immersion and decreased again between 30 and 50 h of immersion. An increase in C2 was observed after 50 h of immersion. This behaviour is most likely connected with the competitive process of corrosion, which opens the active surface area, the formation of copper oxides, and the adsorption of the corrosion inhibitor, which covers the active surface area with increasing immersion time.
The resistance of the copper samples to general corrosion can be evaluated from the polarization resistance, Rp. The higher the Rp, the more resistant the metal. Fig. 6b presents the variation of Rp (Rp = R1 + R2 + R3) with immersion time. No significant change in the Rp was observed for up to 5 h of immersion, and after that the polarization resistance increased with immersion time, showing the improved corrosion resistance of such a system with increasing immersion time and proving the corrosion inhibition ability of 2-ABI.
3.5 PD curve measurements
The potentiodynamic curves for the copper samples after 100 h of immersion in 3 wt% NaCl solution at 25 °C containing 1 mM 2-ABI are presented in Fig. 7. The PD curve of the non-inhibited copper samples immersed in 3 wt% NaCl solution, presented previously,14 is given for comparison. In order to avoid the effects of capacitance and to ensure that the current/voltage relationship only reflects the interfacial corrosion process at every potential of the polarization scan, a scan rate of 0.1 mV s−1 was employed.44,52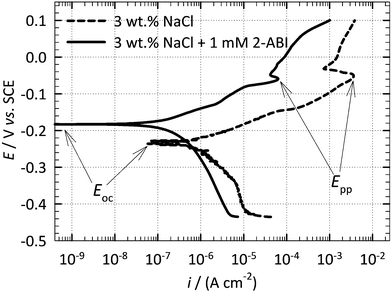 | ||
| Fig. 7 PD curve measurements for copper samples after 100 h of immersion in 3 wt% NaCl solution at 25 °C containing 1 mM 2-ABI compared with the non-inhibited samples.14 | ||
In the studied solutions, hydrogen ions and dissolved oxygen are the only species that can be reduced in solution. The PD curve measurements were started at high potential values (−0.250 V vs. Eoc), at which the cathodic potentiodynamic behaviour of copper is determined by hydrogen evolution.45 The mass-transport-controlled reduction of dissolved oxygen characterizes the potentiodynamic behaviour for potential values closer to Ecorr. Bacarella et al.53 suggested that at more positive potentials than Ecorr, anodic electrodissolution of copper from Cu to Cu(I) occurs and CuCl is formed according to eqn (1). Soluble CuCl2− is then formed when CuCl reacts with Cl− according to eqn (2). The formed CuCl2− diffuses from the outer Helmholtz plane into the bulk solution.53,54 A linear relationship between the potential and log![[thin space (1/6-em)]](https://www.rsc.org/images/entities/char_2009.gif) i is observed in the active part of the curve. The linearity is interrupted when the primary passivation potential, Epp, is reached. At this potential, CuCl starts to predominate as the CuCl2− activity exceeds its solubility. The Epp in the case of non-inhibited copper samples in 3 wt% NaCl was reported to be −0.035 V vs. SCE,14 while for the 2-ABI-inhibited sample this potential was shifted to more negative values (Epp = −0.059 V vs. SCE).
i is observed in the active part of the curve. The linearity is interrupted when the primary passivation potential, Epp, is reached. At this potential, CuCl starts to predominate as the CuCl2− activity exceeds its solubility. The Epp in the case of non-inhibited copper samples in 3 wt% NaCl was reported to be −0.035 V vs. SCE,14 while for the 2-ABI-inhibited sample this potential was shifted to more negative values (Epp = −0.059 V vs. SCE).
The Eoc of the copper samples was shifted to more positive potentials when 1 mM 2-ABI was added into the 3 wt% NaCl solution (Fig. 7), confirming the chronopotentiometric measurements explained above. A decrease in both anodic and cathodic current densities was observed for the 2-ABI-inhibited sample compared with the non-inhibited sample. However, the decrease was more pronounced in the anodic part of the PD curve. In addition, the Ecorr of the samples inhibited with 2-ABI shifted to the anodic direction, while the corrosion current density (icorr) was reduced by about one order of magnitude compared with the non-inhibited sample. In conclusion, 2-ABI acted as a mixed-type inhibitor, with a more pronounced action on the anodic corrosion reaction. The same mixed-type inhibition behavior was also reported previously for MBIH,27 MBOH,28 MBTH,29 and BTAH,14 while BTAOH acted as a weak mixed-type inhibitor.14
3.6 Surface characterization
In order to be able to make a comparison with the results obtained by the electrochemical measurements, the same sample preparation and treatment procedure was used for the surface analysis. Both contact angle and ATR-FTIR measurements were performed after 1 h of immersion. This immersion time allows an analysis of the first few inhibitor layers that were adsorbed on the copper surface. Crystallites of the corrosion inhibitor will form on the surface of the samples for longer immersion times. These crystallites usually have no influence on the corrosion inhibition action of the adsorbed compound.55A significantly higher immersion time, 31 days, was chosen for the topography and morphology measurements of the samples immersed in 3 wt% NaCl solution with and without the addition of 2-ABI in order to induce the corrosion action of the medium used.
![[double bond, length as m-dash]](https://www.rsc.org/images/entities/char_e001.gif) N stretching in the imidazole ring.60 Sudha et al.57 attributed the peak at 907 cm−1 to the C–C–C in-plane bending modes of 2-ABI.
N stretching in the imidazole ring.60 Sudha et al.57 attributed the peak at 907 cm−1 to the C–C–C in-plane bending modes of 2-ABI.
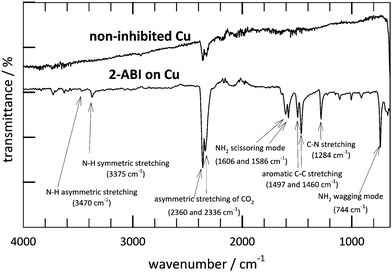 | ||
| Fig. 8 ATR-FTIR spectra of the ground copper sample immersed for 1 h in 3 wt% NaCl solution at 25 °C with and without the addition of 1 mM 2-ABI. | ||
Finally, for both the inhibited and non-inhibited samples two peaks at 2360 and 2336 cm−1 were observed, which can be attributed to the asymmetric stretching of CO2.61 The absence of a broad band between 2600 and 3400 cm−1 related to O–H stretching is an indication that no significant amount of water molecules remained on the surface after the drying procedure.26
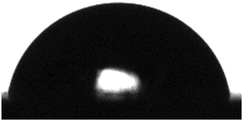
As reported previously,30 the contact angle of the copper samples immersed in non-inhibited 3 wt% NaCl solution was found to be 43.0° ± 4.4°. The hydrophilic nature of the copper samples was significantly reduced by the adsorption of 2-ABI on their surface. In fact, the contact angle of the copper samples immersed in 3 wt% NaCl solution containing 1 mM 2-ABI was found to be 84.8° ± 2.6°. The adsorption of 2-ABI resulted in a more hydrophobic copper sample compared with the adsorption of MePhI reported previously (a contact angle of 68.7° ± 2.9°).30
 | (7) |
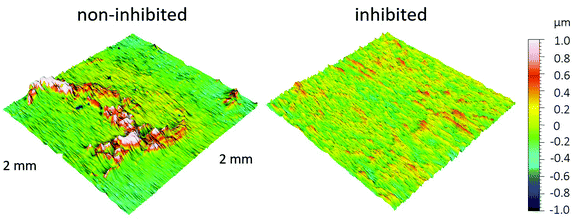 | ||
| Fig. 9 3D profiles of the ground copper samples after immersion for 31 days in 3 wt% NaCl solution, with and without the addition of 1 mM 2-ABI. | ||
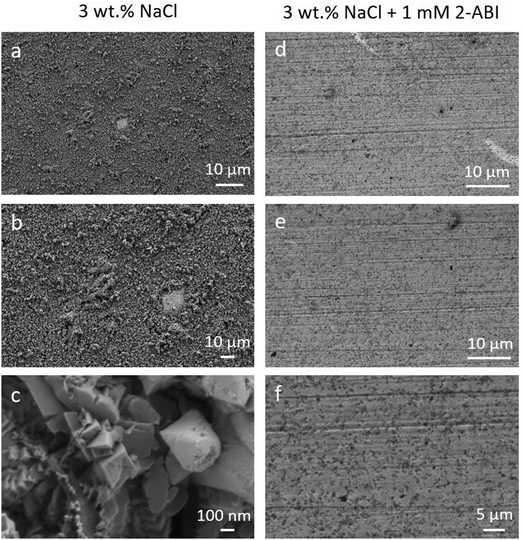
The surface morphology of the copper samples after 31 days of immersion in 3 wt% NaCl solution with and without addition of 1 mM 2-ABI is presented in Fig. 10. As seen in Fig. 10a–c, general corrosion is the main corrosion type for the non-inhibited copper samples and the corrosion products remain on the surface even after rinsing with ultrapure water. A more significantly corroded surface for the non-inhibited samples (Fig. 10a–c) compared with the less rough surface for the 2-ABI-inhibited samples (Fig. 10d–f) was observed. Therefore, FE-SEM analyses are in accordance with the 3D-profilometry measurements (Fig. 9), confirming once more the corrosion inhibition effectiveness of 2-ABI.
4 Conclusions
The influence of 2-ABI as a corrosion inhibitor for copper in 3 wt% NaCl solution at 25 °C was investigated by employing electrochemical and surface analytical techniques. Short-time immersion CV measurements showed that the addition of 2-ABI does not inhibit the oxidation of Cu to Cu(I), but inhibits the oxidation of Cu(I) to Cu(II). 2-ABI acted as a mixed-type inhibitor, with a predominant action on the anodic corrosion reaction. The corrosion of copper in 3 wt% NaCl solution in the presence of 1 mM 2-ABI was found to be under mixed control, following both kinetic- and diffusion-controlled processes. The corrosion resistance of the copper samples in 2-ABI-inhibited solution increased with immersion time. 2-ABI was absorbed on the copper surface, as confirmed by ATR-FTIR. The surface roughness of the samples decreased, resulting in a more hydrophobic surface.Acknowledgements
The authors would like to acknowledge the financial support for this project received from the Slovenian Research Agency (grant numbers: BI-HR/16-17-046 and P2-0032).References
- C. A. C. Sequeira, in Uhlig's corrosion handbook, ed. R. Winston Revie, John Wiley & Sons Inc., New York, 3rd edn, 2011, pp. 757–786 Search PubMed.
- A. Cohen, in ASM Handbook, ed. S. D. Cramer and J. B. S. Covino, ASM International, vol. 13B, 2005, Corrosion Materials Search PubMed.
- R. W. Revie and H. H. Uhlig, Corrosion and corrosion control: an introduction to corrosion science and engineering, John Wiley & Sons, Inc., Hoboken, New Yersey, 4th edn, 2008 Search PubMed.
- M. Finšgar and I. Milošev, Corros. Sci., 2010, 52, 2737–2749 CrossRef.
- A. I. Muñoz, J. G. Antón, J. L. Guiñón and V. P. Herranz, Electrochim. Acta, 2004, 50, 957–966 CrossRef.
- A. L. K. Tan and A. M. Soutar, Thin Solid Films, 2008, 516, 5706–5709 CrossRef CAS.
- C. Liang, P. Wang, B. Wu and N. Huang, J. Solid State Electrochem., 2010, 14, 1391–1399 CrossRef CAS.
- M. M. Antonijević and M. B. Petrović, Int. J. Electrochem. Sci., 2008, 3, 1–28 Search PubMed.
- M. Mihit, K. Laarej, H. Abou El Makarim, L. Bazzi, R. Salghi and B. Hammouti, Arabian J. Chem., 2010, 3, 55–60 CrossRef CAS.
- R. Subramanian and V. Lakshminarayanan, Corros. Sci., 2002, 44, 535–554 CrossRef CAS.
- A. Lalitha, S. Ramesh and S. Rajeswari, Electrochim. Acta, 2005, 51, 47–55 CrossRef CAS.
- H. Bi, G. T. Burstein, B. B. Rodriguez and G. Kawaley, Corros. Sci., 2016, 102, 510–516 CrossRef CAS.
- M. Finšgar, Corros. Sci., 2013, 77, 350–359 CrossRef.
- M. Finšgar, A. Lesar, A. Kokalj and I. Milošev, Electrochim. Acta, 2008, 53, 8287–8297 CrossRef.
- P. F. Khan, V. Shanthi, R. K. Babu, S. Muralidharan and R. C. Barik, J. Environ. Chem. Eng., 2015, 3, 10–19 CrossRef CAS.
- T. Kosec, D. K. Merl and I. Milošev, Corros. Sci., 2008, 50, 1987–1997 CrossRef CAS.
- M. Finšgar, I. Milošev and B. Pihlar, Acta Chim. Slov., 2007, 54, 591–597 Search PubMed.
- J. J. Santana, M. Pähler, W. Schuhmann and R. M. Souto, ChemPlusChem, 2012, 77, 707–712 CrossRef CAS.
- M. M. Antonijević, S. M. Milić and M. B. Petrović, Corros. Sci., 2009, 51, 1228–1237 CrossRef.
- A. M. Abdullah, F. M. Al-Kharafi and B. G. Ateya, Scr. Mater., 2006, 54, 1673–1677 CrossRef CAS.
- L. Tommesani, G. Brunoro, A. Frignani, C. Monticelli and M. Dal Colle, Corros. Sci., 1997, 39, 1221–1237 CrossRef CAS.
- A. Frignani, L. Tommesani, G. Brunoro, C. Monticelli and M. Fogagnolo, Corros. Sci., 1999, 41, 1205–1215 CrossRef CAS.
- N. Kovačević, I. Milošev and A. Kokalj, Corros. Sci., 2015, 98, 457–470 CrossRef.
- H. Otmacic Curkovic, E. Stupnisek-Lisac and H. Takenouti, Corros. Sci., 2010, 52, 398–405 CrossRef CAS.
- H. Otmačić and E. Stupnišek-Lisac, Electrochim. Acta, 2003, 48, 985–991 CrossRef.
- M. Finšgar, Corros. Sci., 2013, 72, 90–98 CrossRef.
- M. Finšgar, Corros. Sci., 2013, 72, 82–89 CrossRef.
- M. Finšgar and D. Kek Merl, Corros. Sci., 2014, 80, 82–95 CrossRef.
- M. Finšgar and D. Kek Merl, Corros. Sci., 2014, 83, 164–175 CrossRef.
- M. Finsgar, Int. J. Electrochem. Sci., 2016, 11, 6775–6790 CrossRef CAS.
- S. K. Bag, S. B. Chakraborty, A. Roy and S. R. Chaudhuri, Br. Corros. J., 1996, 31, 207–212 CrossRef CAS.
- S. K. Bag, S. B. Chakraborty and S. R. Chaudhuri, J. Indian Chem. Soc., 1993, 70, 24–30 CAS.
- W. Zhang, R. Ma, S. Li, Y. Liu and L. Niu, Chem. Res. Chin. Univ., 2016, 32, 827–837 CrossRef CAS.
- M. M. Kabanda, L. C. Murulana, M. Ozcan, F. Karadag, I. Dehri, I. B. Obot and E. E. Ebenso, Int. J. Electrochem. Sci., 2012, 7, 5035–5056 CAS.
- A. Ghanbari, M. M. Attar and M. Mahdavian, Mater. Chem. Phys., 2010, 124, 1205–1209 CrossRef CAS.
- A. K. Popova, M. S. Machkova, A. G. Djambova, A. Zwetanova and S. N. Raicheva, Bulg. Chem. Commun., 2008, 40, 300–305 CAS.
- G. Gece and S. Bilgic, Corros. Sci., 2009, 51, 1876–1878 CrossRef CAS.
- M. Şahin, S. Bilgiç and H. Yılmaz, Appl. Surf. Sci., 2002, 195, 1–7 CrossRef.
- M. Finšgar, B. Petovar, K. Xhanari and U. Maver, Corros. Sci., 2016, 111, 370–381 CrossRef.
- M. Finšgar and J. Jackson, Corros. Sci., 2014, 86, 17–41 CrossRef.
- D. L. Massart, B. G. M. Vandeginste, L. M. C. Buydens, S. D. Jong, P. J. Lewi and J. Smeyers-Verbeke, Handbook of Chemometrics and Qualimetrics: Part A, Elsevier, Amsterdam, 1997 Search PubMed.
- H. P. Lee and K. Nobe, J. Electrochem. Soc., 1986, 133, 2035–2043 CrossRef CAS.
- H. Otmačić, J. Telegdi, K. Papp and E. Stupnišek-Lisac, J. Appl. Electrochem., 2004, 34, 545–550 CrossRef.
- D. C. Silverman, in Uhlig Corrosion Handbook, ed. R. W. Revie, John Wiley and Sons, New York, 2000, pp. 1179–1225 Search PubMed.
- Y. Van Ingelgem, E. Tourwé, J. Vereecken and A. Hubin, Electrochim. Acta, 2008, 53, 7523–7530 CrossRef CAS.
- K. Rahmouni, M. Keddam, A. Srhiri and H. Takenouti, Corros. Sci., 2005, 47, 3249–3266 CrossRef CAS.
- M. E. Orazem and B. Tribollet, Electrochemical Impedance Spectroscopy, John Wiley & Sons Inc., Hoboken, New Jersey, 2008 Search PubMed.
- E. M. Sherif and S.-M. Park, J. Electrochem. Soc., 2005, 152, B428–B433 CrossRef CAS.
- B. Trachli, M. Keddam, H. Takenouti and A. Srhiri, Corros. Sci., 2002, 44, 997–1008 CrossRef CAS.
- I. D. Raistrick, D. R. Franceschetti and J. R. Macdonald, Impedance spectroscopy theory, experiment and application, John Wiley & Sons Inc., Hoboken, New Jersey, 2nd edn, 2005 Search PubMed.
- D. Kek Merl, P. Panjan and J. Kovač, Corros. Sci., 2013, 69, 359–368 CrossRef CAS.
- F. Mansfeld and M. Kendig, Corrosion, 1981, 37, 545–546 CrossRef CAS.
- A. L. Bacarella and J. C. Griess, Journal of Electrochemistry Society, 1973, 120, 459–465 CrossRef CAS.
- D. Tromans and R. H. Sun, Journal of Electrochemistry Society, 1991, 138, 3235–3244 CrossRef CAS.
- M. Finsgar, Anal. Methods, 2015, 7, 6496–6503 RSC.
- E. Pretsch, P. Bühlmann and M. Badertscher, Structure determination of organic compounds, Springer-Verlag, Berlin, Heidelberg, 2009 Search PubMed.
- S. Sudha, M. Karabacak, M. Kurt, M. Cinar and N. Sundaraganesan, Spectrochim. Acta, Part A, 2011, 84, 184–195 CrossRef CAS PubMed.
- G. Socrates, Infrared and Raman characteristic group frequencies: tables and charts, John Wiley & Sons, Chichester, 2004 Search PubMed.
- G. Varsányi and L. Láng, Assignments of vibrational spectra of seven hundred benzene derivatives, Wiley, New York, 1974 Search PubMed.
- M. Silverstein, G. C. Basseler and C. Morill, Spectrometric identification of organic compounds, Wiley, New York, 1981 Search PubMed.
- P. A. Gerakines, W. A. Schutte, J. M. Greenberg and E. F. van Dishoeck, Astron. Astrophys., 1994, 296, 810–826 Search PubMed.
- M. Finšgar, Corros. Sci., 2013, 72, 82–89 CrossRef.
| This journal is © The Royal Society of Chemistry and the Centre National de la Recherche Scientifique 2017 |

