 Open Access Article
Highly selective voltammetric sensing of paracetamol on nanogold modified electrode in the presence of interfering compounds
Teresa
Łuczak

Faculty of Chemistry, Adam Mickiewicz University in Poznań, Umultowska 89 b, 61-614 Poznań, Poland. E-mail: telucz@amu.edu.pl
First published on 23rd May 2017
Abstract
A gold bare template modified with gold nanoparticles deposited on top self-assembled layers (SAMs) results in a high catalytic effect for paracetamol electrooxidation both when paracetamol is alone in solution at pH 7 and in a ternary mixture containing the biogenic interfering compounds ascorbic acid and uric acid. For this novel sensor a linear relationship is found between the current response of paracetamol at the potential of peak maximum (jp) and the concentration of this compound in solution (cACAP) over the range of 0.0001 mM to 2 mM with the detection limit of 0.018 μM. Moreover, the peak to peak separations of the voltammetric responses obtained on the modified electrode confirm that the newly prepared modified gold electrode appears to be a good candidate for the selective detection and analytical determination of paracetamol, ascorbic acid and uric acid in ternary mixtures.
Introduction
Paracetamol [(acetaminophen), ACAP] belongs to a therapeutic class of analgesics that simultaneously act as antipyretic and anti-inflammatory drugs. It is an alternative medicament for people who cannot take aspirin. ACAP has an excellent safety profile when it is applied in proper therapeutic doses. This drug is popular, commonly available and moreover increasingly used. For these reasons it may be easily overdosed, which could make a very serious problem for human health and even life since it may lead to liver and kidney damage.1,2 Therefore, the development of a simple, fast and sensitive method for ACAP detection and determination is an important task from both fundamental and practical points of view in bioscience as well as in medicinal chemistry and has been the subject of an increased number of papers published in the last few years. The literature provides several methods for ACAP determination using spectroscopic,3–6 flow-injection7,8 and chromatographic9,10 methods. However, to date, the most promising methods for ACAP detection and determination seems to be electrochemical sensing techniques. These techniques are extremely rapid, accurate and, above all, do not require the use of toxic solvents. In most electrochemical studies reported, carbon based modified electrodes have been explored. For example, functionalised multiwalled carbon nanotubes (MWCNT)11–17 or graphene18–20 have been used as agents to modify the carbon electrode. Moreover, studies on glassy carbon electrodes modified with poly(caffeic acid),21 polyfuran22 and polycalconcarboxylic acid23 films have been reported. In addition to the different carbon materials used as a template for preparing modified electrodes, the promotion of electron transfer in the electrochemical reaction during ACAP electrooxidation was achieved after the application of gold electrodes covered with polypyrole doped with aszoophloxine.24 Moreover a catalytic oxidation effect was observed during ACAP oxidation on a carbon paste electrode modified with gold nanoparticles.25Since human body fluids contain a large amount of biogenic compounds, among which ascorbic and uric acids reach the highest concentrations,1 the determination of any substance without taking into account the effect of ascorbic acid (AA) and uric acid (UA) is inaccurate. The effect of AA on ACAP detection at carbon modified electrodes has been considered elsewhere.25,26 Although a large number of experimental data are available, the development of novel and easy to synthesize materials capable of simultaneous detection of ACAP in the presence of biogenic molecules is still a challenging task for electrochemists. Knowing that the use of nanoparticles of noble metals can bring a catalytic effect for this process much higher than that on an unmodified electrode,27–29 the aim of this study is to obtain a gold electrode modified with dihydrolipoic acid (DHLA), cysteamine (CA) and gold nanoparticle (NPs-Au) layers and test is electrode electroactivity towards the electrooxidation of ACAP alone in a solution of pH 7 and in a mixture with interfering AA and UA. To date, the literature has not provided evidence of electrocatalytic oxidation and detection of ACAP on materials composed of dihydrolipoic acid, cysteamine and gold nanoparticles.
Experimental
Reagents and solutions
The following chemicals of the purity given in brackets were used: NaH2PO4 (99.99%) and K2HPO4 (99.99%), NaOH (99%), trisodium citrate (99%), H2SO4 (96% extra pure), 30% H2O2 (min. 29%, max. 33%), acetone (99.50%), and C2H5OH (99.9%) were purchased from POCh (Gliwice, Poland). Auric acid (HAuCl4) (99.999%), (±)dihydrolipoic acid (99.9%), cysteamine (≥99%), acetaminophen (≥99%) [Synonyms: 4′-hydroxyacetanilide, 4-acetamidophenol, N-(4-hydroxyphenyl)acetamide, N-acetyl-4-aminophenol, APAP, paracetamol], ascorbic acid (99.9%) and uric acid (99.9%) were obtained from Sigma-Aldrich. Panadol tablets (containing 500 mg of ACAP per tablet) were from GLAXOSMITHKLINE. All solutions were prepared using Millipore Milli-Q-water, and solvents and chemicals were used as received without further purification. All solutions investigated were deaerated by high purity argon (99.998%) before measurements at room temperature.A gold colloidal solution (Au sol) was prepared according to the procedure given in ref. 30. 0.75 cm3 of 0.60% HAuCl4 was added to 50 cm3 of water and heated until boiling. Then, 2.5 cm3 of 1% trisodium citrate was added to the boiling solution with stirring. A typical red wine color was observed after a few minutes. The gold sol was stored in a dark glass at 4 °C.
Samples with mixtures of ACAP, AA and UA were prepared as follows: 1 tablet of Panadol (containing 500 mg of ACAP) was diluted to 0.05 dm3 with 60 mM phosphate buffer solution, pH 7. Then, 0.1 cm3 of this solution, 10 cm3 of a standard solution of ascorbic acid (50 mM) and 10 cm3 of a standard solution of uric acid (50 mM) were added to a 100 cm3 volumetric flask and filled up to the mark with 60 mM phosphate buffer solution, pH 7. In the prepared mixture the concentrations of ACAP, AA and UA were 0.066 mM, 5 mM and 5 mM, respectively.
Instrumentation
Electrochemical measurements were carried out in a conventional three compartment cell separated by glass frits using an Autolab potentiostat/galvanostat analyzer (AUTOLAB PGSTAT 302N, Eco Chemie, B. V., Utrecht, The Netherlands). The pH of the solutions was measured using a pH-meter (Model-ULAB 2002, TELE-ECO-PROJECT, Poland). UV-Vis spectra were obtained using a Cecil instrument (CE 2020, Chemnist, Austria). Reflection–absorption spectra were obtained in a nitrogen atmosphere on a Bruker 66 v/S FT-IR spectrometer with an FT-80 grazing angle infrared reflection accessory and a liquid N2 cooled TGS detector. Typically, 2000 scans with 2 cm−1 resolution were taken. Additionally, for comparison the transmission FT-IR spectrum of the respective substrate was recorded on the same spectrometer. Scanning electron microscopy (SEM) analysis was carried out using a ZEISS EVO 40 instrument (Germany) at an acceleration voltage of 20 kV. Transmission electron microscopy (TEM) images were obtained using a JEM-1200 EX2 (Japan) instrument operating at 200 kV after drying the gold colloidal solution covered with foil strengthened with carbon.Electrodes
The working electrode of 0.07 cm2 geometric area was either the bare gold electrode (labeled as Au electrode) or the gold electrode modified (labeled as Au/NPs-Au electrode) as described below. A gold sheet was used as an auxiliary electrode (2 cm2) and a saturated calomel electrode (SCE) served as the reference electrode.Electrode activation
Before the experiment, the bare gold electrode was polished with aluminum slurries of successively decreasing final grades down to 0.05 μm (Buehler) on polishing cloths (Buehler) and subsequently rinsed with water, acetone and water again. After that the electrode was electrochemically activated in the supporting electrolyte solution (phosphate buffer, 60 mM, pH 7) by scanning the electrode potential (v = dE/dt = 0.1 V s−1) in the potential range between E = −1.0 V and E = 1.0 V versus SCE (that is between the onset of hydrogen and oxygen evolution, respectively) until a stable cyclic voltammogram (acronyms CV or j–E curve) was obtained.In the case of the modified electrodes, at the end of all series of measurements, in order to recover the Au bare electrode, the self-assembled layers were removed from the modified gold template by dipping it for about 5 minutes in Piranha solution, i.e. in a mixture of aqueous solutions of 96% H2SO4 and 30% H2O2 at the volume ratio 3![[thin space (1/6-em)]](https://www.rsc.org/images/entities/char_2009.gif) :
:![[thin space (1/6-em)]](https://www.rsc.org/images/entities/char_2009.gif) 1. Subsequently, the above described procedure of polishing, activation and modification of the bare gold electrode was repeated.
1. Subsequently, the above described procedure of polishing, activation and modification of the bare gold electrode was repeated.
Electrode modification
The modification of the bare gold electrode was carried out in 3 steps. The time of immersion of a given modified template in an appropriate modifying agent in each step was established in preliminary studies.In the first step, a self-assembled layer (SAM) of dihydrolipoic acid was prepared by immersion of the activated Au template in a 10 mM ethanolic solution of this acid, for 4 h. The obtained modified template (Au/DHLA electrode) was washed with water, acetone and water again and dried in an argon stream. In the second step of modification, the Au/DHLA template was immersed in a 0.2 mM solution of cysteamine for 2 h. The obtained Au/DHLA/CA template (Au/DHLA/CA electrode) was washed and dried in the same way as the first step. In the third step of modification, in order to immobilize the gold nanoparticles, the earlier obtained Au/DHLA/CA SAM template was dipped in a gold sol solution at 4 °C for 24 h. Subsequently, the procedure of washing and drying was repeated. The Au/DHLA/CA/NPs-Au electrode prepared according to the above described three-stage process was ready to use in electrochemical measurements. The following electrodes were obtained according to the following scheme:
Au/DHLA electrode: [Au → DHLA acid (4 h)];
Au/DHLA/CA electrode: [Au → DHLA acid (4 h) → CA (2 h)] and
Au/DHLA/CA/NPs-Au electrode: [Au → DHLA acid (4 h) → CA (2 h) →sol Au (24 h)].
Preliminary studies showed, that from these 3 modified electrodes, the highest catalytic effect was obtained for the Au/DHLA/CA/NPs-Au electrode (labeled as the Au/NPs-Au electrode) and therefore, in the next section, only the results obtained for the Au/NPs-Au electrode are presented.
Repeatability and stability of modified electrode
To characterize the repeatability of the prepared modified gold electrode, repetitive measurements were carried out in supporting electrolyte solution (phosphate buffer, 60 mM, pH 7) containing 0.5 mM ACAP. The R.S.D. (%) of the voltammetric responses for 10 successive determinations on the Au/NPs-Au electrode was 2%. Moreover, the stability of the modified electrode was verified by measuring its voltammetric response in the supporting electrolyte solution containing 0.5 mM ACAP everyday for one month. After each daily stability test, the electrode was washed with water, dried in an argon stream and stored in open circuit in tubes without solution. In 4 weeks, the voltammetric response for the 0.5 mM ACAP oxidation decreased by about 4% of the initial response for the prepared Au/NPs-Au electrode. The above facts indicate that both the prepared modified electrode and the proposed method for the determination of ACAP have a good reproducibility and stability.Results and discussion
The gold modified electrode surface
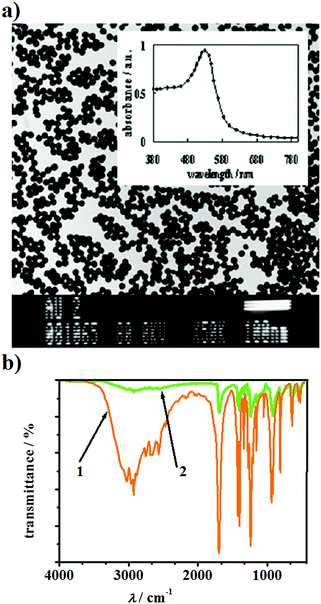
Self-assembling layers on metal surfaces may be formed in two ways.28,31,32 The first way involves attachment of the modifying compounds to a modified template by direct immersion of the template into a solution with the modifying compound. In this case, no binding molecules are used, and the SAM layer is formed via electrostatic, hydrogen or van der Waals interactions. The second way involves the use of modifying agents, which are compounds with atoms characterized by high affinity to the surface atoms of the modified template. When the atoms of the modifying compounds come in contact with the surface atoms of the modified template, strong covalent bonds are developed between them. Admittedly, the second method has an advantage over the first because the strength of the covalent bond exceeds the strength of the other above mentioned types of interactions.33–35The gold sol used in this work, which was obtained by the method described in ref. 30, contains gold nanoparticles with an average diameter of about 16 nm, as evaluated from the transmission electron microscopy image (TEM) in Fig. 1a.
The UV-Vis spectrum of this sol shows only one band with a maximum at λmax = 530 nm. In the sol prepared no aggregation of gold nanoparticles occurs, which is confirmed by the absence of a band at around λ = 680 nm in its spectrum (see inset in Fig. 1a). This is in agreement with the earlier studies.35–38 In the present study, in order to obtain an SAM covered electrode surface, the gold template was modified with NPs-Au and both DHLA and CA, where the two latter compounds serve as binding molecules.33–35 The choice of DHLA was dictated by a the stronger affinity of this compound towards gold and higher extent of dissociation of its carboxyl groups39 as compared to that of the previously studied S-containing alkane acids.35,40Fig. 1b compares the transmission FT-IR spectrum of the liquid DHLA (spectrum 1) with the infrared reflection spectrum of the Au surface with adsorbed molecules of this acid (spectrum 2). The FT-IR spectra clearly indicate the formation of the adsorbate on the Au surface due to the fact that band in the region of 2600–2550 cm−1 assigned to the S–H stretching vibrations modes disappears. The absence of this band in spectrum 2 proves that during the formation of the adsorbate since the S–H bands are broken and the S atoms are directly bonded with the Au surface atoms. This is in accordance with the previously reported information on proton abstraction from alkanethiols adsorbed on a gold surface.33,41–43
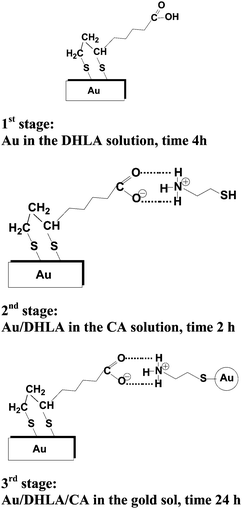
As described in the Experimental section, the basic strategy for the preparation of the SAM layers on the Au template was divided into 3 steps, as illustrated in Scheme 1.
In the first stage of modification of the bare Au electrode, the firm attachment of DHLA to the gold electrode surface is realized by the formation of two covalent bonds between the Au and S atoms after the S–H bonds are split in the DHLA molecule. It is generally accepted that chemisorption of S functionalized compounds on gold is preceded by the oxidative abstraction of hydrogen, which in our case is from S–H bonds, whereas the rest of the modifying molecules create an ordered structure at the electrode which is tilted at angle towards the electrolyte solution.33,44 In the second step of modification, when the Au template covered by an SAM layer of DHLA comes into contact with a solution of CA, the COOH terminated group localized at the end of DHLA layers attached to the gold surface atoms can be easily bonded to the amine group of CA. Comparison of the pKa values of DHLA and CA shows that the carboxylic groups of DHLA (pKa = 4.90)45 are mostly dissociated at pH = 7 of the electrolyte solution and the COO− terminated negatively charged layers of DHLA may favorably interact with the positively charged part (i.e. with the protonated NH3+ group) of CA (pKa = 8.35 and pKa = 10.81).45 Moreover, strong hydrogen bonds can be formed between the carboxylic groups of DHLA and the NH2 group of CA.39 This explains the formation of a stable DHLA-CA complex with the SH group of CA exposed towards the top-side of the expanded monolayer. After the second stage, the obtained Au/DHLA/CA template may be subject to further modification with NPs-Au. The formation of covalent bonds occurs between the S atoms of CA and NPs-Au nanoparticles, as shown in Scheme 1. With the three stages, described above, it was possible to obtain the Au/DHLA/CA/Au-NPs modified electrode with NPs-Au attached on the top of the SAM layer, as shown in Scheme 1.
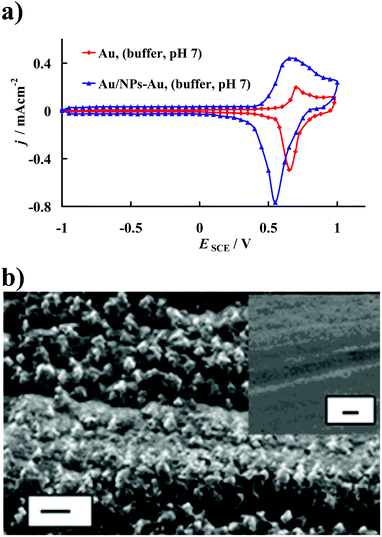
Fig. 2a compares the stable cyclic voltammograms of the bare polycrystalline gold electrode (marked as the Au electrode) with that obtained after modification with DHLA, CA and NPs-Au (marked as the Au/NPs-Au electrode) recorded (after the 2nd scan) in the supporting electrolyte solution, 60 mM phosphate buffer, pH 7. As follows from Fig. 2a in a wide range of potential (E = −0.95 V and E = 0.6 V versus SCE) no faradic processes occur on the electrode surface, only charging/discharging of the double layer takes place. It should be noted that due to the method used for the gold template activation, we did not observe any signals in the j–E curves that may be connected with the gold surface reconstruction process, as described elsewhere.46 The well-defined anodic peaks at E = 0.70 V versus SCE and E = 0.65 V versus SCE, and moreover, cathodic contra-peaks at E = 0.65 V versus SCE and E = 0.55 V versus SCE visible in the j–E curves, recorded in the supporting electrolyte solution using Au and Au/NPs-Au electrodes, are assigned to the formation of gold oxide and its reduction, respectively.47 There is no doubt that the real surface area of the electrode after the modification process increased.48
As a result of the gold electrode modification, the roughness factor (rf), which is calculated as the ratio of the real surface area of the electrode to its geometrical area, changed. The roughness factors of the electrodes used were estimated assuming that the charge of 0.400 mC cm−2 is required for the reduction of a monolayer of oxygen chemisorbed onto a given gold surface during the positive going potential sweep up to the potential of the beginning of oxygen evolution.49 The roughness factors of the used modified and unmodified gold electrodes were estimated to be 3.2 and 1.5, respectively. Taking into account these values, it was found that the real surface area of the modified gold electrode prepared in this work was about 2.2 times greater than that of the unmodified gold electrode. An increase in the roughness factor due to modification of gold template is well visible in SEM images presented in Fig. 2b.
Oxidation of paracetamol at the bare and modified gold electrodes
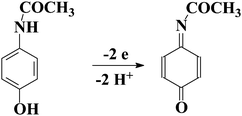
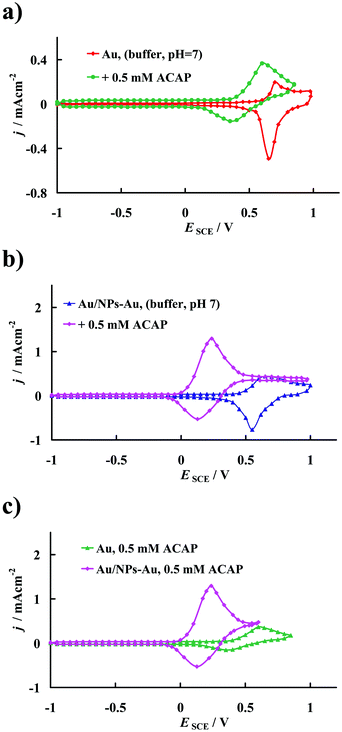
The electrochemical oxidation of ACAP in aqueous solution occurs according to the mechanism adopted in the literature50 which is presented in Scheme 2. According to this mechanism, ACAP is oxidized to the quinone derivative (ACAP-quinone) after the exchange of 2 electrons and 2 protons.Fig. 3a and b present the cyclic voltammetric responses in the presence of 0.5 mM of ACAP at the bare gold electrode (Au) and at the modified gold electrode (Au/NPs-NPs), respectively. For comparison, in Fig. 3a and b, the CVs recorded at a given electrode in pure supporting electrolyte solution are included. Moreover, for clarity Fig. 3c compares the CVs recorded for 0.5 mM ACAP at the electrodes studied in the same experimental conditions.
The evolution of the current densities after successive cycles may be useful to give information about the poisoning of the surface, but in this study the current densities were not altered after successive scans, so the fouling effect of the electrode surfaces was not observed during ACAP electrooxidation. According to Fig. 3a, at the gold electrode, the anodic peak with the maximum at E = 0.6 V versus SCE and with the peak current density jp = 0.367 mA cm−2 as well as the cathodic peak with the maximum at E = 0.35 V versus SCE and with the peak current density jp = −0.154 mA cm−2 are assigned to the quasi-reversible ACAP oxidation to ACAP-quinone. Meanwhile, under the same experimental conditions, for ACPA oxidation at the modified gold electrode, in Fig. 3b the anodic peak reaches the maximum current density at E = 0.237 V versus SCE with jp = 1.295 mA cm−2, whereas the cathodic peak appears at E = 0.127 V versus SCE and the current density obtained in this peak reaches jp = −0.528 mA cm−2. The following analysis of the experimental data will only be for the anodic peak.
According to the electrochemical kinetics theory, in evaluation of the catalytic effect two factors should be considered, the decrease in the overpotential of oxidation and increase in the current density. These phenomena lead to an improvement in the electrocatalytic effect on the kinetics of the electrode reactions.48 The results presented in Fig. 3 prove that the electrode material prepared in this work contributes to achieving a high catalytic effect during ACAP oxidation. This is manifested as a substantial shift in the voltammetric peaks towards the negative potential accompanied by an increase in the current response at the peak maxima in comparison with that characteristic of the bare gold electrode. Taking into consideration the quotient of the current density value observed in the anodic peak, jp and the roughness factor of the modified and unmodified electrodes (3.2/1.5 = 2.2), it was expected that the current density for ACAP electrooxidation on the Au/NPs-Au electrode should be 2.2 times higher than that obtained on the bare Au (it should be equal to about 0.8 mA cm−2); however, it was as high as 1.295 mA cm−2. Meanwhile, it was found that the rate of electron transfer during ACAP oxidation at the potential of the peak maximum on the Au/NPs-Au electrode was about 3.5 fold faster, relative to that on the unmodified Au electrode. This means that besides the increase in the real area of the electrode surface as a result of its coverage with DHLA, CA and NPs-Au during the modification process, another effect must also contribute to the very high jp value attained at the Au/NPs-Au electrode. It is worth emphasizing that such high jp values corresponding to ACAP oxidation may indicate the presence of specific interactions of its molecules with the electrode modified with an SAM layer. Such interactions would decrease the energy barrier for the oxidative electron transfer.48,51 Moreover, as previously reported, sulfur-containing aliphatic carboxylic acids form well-organized monolayers on the bare gold electrode.52,53 Most probably, such a structure ensures the easier migration of reactants through the alkane chains to the electrode surface. This opinion is supported by the observation that the permeability of SAMs increases with higher levels of substrate roughness,54 which was confirmed by infrared reflection–absorption spectroscopy data.55 Nevertheless, the SAM layer effectively protects the metal surface against adsorption of reaction products which poisons the electrode surface. The gold nanoparticles immobilized on the outer side of the SAM Au/DHLA/CA layer attached to the gold surface facilitate accumulation of the substance studied at the electrode/solution interface and efficiently promote tunneling of electrons between the substance analyzed and the electrode surface.56 Thus, modification of the surface electrode not only increases the real electrode surface area but also facilitates charge transfer between the oxidized compound and the gold electrode.
Effect of solution pH and the potential scan rate on the current response of ACAP electrooxidation
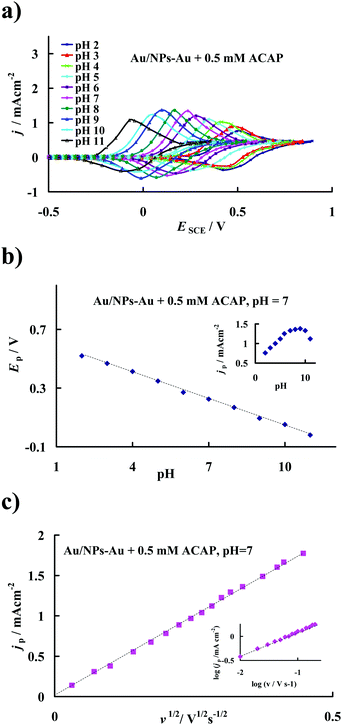
From the obtained set of cyclic voltammograms it was found that the potential of the anodic current peaks attributed to the quasi-reversible oxidation of ACAP to ACAP-quinone shifted towards lower (i.e. less positive values) electrode potentials with an increase in the pH of the investigated solution, as shown in Fig. 4a. According to Fig. 4b, with an increase in pH, the peak potential is negatively shifted. Analysis of the variation of the peak potential Ep with pH of the supporting electrolyte confirms that during the electrode process not only electrons but also protons are released from the ACAP molecules. The linear regression (in the pH range of 2 to 10) provides a slope of 0.060 ± 0.001 V (R2 = 0.998, n = 10) per unit pH. The magnitude of the dEp/dpH slope is very close to the theoretical Nernstian value of 0.059 V and indicates that the number of protons and electrons involved in the oxidation mechanism is the same.48 Furthermore, analysis of the CVs reveals the influence of the solution pH on the current peak density (jp). Maximum current densities were obtained in the pH range between 6 and 9 (see inset in Fig. 4b). However, taking into account the prospective practical application of the modified gold electrode as a sensor in physiological systems, all subsequent experiments were carried out in a buffer solution of pH 7.Scan rate is one of the parameters that significantly affects the electrooxidation of various compounds. In the present study, it was observed that the oxidation peak potentials shift positively with an increase in potential sweep rate. A linear relationship between the current peak density (jp) corresponding to ACAP oxidation and the square root of the scan rate (v1/2) in the buffer solution of pH 7 was obtained for a scan rate in the range of v = 0.001 V s−1 to v = 0.2 V s−1 (Fig. 4c). Analysis of the obtained data using linear regression reveals the slope of d log (jp [mA cm−2])/d log (v [V s−1]) = 0.514 ± 0.02 (R2 ≥0.998; n = 15), (inset in Fig. 4c). From a kinetic point of view, for a purely diffusion controlled process the value of the latter slope should be 0.5, whereas for a purely adsorption controlled process it should be 1.48 Accordingly, the overall rate of ACAP oxidation at the potential of peak maximum under the applied experimental conditions is limited by the diffusion being slower than both the adsorption of ACAP and the following charge transfer at the electrode/solution interface. This relation is favorable for the quantitative determination of ACAP concentration in electrolyte solutions.
Quantitative analysis of ACAP electrooxidation
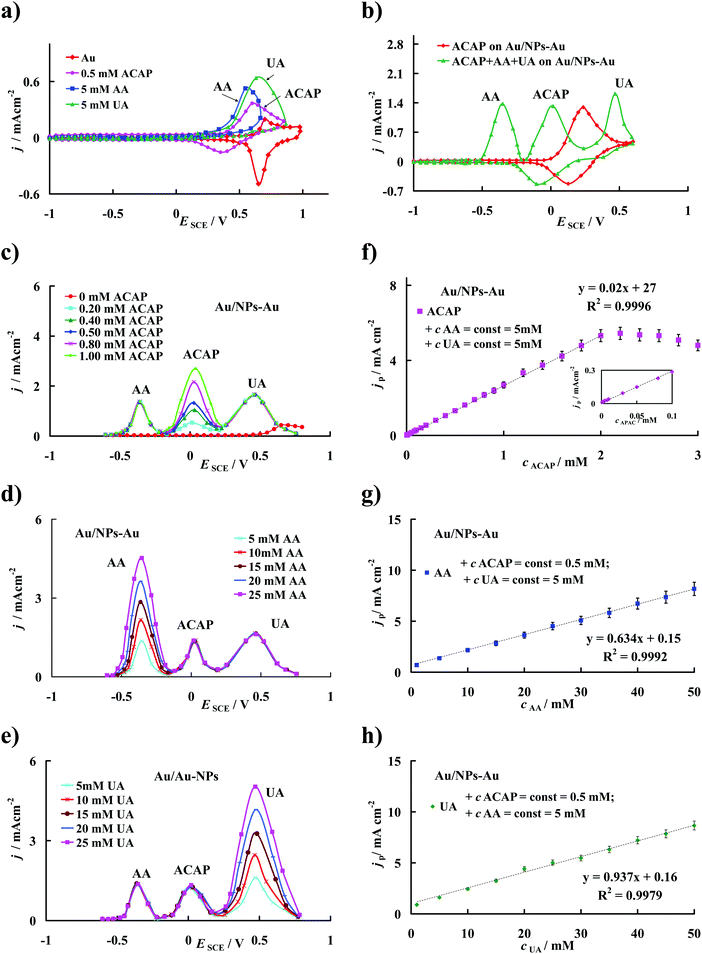
As mentioned above, in the evaluation of the catalytic effect of different electrodes on the electrooxidation process, a decrease in the overpotential of oxidation and an increase in the current density should be considered. Without a doubt, the modified electrode prepared in this work simultaneously satisfies both conditions, thus it appears to be straightforward for analytical application. Since ACAP plays an important role in human life, its accurate quantitative determination is very important. However, as shown in Fig. 5a, precise detection of ACAP on the bare gold electrode is practically impossible in samples containing interfering biogenic compounds such as AA and UA. At the unmodified Au electrode the peak potential separations between ACAP and AA, ACAP and UA and AA and UA are ΔEACAP–AA = 0.03 V, ΔEACAP–UA = 0.05 V and ΔEAA–UA = 0.08 V, respectively, which show that cyclic voltammetric responses of these compounds overlap. This problem disappeared when the gold electrode modified with SAM layers composed of DHLA, CA and NPs-Au prepared in this work was used. It is evident from the CVs in Fig. 5b that the current peaks corresponding to the oxidation of the mentioned compounds coexisting in a buffer solution of pH 7 are clearly separated from each other. When the Au/NPs-Au electrode is applied in the analysis of a ternary mixture containing ACAP, AA and UA, the peak potential separations between ACAP, AA and UA significantly increase and reach the values of ΔEACAP–AA = 0.37 V; ΔEACAP–UA = 0.45 V and ΔEAA–UA = 0.82 V, respectively. Since the gold nanoparticles used herein are stabilized by citrate ions and thus target a negative charge,57,58 it seems reasonable to conclude that their chemisorption on the top of the prepared SAM layers leads to a SAM matrix with an excess of negative charge. Thus, the electrode surface covered with the prepared SAM film should repel anionic species through electrostatic repulsion, whereas cationic species should be attracted. Taking into account the values of pKa = 9.53, pKa = 4.1 and pKa = 5.4 for ACAP, AA and UA, respectively,45 the respective potential shift of the ACAP, AA and UA peak currents may be attributed to the electrostatic attraction and repulsion of ACAP and both AA and UA, respectively, and the negatively charged SAM modified layer.Information on the detection sensitivity of the new Au/NPs-Au modified electrode toward the simultaneous and/or individual determination of ACAP, AA and UA comes from experiments performed with differential pulse voltammetry by changing the concentration of one compound and keeping the concentration of the other two constant. Fig. 5(c–e) display the respective DPV responses of the Au/NPs-Au electrode. The studied ACAP concentration range was from 0.0001 mM to 10 mM, whereas the concentrations of AA and UA were varied from 0.5 mM to 100 mM. Analysis of DPVs reveals that the current peak density (jp) corresponding to the electrooxidation of ACAP to ACAP-quinone is proportional to its concentration (cACAP) over the range of 0.0001 mM to 2 mM at the modified gold electrode, as seen in Fig. 5f. It is worth noting that at the same time, a proportional increase in jp with an increase in concentration of the analyzed compound was observed for the current peak assigned both to AA and UA oxidation in the whole concentration range applied (Fig. 5g and h).
The respective linear regression equations obtained with the correlation coefficient R2 near 1 are given in Table 1. Moreover, the detection limits (cL) of the compounds investigated, which are estimated according to the formula recommended by IUPAC: cL = 3sb/S59 (where, sb is the standard deviation of the current density of the supporting electrolyte solution, S is the slope of the linear jp–cACAP, jp–cAA or jp–cUA dependences), are included in Table 1. It should be emphasized that the lower the detection limit, the lower the analyzed substance concentration that can be detected. There is no doubt that the modified electrode is suitable for the precise determination of ACAP concentration without any interference of AA and UA. For comparison of the cL value obtained with the electrode proposed in this work with that estimated for other modified electrodes see the data summary presented elsewhere.21 From this summary it is evident that the detection limit of ACAP is lower for the Au/NPs-Au electrode used in the present study compared with that found for many other modified electrodes (except the glassy carbon electrode modified with polycalconcarboxylic acid23). Most probably the architecture with the gold nanoparticles, which are covalently immobilized on the top side of the self-assembled Au/DHLA/CA layer obtained herein, promotes the accumulation of ACAP at the electrode/solution interface and the gold nanoparticles act as electron antennae, efficiently tunneling electrons between the solute and the electrode and this contributes to the increase in the electrode sensitivity toward ACAP detection.56 It should be highlighted that on the Au/NPs-Au electrode, the ACAP concentration range in which the linear relationship of jp–cACAP is fulfilled is wider than that obtained for other modified electrodes.21
| Compound | Regression equation | R 2 (n) | Detection limit cL/mM; (cL/μM) |
|---|---|---|---|
| ACAP | j p [mA cm−2] = (20 ± 3) 10−3 + (270 ± 2) × 10−1cACAP [mM] | 0.9996 (25) (n = 18) | 1.8 × 10⁻⁵ (0.018 μM) |
| AA | j p [mA cm−2] = (634 ± 7) 10−3 + (150 ± 6) × 10−3cAA [mM] | 0.9992 (11) (n = 10) | 7.7 × 10⁻² (77 μM) |
| UA | j p [mA cm−2] = (937 ± 9) 10−3 + (160 ± 6) × 10−3cUA [mM] | 0.9979 (11) (n = 10) | 8.6 × 10⁻² (86 μM) |
Sample analysis
In order to test the practical application of the newly prepared voltammetric sensor, samples containing mixtures of ACAP, AA and UA, which were prepared as described in the Experimental section, were examined electrochemically via DPV and then the concentrations of ACAP, AA and UA were estimated using the calibration method.60 All the measurements were repeated five times for three independent samples under the same experimental conditions. The arithmetical averages of the concentrations of five determinations made for each independent tested sample are listed in Table 2. The relative standard deviations (R.S.D.) together with the recovery ranges of the determination of each compound in the prepared samples are included in Table 2. The statistical parameters show good agreement with the nominal content and indicate that the voltammetric sensor prepared herein could be a promising tool for the simultaneous determination of ACAP, AA and UA in ternary mixtures.| Sample number | Nominal content of ACAP (mM) | Nominal content of AA (mM) | Nominal content of UA (mM) | ACAP concentration fund (mM) | AA concentration fund (mM) | UA concentration fund (mM) |
|---|---|---|---|---|---|---|
| 1 | 0.066 | 5 | 5 | 0.0655 | 5.12 | 4.87 |
| 2 | 0.066 | 5 | 5 | 0.0668 | 4.96 | 5.18 |
| 3 | 0.066 | 5 | 5 | 0.06650 | 4.98 | 5.04 |
| R.S.D. (%) | 1.6% | 2.07% | 4.0% | |||
| Recovery (%) | 98–102% | 99–102% | 97–104% | |||
Conclusions
It has been demonstrated that the rate of ACAP oxidation, which is a compound of great medical importance, is substantially enhanced on the gold surface modified with self-assembled layers composed of dihydrolipoic acid, cysteamine and gold nanoparticles compared to that achieved at a bare gold electrode. The voltammetric sensor prepared exhibits excellent stability and reproducibility. The preparation procedure of the modified electrode is simple and green without the use of toxic solutions, which is important from not only a medical, but also an ecological point of view. The range of ACAP concentration in which its content can be reliably estimated as well as the ACAP detection limit obtained on the modified electrode are sufficient for practical use and thus the obtained modified gold electrode is very promising for application as a sensitive voltammetric ACAP sensor. Moreover, the peak to peak separations obtained on the modified electrode confirm that the newly prepared modified gold electrode appears to be a good candidate for the selective detection and analytical determination of ACAP, AA and UA in ternary mixtures.Acknowledgements
The Polish Ministry of Science and Higher Education, Poland is gratefully acknowledged for financial support of this work.Notes and references
- K. E. Barrett, S. M. Barman, S. Boitano and H. L. Brooks, Ganong's review of medical physiology, McGraw-Hille-Book, 2015 Search PubMed.
- M. Mueller, Clinical pharmacology: current topics and case studies, Springer, Vienna, 2008 Search PubMed.
- J. A. M. Pulgarin and L. F. G. Bermejo, Anal. Chim. Acta, 1996, 333, 59–69 CrossRef CAS.
- M. L. Ramos, J. F. Tyson and D. J. Curran, Anal. Chim. Acta, 1998, 364, 107–116 CrossRef CAS.
- A. Ruiz-Medina, M. L. Fernandez-deCórdova and M. J. Ayora-Kañada, Anal. Chim. Acta, 2000, 404, 131–139 CrossRef CAS.
- V. Rodenas, M. S. Garćia, S. Sánchez-Pedreño and M. I. Albero, Talanta, 2000, 52, 517–523 CrossRef CAS PubMed.
- N. Wangfuengkanagul and O. Chailapakul, J. Pharm. Biomed. Anal., 2002, 28, 841–847 CrossRef CAS PubMed.
- R. M. de Carvalho, R. S. Freire, S. Rath and L. T. Kubota, J. Pharm. Biomed. Anal., 2004, 34, 871–878 CrossRef CAS PubMed.
- J. Meyer and U. Karst, Chromatographia, 2001, 24, 163–167 Search PubMed.
- E. Marin, E. Garcia, A. Garcia and C. Barbas, J. Pharm. Biomed. Anal., 2002, 29, 701–714 CrossRef PubMed.
- M. Li and L. Jing, Electrochim. Acta, 2007, 52, 3250–3257 CrossRef CAS.
- Q. Wan, X. Wang, F. Yu, X. Wang and N. Yang, J. Appl. Electrochem., 2009, 39, 785–790 CrossRef CAS.
- Z. A. Alothman, N. Bukhari, S. M. Wabaidur and S. Haider, Sens. Actuators, B, 2010, 146, 314–320 CrossRef CAS.
- A. Babaei, M. Afrasiabi and M. Babazadeh, Electroanalysis, 2010, 22, 1743–1749 CrossRef CAS.
- R. Manjunatha, D. H. Nagaraju, G. S. Suresh, J. S. Melo, S. F. D’Souza and T. V. Venkatesha, Electrochim. Acta, 2011, 56, 6619–6627 CrossRef CAS.
- T.-L. Lu and Y.-C. Tsai, Sens. Actuators, B, 2011, 153, 439–444 CrossRef CAS.
- A. A. Ensafi, H. Karimi-Maleh, S. Mallakpour and M. Hatami, Sens. Actuators, B, 2011, 155, 464–472 CrossRef CAS.
- X. Kang, J. Wang, H. Wu, J. Liu, I. A. Aksay and Y. Lin, Talanta, 2010, 81, 754–759 CrossRef CAS PubMed.
- Y. Fan, J.-H. Liu, H.-T. Lu and Q. Zhang, Colloids Surf., B, 2011, 85, 289–292 CrossRef CAS PubMed.
- H. Filik, G. Çetintaş, A. A. Avan, S. N. Koç and İ. Boz, Int. J. Electrochem. Sci., 2013, 8, 5724–.5737 CAS.
- H. Filik, A. A. Avan, S. Aydar and G. Çetintaş, Int. J. Electrochem. Sci., 2014, 9, 148–160 Search PubMed.
- N. F. Atta, M. F. El-Kady and A. Galal, Sens. Actuators, B, 2009, 141, 566–574 CrossRef CAS.
- A. L. Liu, K. Wang, W. Chen, F. Gao, Y. S. Chai, X. H. Lin, Y. Z. Chen and X. H. Xia, Electrochim. Acta, 2012, 63, 161–168 CrossRef CAS.
- M. B. Gholivand and M. Amiri, J. Electroanal. Chem., 2012, 676, 53–59 CrossRef CAS.
- N. F. Atta, A. Galal and S. M. Azab, Int. J. Electrochem. Sci., 2011, 6, 5082–5096 CAS.
- S. W. Wang, F. Xie and R.-F. Hu, Sens. Actuators, B, 2007, 141, 495–500 CrossRef.
- A. N. Shipway, E. Katz and I. Willner, ChemPhysChem, 2000, 1, 18–52 CrossRef CAS PubMed.
- S. Kinge, M. Crego-Calama and D. N. Reinhoudt, ChemPhysChem, 2008, 9, 20–42 CrossRef CAS PubMed.
- M. Chirea, Catalysts, 2013, 3, 288–309 CrossRef CAS.
- W. Nowicki, The behaviour of systems composed of nanosised particles and very-high-molecular weight linear polymers, Adam Mickiewicz University Press, Poznań, 2002 Search PubMed.
- A. Meier, I. Uhlendorf and D. Meissner, Electrochim. Acta, 1995, 40, 1523–1535 CrossRef CAS.
- B. Li and Q. Ye, Antifouling surfaces and materials, ed. F. Zhou, Springer, Berlin, Heidelberg, 2014 Search PubMed.
- A. Ulman, Chem. Rev., 1996, 96, 1533–1554 CrossRef CAS PubMed.
- L. Zhang, J. Jia, X. Zou and S. Dong, Electroanalysis, 1996, 16, 1413–1418 CrossRef.
- T. Łuczak and M. Bełtowska-Brzezinska, Microchim. Acta, 2011, 174, 19–30 CrossRef.
- C. Retna Raj, T. Okajima and T. Osaka, J. Electroanal. Chem., 2003, 543, 127–157 CrossRef.
- B. Ballarin, M. C. Cassani, E. Scavetta and D. Tonelli, Electrochim. Acta, 2008, 53, 8034–8044 CrossRef CAS.
- J. Manso, M. L. Mena, P. Yǎñez-Sedeno and J. Pingarrón, J. Electroanal. Chem., 2007, 303, 1–7 CrossRef.
- J. McMurry, Organic Chemistry, National Scientific Publishers, Warsaw, 2005 Search PubMed.
- T. Łuczak, Electroanalysis, 2014, 26, 2152–2160 CrossRef.
- W.-k. Paik, S. Eu, K. Lee, S. Chon and M. Kim, Langmuir, 2000, 16, 10198–10205 CrossRef CAS.
- S. Chon and W-k. Paik, Phys. Chem. Chem. Phys., 2001, 3, 3405–3410 RSC.
- T. R. Wendland, B. S. Muntean, J. Kaur, J. Mukherjee, J. Chenc, X. Tan, D. Attygalle, R. W. Collins, J. R. Kirchhoff and L. M. V. Tillekeratne, Electroanalysis, 2011, 23, 2275–2279 CrossRef CAS.
- G. Dodero, L. De Michieli, O. Cavalleri, R. Rolandi, L. Olivieri, A. Dacca and R. Parodi, Colloids Surf., A, 2000, 175, 121–128 CrossRef CAS.
- http://www.Reaxys.com .
- C. Jeyabharathi, P. Ahrens, U. Hasse and F. Scholz, J. Solid State Electrochem., 2016, 20, 3025–3031 CrossRef CAS.
- R. C. Newman and G. T. Burstein, J. Electroanal. Chem., 1981, 129, 343–348 CrossRef CAS.
- A. J. Bard and L. K. Faulkner, Electrochemical methods: Fundamentals and applications, Wiley, New York, 2001 Search PubMed.
- S. Trasatti and O. Petrii, Pure Appl. Chem., 1991, 63, 711–734 CrossRef CAS.
- J. J. Van Benchloten, J. Y. Lewis, W. R. Heineman, D. A. Roston and P. T. Kissinger, J. Chem. Educ., 1983, 60, 772–776 CrossRef.
- A. Kisza, Electrochemistry II, Technical Scientific Publishers, Warsaw, 2001 Search PubMed.
- S.-F. Liu, X.-H. Li, Y.-C. Li, Y.-F. Li, J.-R. Li and L. Jiang, Electrochim. Acta, 2005, 51, 427–431 CrossRef CAS.
- J. Zhang and M. Ojama, Electrochem. Commun., 2007, 9, 459–464 CrossRef CAS.
- M. C. Leopold, J. A. Black and E. F. Bowden, Langmuir, 2002, 18, 978–980 CrossRef CAS.
- M. O. Finot and M. T. McDermott, J. Electroanal. Chem., 2000, 488, 125–132 CrossRef CAS.
- L. Wang, J. Bai, P. Huang, H. Wang, L. Zhang and Y. Zhao, Electrochem. Commun., 2006, 8, 1035–1040 CrossRef CAS.
- Z. Jia, J. Liu and Y. Shen, Electrochem. Commun., 2007, 9, 2739–2743 CrossRef CAS.
- H. Sellers, A. Ulman, Y. Shnidman and J. E. Eilers, J. Am. Chem. Soc., 1993, 115, 9389–9401 CrossRef CAS.
- Analytical Methods Committee, Recommendation for definition, estimation and use of the detection limit, Analyst, 1987, 112, 199–204 RSC.
- W. Szczepaniak, Instrumental methods in chemical analysis, Scientific Publishers PWN, Warsaw, 2017 Search PubMed.
| This journal is © The Royal Society of Chemistry and the Centre National de la Recherche Scientifique 2017 |

