Star-shaped π-gelators based on oxadiazole and thiadiazoles: a structure–property correlation†
Subrata
Nath
 a,
Suraj Kumar
Pathak
 a,
Joydip
De
 b,
Santanu Kumar
Pal
 b and
Ammathnadu S.
Achalkumar
 *a
*a
aDepartment of Chemistry, Indian Institute of Technology Guwahati, Guwahati, 781039, Assam, India. E-mail: achalkumar78@gmail.com; achalkumar@iitg.ernet.in
bIndian Institute of Science Education and Research Mohali, Sector-81, Knowledge City, Manauli 140306, Punjab, India
First published on 21st July 2017
Abstract
Star-shaped and tetracatenar molecules based on 1,3,4-oxadiazole and thiadiazole derivatives were synthesized and their liquid crystallinity and gelation behavior were studied. The self-assembly and photophysical properties of these molecules are sensitive to the type of the heteroatom present in the molecule and the pattern of peripheral substitution. Only the star-shaped molecule with substituted oxadiazole arms exhibited a columnar hexagonal phase, while the tetracatenars were crystalline. This compound exhibited a supergelation behavior that is mainly supported by attractive π–π interactions. This is notable because usually supergelation is supported by H-bonding interactions. Further, this compound exhibited aggregation-induced emission with a several-fold increase in the luminescence intensity upon gelation. Surprisingly its thiadiazole counterpart was crystalline and did not gelate. The corresponding oxadiazole and thiadiazole star-shaped molecules, with peripheral 3,4-substitution, were liquid crystalline and stabilized gelation. This shows that in addition to π–π interactions, nanosegregation of incompatible molecular subunits like flexible tails plays a major role in organogelation and liquid crystalline self-assembly. Microscopy studies revealed a fibrillar network of several micrometers length confirming the long range molecular self-assembly. Electrochemical studies helped to understand the effect of peripheral substitution on the HOMO–LUMO levels and the band gaps.
Design, System, ApplicationEmissive columnar liquid crystals (Col LCs) formed from the self-assembly of disc or polycatenar or star-like molecules are important in the design of future solid-state displays. From the viewpoint of economy and environment, Col LCs provide a cheap and safe alternative to their inorganic counterparts used in light emitting diodes. Emissive Col LCs provide 1D-nanostructures, which lead to an efficient charge migration and their recombination to produce electroluminescence. However, aggregation quenching of luminescence is a problem to overcome in realizing the successful application of these ordered Col structures. In the present study, a complete account on the effect of small variations at the molecular scale and its impacts on the nature of the supramolecular self-assembly is provided which is of significant relevance. The present report provides a clear picture of the delicate interplay of the effect of heteroatoms and the position of peripheral alkyl chain substitution on the self-assembly and photophysical behavior of star-shaped molecules, which will be of great interest to the scientific community working in the area of supramolecular self-assembly and organic electronics. Interestingly, the present molecular designs provide highly ordered Col structures over a long range with the enhancement of emission. |
Introduction
Highly conjugated aromatic structures are of great interest in the area of organic electronics. The anticipation of novel applications related to solar cells, flexible solid-state displays, and low cost printed circuits propelled this ever expanding and exciting area of research.1 Many efforts to obtain the self-assembled structures of such molecules through different supramolecular approaches have been exerted with an ultimate aim of practical applications.2 Over the years, supramolecular chemistry has grown into a matured field benefitting the biological and material sciences.3 π-Organogelators are one class of organic molecules with a highly conjugated structure that stabilizes the formation of a nonflowing soft material in the presence of a solvent. Their structure endows them with inherent properties like fluorescence, charge carrier mobility and electronic conduction.4 In addition, meticulous molecular engineering enables one to tune and tailor these properties. From the application point of view, how these molecules self-assemble on the substrates during device fabrication matters a lot. With a careful molecular design, one can control the self-assembly of the molecules in their aggregates. Here ‘supramolecular chemistry’, that is the chemistry beyond the molecule, plays a major role, where several weak interactions like π–π interactions, H-bonding and van der Waals forces come into the picture.5 Though the solvent is a major component in organogels, the organogels are rather sensitive to the structure of the gelator, too. There is a delicate interplay of gelator–gelator and gelator–solvent interactions.6 In other words it is a tight ropewalk between precipitation and solubility of the gelator in a particular solvent. Since hydrocarbon solvents are mostly used in the case of π-organogelators, the substitution pattern of the flexible alkyl chains on the aromatic core also influences the organogel self-assembly. In literature reports, one often encounters the use of 3,4,5-trialkoxy and 3,5-dialkoxy substituted benzenes to provide van der Waals interactions.4Liquid crystals (LCs) are another class of supramolecular materials, which have realized many commercial applications, due to their extreme sensitivity to external perturbations like pressure, temperature, and electric and magnetic fields.7 The main difference between organogels and thermotropic LCs is the presence or absence of solvents. The interesting properties of LCs are a result of the macroscopic self-assembly of mesogens, which involves several factors like shape anisotropy, π–π interactions, H-bonding, van der Waals forces and nanophase segregation (segregation of incompatible molecular subunits). The shape anisotropic structures of the mesogens are a combination of the hard aromatic part and flexible alkyl chains. During the molecular design, these two factors are customized to tune the self-assembly. Especially in the case of columnar (Col) LCs, the central aromatic part helps in providing an ordered one-dimensional (1D) stacking through π–π interactions, while the flexible chains provide the required fluidity in addition to van der Waals interactions. Further, their processability by solution coating to get homogeneous, highly ordered thin films is another advantage in comparison to amorphous polymers and organic single crystals.8 They also provide anisotropic charge carrier mobility along the column direction. Liquid crystalline physical gels – an amalgamation of liquid crystals and gelators – are a novel class of stimuli responsive materials. This combination of two components results in special electro-optical, photochemical and electronic properties.6 Usually, gelators containing hydrogen bonding are used in the preparation of such materials. This is due to the high strength of H-bonding which ranges from 4 to 120 kJ mol−1.9 There are fewer reports on Col LCs that stabilize organogelation mainly through π–π interactions. It is understandable, considering the low strength of π-interactions (0 to 50 kJ mol−1). Our recent findings on Col LCs, which stabilize gelation at very low concentration in hydrocarbon solvents (less than 1 wt% or supergelators),10 motivated us to delve more into the molecular structure–property correlations that govern these intimate interactions in deciding the LC and organogel self-assembly. For this purpose, we decided to synthesize star-shaped molecules and tetracatenars, which are known to stabilize Col phases, when appropriately substituted. These compounds are based on the unsymmetrically substituted 1,3,4-oxadiazole and thiadiazole derivatives.11 Star-shaped oxadiazole and thiadiazole derivatives with peripheral 3,4-dialkoxy substitutions are already reported to exhibit columnar hexagonal phases.11a Thus we have compared the mesomorphic and gelation behavior of these molecules along with the newly synthesized star-shaped molecules, with peripheral 3,5-dialkoxy substitution. Corresponding p-substituted and m-substituted tetracatenars were also synthesized and investigated for their mesomorphic and gelation behaviors in comparison to the star-shaped molecules.
Synthesis and characterization
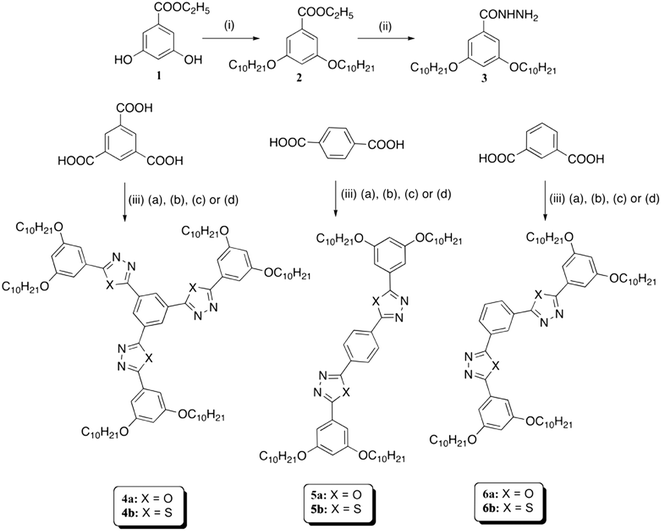
The synthetic route for the preparation of the target molecules is illustrated in Scheme 1. Ethyl-3,5-dihydroxybenzoate (1) was subjected to O-alkylation under Williamson's ether synthesis protocol to get the ethyl-3,5-didecyloxy benzoate (2). This ester was converted to the corresponding hydrazide 3 on treatment with hydrazine hydrate in ethanol. Hydrazide 3 was then refluxed with 1,3,5-benzene tricarbonyl trichloride in THF in the presence of an organic base, yielding tri-N-benzoylbenzohydrazides, which were subjected to POCl3 mediated dehydrocyclization to obtain trioxadiazole 4a. The same process was repeated by treating the hydrazide 3 with the compounds 1,4-benzene dicarboxyl chloride and 1,3-benzene dicarboxyl chloride to obtain the respective dihydrazides. These compounds were subjected to dehydrocyclization with POCl3, yielding the polycatenars 5a and 6a. Corresponding thiadiazole derivatives (4b, 5b and 6b) were prepared by refluxing the hydrazides with Lawesson's reagent in anhydrous toluene. The structures of all the intermediates and target molecules were completely characterized through 1H NMR, 13C NMR, IR spectroscopy and ESI-HRMS or MALDI-TOF analysis (see the ESI† for details).Thermal behavior
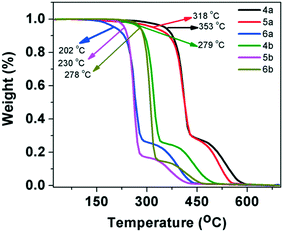
The mesogenic behavior of these star-shaped molecules and polycatenars was studied with the help of polarizing optical microscopy (POM), differential scanning calorimetry (DSC) and powder X-ray diffraction (XRD) studies (wherever required). The phase transitions and the corresponding changes in enthalpy are summarized in Table 1. Similarly, the data obtained from XRD studies are presented in Table 2. The thermal stability of these molecules was investigated through thermogravimetric analysis (TGA). The oxadiazole-based compounds, especially star shaped and p-substituted tetracatenars exhibited higher thermal stability (>300 °C). All the other compounds exhibited thermal stability at least up to 200–280 °C (Fig. 1).| Entry | Heating | Cooling |
|---|---|---|
| a Peak temperatures in the DSC thermograms obtained during the second heating and first cooling cycles at 5 °C min−1; Cr = crystal phase, Colh = columnar hexagonal phase. b Crystallization was observed only under POM, but not detected in DSC. | ||
| 4a | Cr1 15.6 (7.1) 68.4 (28.5) Cr2 79.4 (11.2) Colh 94.8 (1.6) I | I 90.5 (1.6) Colh 11.4 (4.2) Cr |
| 4b | Cr 51 (2.6) I | I 36.1 (1.3) Cr |
| 5a | Cr1 80.3 (6.1) Cr2 124.9 (57.1) I | I 101.9 (58) Cr1 75.2 (10.5) Cr2 |
| 5b | Cr 96.1 (53.9) I | I 75 Crb |
| 6a | Cr 82.7 (51.5) I | I 17.5 (28) Cr |
| 6b | Cr 76.3 (32.4) I | I 27.3 (3.3) Cr |
| Compounds (D/Å) | Phase (T/°C) symmetry | d obs (Å) | d cal (Å) | Miller indices (hk) | Lattice parameters (Å), lattice area S (Å2), molecular volume V (Å3) |
|---|---|---|---|---|---|
| a The diameter (D) of the disk (estimated from Chem 3D Pro 8.0 molecular model software from Cambridge Soft). dobs: spacing observed; dcal: spacing calculated (deduced from the lattice parameters; a for the Colh phase). The spacings marked ha and hc correspond to diffuse reflections in the wide-angle region arising from correlations between the alkyl chains and core regions, respectively. Z indicates the number of molecules per columnar slice of thickness hc, estimated from the lattice area S and the volume V. | |||||
| 4a (41.1) | Colh (80) p6mm | 28.86 5.0 (ha) 3.77 (hc) | 28.86 | 10 | a = 33.32; S = 966.6; V = 3621.3; Z = 1.5. |
| Colh (60) p6mm | 29.72 4.96 (ha) 3.82 (hc) | 29.72 | 10 | a = 34.32; S = 1018.8; V = 3892; Z = 1.6. | |
| Colh (25) p6mm | 29.74 4.90 (ha) 3.81 (hc) | 29.74 | 10 | a = 34.34; S = 1020; V = 3845.5; Z = 1.6. | |
The oxadiazole based star-shaped molecule 4a was placed between an untreated glass slide and a coverslip. On heating, it showed a transition to a fluidic birefringent phase at ≈79 °C (ΔH = 11.2 kJ mol−1). This phase persisted up to 95 °C, before converting into an isotropic liquid (Fig. 2b). Cooling the isotropic liquid at a rate of 2 °C min−1 led to the growth of colorful mosaic patterns, which existed up to room temperature (Fig. 2a). Cooling scans obtained from the DSC showed that the mesophase crystallized at 11 °C (ΔH = 4.2 kJ mol−1). We have carried out XRD studies at different temperature intervals (Fig. 2c). The XRD profile obtained at 80 °C showed a single sharp reflection centered at a low angle corresponding to a d-spacing of 28.86 Å, along with diffused spacings at wide angles corresponding to 5 Å and 3.77 Å. The first diffused spacing at 5 Å corresponds to the packing of flexible alkyl tails, while the second diffused spacing at 3.77 Å can be attributed to the packing of cores. The hexagonal lattice parameter ‘a’ was found to be 33.3 Å, which is less than the calculated molecular diameter (41 Å). The area of the unit cell was 966.6 Å2 and the volume was found to be 3621.3 Å3. The number of molecules forming a unit hexagonal cell (Z) was found to be 1.5. This may be due to the intercalation of the arms of the star-shaped molecule. This is supported by the lower value of ‘a’ in comparison to the molecular diameter (Table 2 and Fig. 3).
 | ||
| Fig. 3 Schematic showing the self-assembly of star-shaped oxadiazole derivative 4a to the Colh phase. | ||
The thiadiazole based star-shaped molecule 4b turned out to be crystalline. Regioisomeric oxadiazole and thiadiazole based star-shaped molecules with peripheral alkoxy tails connected to the benzene ring at 3 and 4 positions (7a and 7b), however, exhibited a wide range Colh phase (Fig. 4).11a This shows how a small structural variation like peripheral chain substitution perturbs the self-assembly of star-shaped molecules. p-Substituted tetracatenars 5a–b and m-substituted tetracatenars 6a–b turned out to be crystalline. This means that substitution at 3 and 5 positions of the terminal ring is not conducive to stabilize liquid crystallinity. Star-shaped molecules lack the shape anisotropy of disc-like molecules, where nanophase segregation of incompatible molecular subunits plays a vital role in stabilizing the columnar self-assembly. Thus, for the compounds with peripheral 3,5-substitutions, the one with the lower bend angle (compound 4a, with the oxadiazole ring with a bend angle of 134°) will have higher mesophase stability due to the better space filling than compound 4b (thiadiazole ring with a bend angle of 160°).
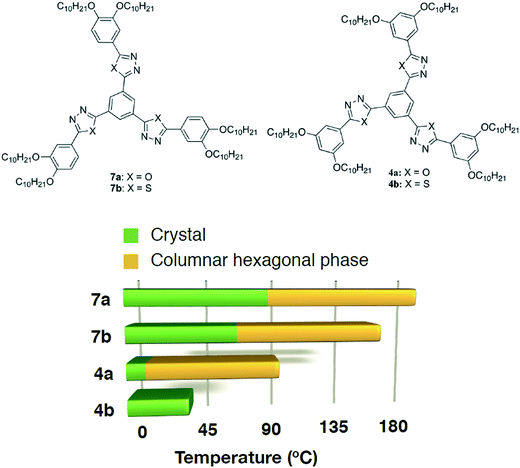 | ||
| Fig. 4 Structures of the regioisomeric star-shaped oxadiazole and thiadiazole derivatives reported earlier (7a–b)11a and of the present study (4a–b) and the bar graph showing their thermal behavior (based on the first cooling in the DSC scan). | ||
Photophysical studies
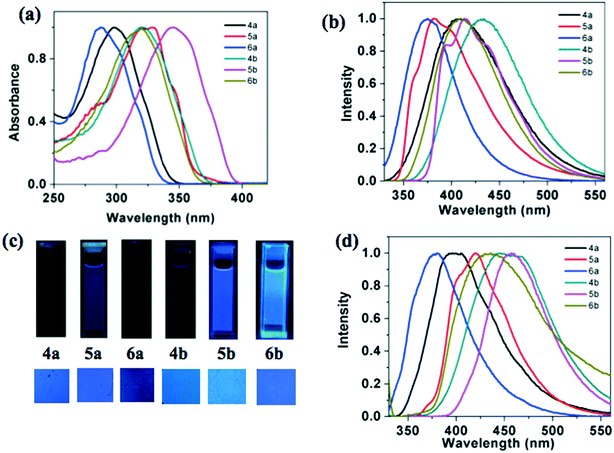
Photophysical properties of the star-shaped compounds (4a–b), p-substituted polycatenars (5a–b) and m-substituted polycatenars (6a–b) are presented in Table 3. From the absorption spectra taken in micromolar solutions in THF, it can be seen that the thiadiazole based compounds 4b, 5b and 6b exhibited a red shifted absorption maximum in comparison to oxadiazole based compounds 4a, 5a and 6a. In line with the absorption spectra, the oxadiazole-based compounds exhibited a higher optical band gap than the thiadiazole-based compounds. A similar red shift was observed in the emission spectra of thiadiazole derivatives in comparison to oxadiazole derivatives. The observed red shift in absorption and emission of thiadiazole derivatives can be attributed to the higher polarizability and basic nature of sulphur.| Solution | Thin film | ||||||
|---|---|---|---|---|---|---|---|
| Entry | Absorptiona (nm) | Emissiona,b (nm) | Stokes shift (cm−1) | ΔEg,optc | Quantum yieldd | ε (M−1 cm−1) | Emissione (nm) |
| a Micromolar solutions in THF. b Excited at the respective absorption maxima. c Band gap was determined from the red edge of the longest wavelength in the UV-vis absorption spectra. d Relative quantum yield measured with respect to a quinine sulphate solution (0.1 M in conc. H2SO4). e Emission obtained by exciting the thin films at their absorption maxima in solution. | |||||||
| 4a | 298 | 402 | 8681.4 | 3.64 | 0.21 | 22![[thin space (1/6-em)]](https://www.rsc.org/images/entities/char_2009.gif) 728 728 |
396 |
| 5a | 327 | 383 | 4471.4 | 3.47 | 0.68 | 13![[thin space (1/6-em)]](https://www.rsc.org/images/entities/char_2009.gif) 819 819 |
420 |
| 6a | 287 | 374 | 8105.2 | 3.75 | 0.25 | 15![[thin space (1/6-em)]](https://www.rsc.org/images/entities/char_2009.gif) 480 480 |
380 |
| 4b | 321 | 434 | 8111.2 | 3.36 | 0.18 | 20![[thin space (1/6-em)]](https://www.rsc.org/images/entities/char_2009.gif) 594 594 |
446 |
| 5b | 345 | 367 | 1737.6 | 3.17 | 0.41 | 15![[thin space (1/6-em)]](https://www.rsc.org/images/entities/char_2009.gif) 976 976 |
457 |
| 6b | 319 | 408 | 6838.2 | 3.42 | 0.15 | 18![[thin space (1/6-em)]](https://www.rsc.org/images/entities/char_2009.gif) 480 480 |
436 |
Star-shaped molecules and m-substituted polycatenars showed lower absorption maxima in comparison to the p-substituted polycatenars, which is due to the difference in the conjugation.11b This is reflected in the values of their optical band gaps, where the p-substituted polycatenars showed a lower band gap than the m-substituted polycatenars and star-shaped molecules. The values of molar absorption coefficients were higher in the case of star-shaped molecules, which were followed by m- and p-substituted polycatenars. The single absorption band observed for 1,3,4-oxadiazole and thiadiazole based systems is ascribed to the spin allowed π–π* transition of the conjugated system.11 The Stoke's shift was found to be higher for the star-shaped molecules than that of the tetracatenars.
The emission spectra were not in line with this observation, where the star-shaped molecules exhibited red shifted emission in comparison to the p- and m-substituted tetracatenars. The thin films of these compounds prepared by annealing the sandwiched samples from the isotropic state exhibited a visually perceivable blue color, under the irradiation of UV light of long wavelength (λmax = 365 nm). Thus blue emission was observed for both the solutions and thin films. This is promising because there is a scarcity of blue light emitting materials and they are known to have wide band gaps. Synthetically it is difficult to design such conjugated systems and blue light emitters provide flexibility in fine-tuning the emission wavelength in combination with another dopant emitter. This is why they form vital components in the construction of white OLEDs.12 Oxadiazole based compounds 4a, 5a and 6a showed higher quantum yields (0.21–0.68) than the corresponding thiadiazole derivatives 4b, 5b and 6b (0.15–0.41), which is in line with the general trend.11 Among all the molecules, p-substituted polycatenars exhibited higher quantum yields than the star-shaped molecules and m-substituted polycatenars.
The thin film of the compound 4a showed a blue shifted emission in comparison to its solution, while the thin films of other compounds exhibited a red shifted emission maximum. This suggests the formation of aggregates in the thin film state. It is interesting to compare the photophysical properties of regioisomeric star shaped molecules reported earlier, where the peripheral tails are connected to the 3,4-positions of the peripheral benzene ring. Compounds 4a and 4b exhibited a blue-shifted absorption and emission maxima in comparison to the isomers (7a and 7b, Fig. 5) with peripheral tails connected to the 3,4-positions of the benzene ring in solution.11a
Gelation studies
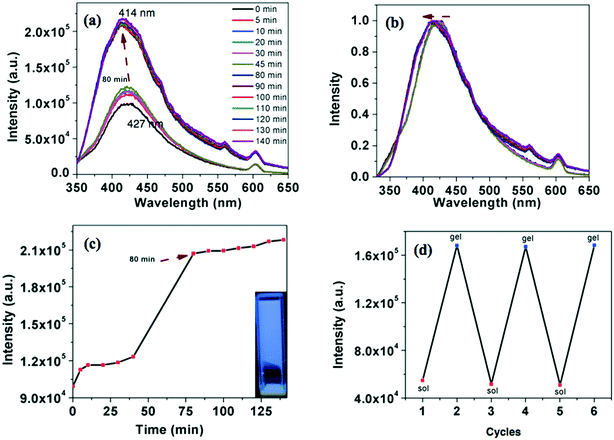
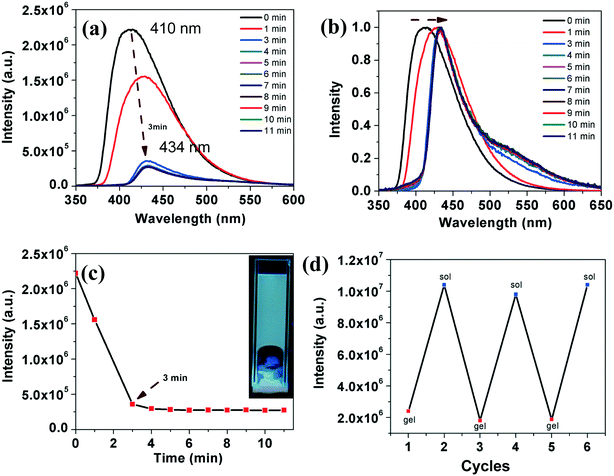
All the compounds were tested for their gelation behavior in hydrocarbon based solvents like hexane, decane and dodecane. Table 4 provides the CGC (in wt%), i.e. the minimum concentration necessary for gelation, and Tgel (°C) i.e. the thermal stability of the gels determined by the ‘dropping ball’ method13 for all the compounds. Only the star-shaped oxadiazole derivative 4a formed an opaque gel with a critical gelation concentration (CGC) of 0.9 wt% in dodecane. Such gelators which form stable gels at less than 1 wt% concentration are termed as ‘supergelators’.14,16 Usually this kind of stable gelation requires strong intermolecular interactions like H-bonding.15 Supergelators which stabilize gelation mainly through π–π interactions are less in number.16 As an example, compound 4a was dissolved in dodecane by heating and left to attain the ambient temperature. The process of gelation was followed with respect to time by fluorescence spectrometry. In solution state, the intensity of emission was less, which gradually increased with the decrease in temperature. It has shown a sudden increase at around 80 minutes and further showed a small increase with the time (Fig. 6a and c). The emission was blue-shifted in comparison to the solution state (Fig. 6b). Thus, the compound exhibits an enhancement in the emission intensity on gelation (approximately 2.2 times), which can be termed as ‘aggregation induced enhanced emission’ (AIEE).17 The gel formation was reversible over many heating and cooling cycles as evidenced from the monitoring of the emission intensity (Fig. 6d). It took 80 minutes for the compound to gelate from the point of dissolution as evidenced from the fluorescence studies. We have also carried out a gelation experiment by suddenly cooling the solution in an ice-water bath. In this case, gelation occurred within 5 minutes. Here also we observed the AIEE effect. The blue shifted emission in the gel state points out the formation aggregates. The corresponding thiadiazole derivative 4b was clearly soluble and was unable to gelate even on cooling. We were also interested to know the behavior of corresponding regioisomers 7a and 7b (Fig. 4 and Table 4). The regioisomeric star-shaped compound 7a exhibited gelation in n-dodecane with a lower CGC of 0.6 wt%.| Compound | Hexane | Decane | Dodecane | T gel (°C) |
|---|---|---|---|---|
| G = stable gel; I = insoluble; O = opaque; T = transparent; P = precipitate; PG = partial gel; S = soluble.a The critical gelation concentration (in wt%) is the minimum concentration necessary for gelation. Tgel is the thermal stability of the gels. | ||||
| 4a | I | P | G(O) (0.9)a | 45 |
| 4b | S | P | S | — |
| 5a | I | P | I | — |
| 5b | P | P | P | — |
| 6a | S | P | S | — |
| 6b | S | S | S | — |
| 7a | P | PG | G(O) (0.6)a | 50 |
| 7b | PG | PG | G(T) (0.5)a | 52 |
In comparison to compound 4a, which took a longer gelation time and higher CGC, compound 7a gelated very fast, within 3–4 minutes at a lower CGC. The gelation was followed by fluorescence spectrometry with a regular time interval. Upon gelation, we noticed a decrease in the emission intensity with a red shift, which is due to the ‘aggregation caused quenching’ (ACQ) (Fig. 7a–c).18 Regioisomeric thiadiazole derivative 7b also showed a gelation behavior in dodecane at a lower CGC (0.5 wt%) within 4 minutes. Gelation of the compound was followed with the help of fluorescence spectroscopy. Interestingly this compound exhibited an AIEE phenomenon with a red shifted emission (Fig. 8). Compound 5a was insoluble in dodecane even after heating, while compound 5b was soluble in dodecane. On cooling the solution in an ice bath, a weak gel was formed, which collapsed immediately within a few seconds. It was then heated to get a clear solution and left for some time in room temperature, but then the compound precipitated. Compound 6a was soluble in dodecane and did not gelate even after keeping for a long time in an ice-water bath. The compound 6b was soluble in dodecane, but precipitated in the ice-water bath.
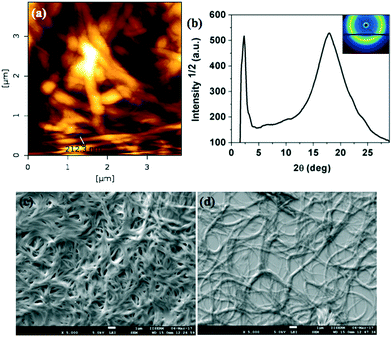
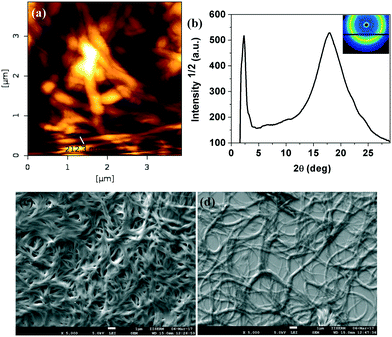
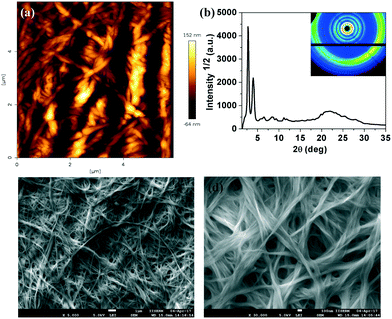
The microstructures of xerogels of compounds 4a, 7a and 7b were examined with the help of atomic force microscopy (AFM) and scanning electron microscopy (SEM). The compounds are made soluble in dodecane at their CGC and a very small drop is placed in a glass slide and kept to form a very thin layer of stable gel. Then these gel films were vacuum dried keeping the structure intact. After complete evaporation of the solvent, they were characterized by different scanning probe microscopy techniques like AFM and SEM. The images confirmed the highly entangled network formed by the fibers of several micrometers length (Fig. 9a, c and d, 10a, c and d and 11a, c and d). Further the structure of the xerogel was investigated with the help of powder X-ray diffraction studies (Table 1 in the ESI†). The powder XRD studies of the xerogel of compound 4a showed the crystallization of the sample on moving to xerogel state. The XRD plot depicting the intensity against the 2θ showed several peaks at the low-angle and wide-angle regions (Fig. 9b). Interestingly, the XRD pattern of the xerogel of compound 7a revealed several peaks ranging from the low angle to mid angle region corresponding to the d-spacings of 38.27 Å, 13.58 Å, 8.61 Å and 4.95 Å. In addition there were diffused peaks at wide-angle corresponding 4.02 Å and 3.68 Å. The first diffused peak corresponds to the packing of alkyl tails, while the second one corresponds to the packing of cores (Fig. 10b and Table 1 in the ESI†). The first four d-spacings can be indexed to (01), (11), (14) and (30) reflections arising from a rectangular lattice of p2mm symmetry. The lattice parameters calculated were found to be a = 14.55 Å and b = 38.27 Å. In contrast, the XRD of the xerogel of compound 7b showed that it is crystalline with several peaks in the low and mid angle regions.
Rheological studies
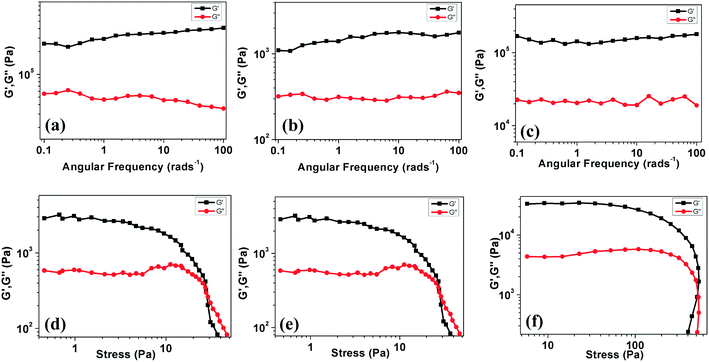
The elastic nature of the gels can be investigated with the help of rheological measurements involving strain sweep, angular frequency sweep and step strain measurements. To understand the dynamic mechanical properties of the organogels of compounds 4a, 7a and 7b in dodecane, we executed dynamic frequency sweep measurements at constant stress by quantifying the rheological response. This is characterized by G*(ω) = G′(ω) + iG′′(ω). Here G′ denotes the storage modulus, G′′ denotes the loss modulus and ω represents the angular frequency.19 These measurements are valuable, as the measurements are carried out without affecting the gel structure due to small stress. Fig. 12a shows the measurements of G′ and G′′ for the gels (at CGC, solvent: dodecane) as a function of ω (at 25 °C, by applying 0.2 kPa stress). We can notice two important things from Fig. 12a–c. Firstly, in all cases, the value of G′ is found to be larger than G′′ over the complete range of frequency measurements. This indicates that the gel works as a solid-like, viscoelastic material.20 Secondly, the dependence of G′ and G′′ on the frequency is not very strong. It should be noted that, even at the lowest frequency attained by the instrument, the liquid-like behavior of the gel was not observed. This corroborates that these materials are gels with a large structural relaxation.Non-linear rheological measurements were carried out to comprehend the dynamics of sol–gel transitions. A non-linear viscoelastic regime was established by performing experiments showing the stress amplitude dependence of the G′ and G′′. Fig. 12d–f show stress-dependent nonlinear measurements of the gel at a fixed frequency of 0.1 Hz. We note two features in these figures. Firstly, at low strain amplitudes, G′ is almost a constant, corresponding to a linear viscoelastic regime. In this regime, G′ is greater than G′′. This fact corresponds to the solid like behavior of the gel. Secondly, above a critical stress value (2.8 kPa), both G′ and G′′ became strain dependent. This finally results in the viscoelastic liquid-like behaviors at high stress (G′′ > G′). This implies a deformation driven changeover from a viscoelastic solid to a viscoelastic liquid.
The thixotropic nature of the gel was also confirmed by studying the ability of the gel to recover after destruction. Experimentally, two continuous processes, i.e. deformation and recovery, were followed consequently (see Fig. S23†). In the deformation step, a varying stress from 0.2 to 3 kPa (ω of 10 Hz for 300 s) was applied and the values of G′ were monitored as a function of time for 300 s. In the recovery step, the storage modulus G′ was monitored as a function of the same time interval (300 s) for a low shear stress (0.2 kPa; ω: 10 Hz). This experiment was repeated at least five times and the results are presented in Fig. S23.† The results demonstrate the immediate recovery of the gel after the removal of the applied stress, and thus emphasize the mechanical robustness of the materials.10d
Electrochemical studies
Energy levels of the HOMO and LUMO levels and the band gaps of all the target molecules were obtained by cyclic voltammetry (CV). The data obtained are tabulated in Table 5. CV scans of the compounds displayed irreversible oxidation and reduction waves (see Fig. S22†). The optical band gap (Eg,opt) was estimated from the absorption onset obtained from the absorption spectra in solution. Energy levels of HOMO and LUMO were determined by using the formulae EHOMO = −(4.8 – E1/2,Fc,Fc+ + Eox,onset) eV and ELUMO = Eg,opt – EHOMO eV.| Entry | E 1oxd | E HOMO , | E LUMO , | ΔEg,optb,f |
|---|---|---|---|---|
| a Micromolar solutions in THF, experimental conditions: Ag/AgNO3 – reference electrode, glassy carbon – working electrode, platinum rod – counter electrode, TBAP (0.1 M) as a supporting electrolyte, room temperature, scanning rate of 0.05 mV s−1; E1/2,Fc,Fc+ = 0.49 eV. b In electron volts (eV). c In volts (V). d Estimated from the onset oxidation peak values by using the formula EHOMO = −(4.8 – E1/2,Fc,Fc+ + Eox,onset) eV. e Estimated using the formula ELUMO = (Eg,op – EHOMO) eV. f Band gap determined from the red edge of the longest wave length in the UV-Vis absorption spectra. g From ref. 11a (E1/2,Fc,Fc+ = 0.53). | ||||
| 4a | 1.24 | −5.55 | −2.3 | 3.05 |
| 4b | 1.86 | −6.17 | −2.81 | 3.36 |
| 7a | 1.49 | −5.76 | −2.4 | 3.36 |
| 7b | 1.61 | −5.88 | −2.76 | 3.12 |
| 5a | 1.53 | −5.84 | −2.43 | 3.41 |
| 5b | 1.94 | −6.25 | −3.08 | 3.17 |
| 6a | 1.93 | −6.24 | −2.51 | 3.73 |
| 6b | 2.01 | −6.32 | −2.9 | 3.42 |
Star-shaped molecules 4a and 4b exhibited HOMO levels of −5.55 and −6.17 eV. In comparison, the p- and m-substituted tetracatenars exhibited lower values for HOMO. The LUMO levels of the star-shaped molecules 4a and 4b were situated at −2.3 and −2.81 eV. In comparison to the star-shaped derivatives, the p- and m-substituted tetracatenars showed lower values of LUMO levels. In comparison to the star-shaped thiadiazole derivative 4b, the p- and m-substituted tetracatenars (5b and 6b) showed lower values of LUMO levels. In comparison to 4a, star-shaped compound 7a exhibited lower HOMO and LUMO levels, while the reverse has been observed in the case of thiadiazole derivatives. In comparison to 4b, the star-shaped molecule 7b showed higher HOMO and LUMO levels. All the thiadiazole-based molecules exhibit lower band gap than the oxadiazole-based molecules, except compound 4b.
Conclusions
In this report, we have synthesized star-shaped and tetracatenar molecules based on 1,3,4-oxadiazole and thiadiazole derivatives. The peripheral substititution of alkoxy tails were at 3 and 5 positions of the benzene ring. This substitution has a significant impact on the stabilization of liquid crystalline and gel self-assembly. This was understood by comparing the behavior of newly synthesized star molecules with earlier reported molecules with 3,4-peripheral substitution. The compounds with 3,4 substitution stabilized liquid crystallinity and gelation. In the case of 3,5-substituted star-shaped molecules, only the oxadiazole derivative stabilized liquid crystallinity and gelation. It is interesting to note that the self-assembly behavior and photophysical properties of these molecules are tremendously sensitive to the type of the heteroatom present in the molecule and the pattern of peripheral substitution. All the tetracatenars turned out to be crystalline. Considering that gelation is mainly supported by attractive π–π interactions, the role of peripheral alkyl chains and the effect of heteroatoms have been analyzed for the first time. The present study also gives a comparison between the molecular requirements for the liquid crystalline self-assembly and organogelation. This class of star-shaped molecules is also able to gelate in long chain hydrocarbon solvents at very low concentration. This phenomenon of supergelation even in the absence of attractive H-bonding interactions is exceptional. The effect of peripheral substitution and the type of heteroatom also had roles in the emissive behavior of the compounds in gel state, i.e. 3,5-substituted star-shaped oxadiazole was AIEE active, while the thiadiazole derivative was unable to gelate. In the case of 3,4-substituted star-shaped oxadiazole, aggregation caused quenching was observed, while in the case of 3,4-substituted star-shaped thiadiazole, the AIEE effect was observed. The observation of a several-fold increase in the luminescence intensity upon gelation is important from the viewpoint of emissive solid displays. This report shows that in addition to π–π interactions, nanosegregation of incompatible molecular subunits like flexible tails also plays a major role in stabilizing the organogelation and liquid crystalline self-assembly. The microscopy studies of the xerogels with AFM and SEM showed the entangled network of fibers of several micrometers length confirming the long range self-assembly of these molecules. Extensive rheological studies proved the viscoelastic and thixotropic natures of the gels. Electrochemical studies have shown that the peripheral substitution significantly affects the HOMO–LUMO levels and the band gaps of the molecules. Finally, this study provides a complete account on the effect of small variations at the molecular scale and its impacts on the nature of supramolecular self-assembly which is of significant relevance in supramolecular chemistry.Conflicts of interest
There are no conflicts of interest to declare.Acknowledgements
ASA sincerely thanks the Science and Engineering Board (SERB), DST, Govt. of India and BRNS-DAE for funding this work through project No. SB/S1/PC-37/2012 and No. 2012/34/31/BRNS/1039, respectively. We thank the Ministry of Human Resource Development for Centre of Excellence in FAST (F. No. 5-7/2014-TS-VII). We thank CIF, IIT Guwahati for analytical facilities. SKP is grateful for financial support from INSA (bearing sanction No. SP/YSP/124/2015/433).References
- (a) S. R. Forrest, Nature, 2004, 428, 911–918 CrossRef CAS PubMed; (b) A. Facchetti, Chem. Mater., 2011, 23, 733–758 CrossRef CAS.
- (a) Self-Organized Organic Semiconductors: From Materials to Device Applications, ed. Q. Li, Wiley, Hoboken, 2011 Search PubMed; (b) Organic Electronics: Materials, Manufacturing and Applications, ed. H. Klauk, Wiley-VCH, Wein-heim, 2006 Search PubMed; (c) J. Roncali, P. Leriche and A. Cravino, Adv. Mater., 2007, 19, 2045–2060 CrossRef CAS; (d) S. R. Forrest and M. E. Thompson, Chem. Rev., 2007, 107, 923–925 CrossRef CAS; (e) E. Menard, M. A. Meitl, Y. Sun, J.-U. Park, D. J.-L. Shir, Y.-S. Nam, S. Jeon and J. A. Rogers, Chem. Rev., 2007, 107, 1117–1160 CrossRef CAS PubMed.
- (a) D. K. Smith, Supramolecular Chemistry: From Molecules to Nanomaterials, John Wiley and Sons, Inc., 1999) Search PubMed; (b) T. Aida, E. W. Meijer and S. I. Stupp, Science, 2012, 335, 813–817 CrossRef CAS PubMed; (c) M. J. Hollamby, M. Karny, P. H. H. Bomans, N. A. J. M. Sommerdijk, A. Saeki, S. Seki, H. Minamikawa, I. Grillo, B. R. Pauw, P. Brown, J. Eastoe, H. Möhwald and T. Nakanishi, Nat. Chem., 2014, 6, 690–696 CrossRef CAS PubMed.
- (a) S. S. Babu, V. K. Praveen and A. Ajayaghosh, Chem. Rev., 2014, 114(4), 1973–2129 CrossRef CAS PubMed; (b) S. S. Babu, S. Prasanthkumar and A. Ajayaghosh, Angew. Chem., Int. Ed., 2012, 51, 1766–1776 CrossRef CAS PubMed.
- J. D. Tovar, Acc. Chem. Res., 2013, 46(7), 1527–1537 CrossRef CAS PubMed.
- T. Kato, Y. Hirai, S. Nakaso and M. Moriyama, Chem. Soc. Rev., 2007, 36, 1857–1867 RSC.
- (a) E.-K. Fleischmann and R. Zentel, Angew. Chem., Int. Ed., 2013, 52, 8810–8827 CrossRef CAS PubMed; (b) M. Bremer, P. Kirsch, M. K. Memmer and K. Tarumi, Angew. Chem., Int. Ed., 2013, 52, 8880–8896 CrossRef CAS PubMed; (c) M. Funahashi, J. Mater. Chem. C, 2014, 2, 7451–7459 RSC.
- T. Wöhrle, I. Wurzbach, J. Kirres, A. Kostidou, N. Kapernaum, J. Litterscheidt, J. C. Haenle, P. Staffeld, A. Baro, F. Giesselmann and S. Laschat, Chem. Rev., 2016, 116, 1139–1241 CrossRef PubMed.
- (a) X. Dou, W. Pisula, J. Wu, G. J. Bodwell and K. Müllen, Chem. – Eur. J., 2007, 14, 240–249 CrossRef PubMed; (b) Y. Hirai, H. Monobe, N. Mizoshita, M. Moriyama, K. Hanabusa, Y. Shimizu and T. Kato, Adv. Funct. Mater., 2008, 18, 1668–1675 CrossRef CAS; (c) Y. F. Bai, K. Q. Zhao, P. Hu, B. Q. Wang and Y. Shimizu, Mol. Cryst. Liq. Cryst., 2009, 509, 60/[802]–76/[818] Search PubMed; (d) B. Bai, C. Zhang, J. Wei, J. Ma, X. Lin, H. Wang and M. Li, RSC Adv., 2013, 3, 12109–12116 RSC; (e) E. Diaz, E. Elgueta, S. A. Sanchez, J. Barbera, J. Vergara, M. Parra and M. Dahrouch, Soft Matter, 2017, 13, 1804–1815 RSC; (f) S. K. Pathak, B. Pradhan, M. Gupta, S. K. Pal and A. A. Sudhakar, Langmuir, 2016, 32, 9301–9312 CrossRef CAS PubMed.
- (a) S. K. Pathak, B. Pradhan, R. K. Gupta, M. Gupta, S. K. Pal and A. S. Achalkumar, J. Mater. Chem. C, 2016, 4, 6546–6561 RSC; (b) S. K. Pathak, M. Gupta, S. K. Pal and A. S. Achalkumar, ChemistrySelect, 2016, 1, 5107–5120 CrossRef CAS; (c) B. Pradhan, M. Gupta, S. K. Pal and A. S. Achalkumar, J. Mater. Chem. C, 2016, 4, 9669–9673 RSC; (d) B. Pradhan, V. M. Vaisakh, G. G. Nair, D. S. S. Rao, S. K. Prasad and A. A. Sudhakar, Chem. – Eur. J., 2016, 22, 17843–17856 CrossRef CAS PubMed.
- (a) S. K. Pathak, R. K. Gupta, S. Nath, D. S. S. Rao, S. K. Prasad and A. S. Achalkumar, J. Mater. Chem. C, 2015, 3, 2940–2952 RSC; (b) S. K. Pathak, S. Nath, R. K. Gupta, D. S. S. Rao, S. K. Prasad and A. S. Achalkumar, J. Mater. Chem. C, 2015, 3, 8166–8182 RSC.
- (a) C. Adachi, T. Tsutui and S. Saito, Appl. Phys. Lett., 1990, 56, 799–801 CrossRef CAS; (b) H. Antoniadis, M. Inbasekaran and E. P. Woo, Appl. Phys. Lett., 1998, 73, 3055–3057 CrossRef CAS; (c) N.-X. Hu, M. Esteghamatian, S. Xie, Z. Popovic, Ah.-M. Hor, O. Beng and S. Wang, Adv. Mater., 1999, 11, 1460–1463 CrossRef CAS; (d) S. Tao, Z. Peng, P. Wang, C.-S. Lee and S.-T. Lee, Adv. Funct. Mater., 2005, 15, 1716–1721 CrossRef CAS.
- A. Takahashi, M. Sakai and T. Kato, Polym. J., 1980, 12, 335–341 CrossRef CAS.
- (a) Z.-X. Liu, Y. Feng, Z.-C. Yan, Y.-M. He, C.-Y. Liu and Q.-H. Fan, Chem. Mater., 2012, 24, 3751–3757 CrossRef CAS; (b) A. Gopal, R. Varghese and A. Ajayaghosh, Chem. – Asian J., 2012, 7, 2061–2067 CrossRef CAS PubMed; (c) Q. G. Wang, J. L. Mynar, M. Yoshida, E. Lee, M. Lee, K. Okuro, K. Kinbara and T. Aida, Nature, 2010, 463, 339–343 CrossRef CAS PubMed; (d) H. M. Wang, C. H. Yang, M. Tan, L. Wang, D. L. Kong and Z. M. Yang, Soft Matter, 2011, 7, 3897–3905 RSC.
- L. E. Buerkle and S. J. Rowan, Chem. Soc. Rev., 2012, 41, 6089–6102 RSC.
- (a) S. K. Pathak, B. Pradhan, R. K. Gupta, M. Gupta, S. K. Pal and A. S. Achalkumar, J. Mater. Chem. C, 2016, 4, 6546–6561 RSC; (b) A. P. Sivadas, N. S. S. Kumar, D. D. S. Varghese, S. K. Prasad, D. S. S. Rao and S. Das, J. Am. Chem. Soc., 2014, 136, 5416–5423 CrossRef CAS PubMed.
- J. Mei, N. L. C. Leung, R. T. K. Kwok, J. W. Y. Lam and B. Z. Tang, Chem. Rev., 2015, 115, 11718–11940 CrossRef CAS PubMed.
- Photophysics of Aromatic Molecules, ed. J. B. Birks, Wiley, London, 1970 Search PubMed.
- (a) C. G. Robertson and X. Wang, Phys. Rev. Lett., 2005, 95, 075703 CrossRef PubMed; (b) P. Sollich, F. Lequeux, P. Hebraud and M. E. Cates, Phys. Rev. Lett., 1997, 78, 2020–2023 CrossRef CAS; (c) H. M. Wyss, K. Miyazaki, J. Mattsson, Z. Hu, D. R. Reichman and D. A. Weitz, Phys. Rev. Lett., 2007, 98, 238303 CrossRef PubMed; (d) S. K. Pal, A. Agarwal and N. L. Abbott, Small, 2009, 5, 2589–2596 CrossRef CAS PubMed.
- S. B. Ross-Murphy, J. Rheol., 1995, 39, 1451–1463 CrossRef CAS.
Footnote |
| † Electronic supplementary information (ESI) available. See DOI: 10.1039/c7me00040e |
| This journal is © The Royal Society of Chemistry 2017 |

