
 Open Access Article
 This Open Access Article is licensed under a Creative Commons Attribution-Non Commercial 3.0 Unported Licence
An ultra-small, multi-point, and multi-color photo-detection system with high sensitivity and high dynamic range†
Takashi
Anazawa
 *a and
Motohiro
Yamazaki
b
*a and
Motohiro
Yamazaki
b
aHitachi, Ltd., Research & Development Group, Japan. E-mail: takashi.anazawa.rc@hitachi.com
bHitachi High-Technologies Corporation, Science & Medical Systems Business Group, Japan
First published on 8th November 2017
Abstract
Although multi-point, multi-color fluorescence-detection systems are widely used in various sciences, they would find wider applications if they are miniaturized. Accordingly, an ultra-small, four-emission-point and four-color fluorescence-detection system was developed. Its size (space between emission points and a detection plane) is 15 × 10 × 12 mm, which is three-orders-of-magnitude smaller than that of a conventional system. Fluorescence from four emission points with an interval of 1 mm on the same plane was respectively collimated by four lenses and split into four color fluxes by four dichroic mirrors. Then, a total of sixteen parallel color fluxes were directly input into an image sensor and simultaneously detected. The emission-point plane and the detection plane (the image-sensor surface) were parallel and separated by a distance of only 12 mm. The developed system was applied to four-capillary array electrophoresis and successfully achieved Sanger DNA sequencing. Moreover, compared with a conventional system, the developed system had equivalent high fluorescence-detection sensitivity (lower detection limit of 17 pM dROX) and 1.6-orders-of-magnitude higher dynamic range (4.3 orders of magnitude).
Introduction
Multi-point, multi-color fluorescence detection is a widely used fundamental technique in chemical, medical, and life sciences. In various applications, much information from many samples is derived in parallel through analyzers utilizing the technique. For example, as for a real-time PCR (qPCR),1–3 in multiple samples or multiple fractions of a sample held in separated tubes, wells of a microtiter plate or a dedicated plate, or droplets in oil, multiple target DNA fragments are simultaneously amplified, and respective multi-color fluorescence emissions are independently detected to absolutely quantify the multiple target-DNA fragments in the original samples. Although commercial analyzers of a droplet digital PCR (ddPCR)4,5 detect multi-color fluorescence from droplets in oil flowed at high speed in a single channel, to further enhance throughput, simultaneous detection of multi-color fluorescence from droplets in multiple channels is strongly demanded. To detect multiple mutations, melting curves of multiple samples are analyzed by using similar analyzers to those used for qPCR.6,7 As for nucleic-acid-hybridization-based analysis on a microarray plate8,9 or a microtiter plate,10 multiple target DNA or RNA fragments are immobilized and independently detected. As for an antigen–antibody-reaction-based immunoassay on a microarray plate11,12 or a microtiter plate,13 multiple target proteins are immobilized and independently detected.Particularly for DNA sequencing, multi-point, multi-color fluorescence detection is indispensable. As for Sanger DNA sequencing,14,15 plural DNA fragments labeled with different fluorophores for four kinds of nucleotide at their terminals are prepared from a sample and electrophoretically separated in each capillary of a capillary array,14 or in each channel of a microchip-channel array,15 and fluorescence from each capillary or channel is simultaneously (or sequentially) and spectroscopically detected. STR genotyping16–18 is carried out by using similar analyzers to those used for Sanger DNA sequencing. As for next-generation DNA sequencing,19 plural DNA fragments are separately colonized on a plate and incorporated step-by-step by any of four kinds of nucleotide labeled with different fluorophores, and at each step, fluorescence from each colony is simultaneously and spectroscopically detected. As for single-molecule real-time DNA sequencing,20 a single molecule of a DNA fragment is immobilized in each waveguide of a zero-mode-waveguide array and continuously incorporated by any of four kinds of nucleotide labeled with different fluorophores, and fluorescence from each molecule in each waveguide is simultaneously and spectroscopically detected in real time. As for nanopore DNA sequencing,21 a single molecule of a DNA fragment entirely labeled with two kinds of fluorophore based on the base sequence of the molecule is translocated through each nanopore of a nanopore array, and fluorescence from each molecule at each nanopore is simultaneously and spectroscopically detected in real time.
Multi-point, multi-color fluorescence detection is becoming more important in flow cytometric analysis. As for flow cytometric analysis of single cells,22,23 single cells labeled with two or three kinds of fluorophore are flowed in each channel of a channel array of a microchip, and to obtain high-content information concerning individual cells, fluorescence from each single cell in each channel is simultaneously and spectroscopically detected.
An optical system for multi-point, multi-color fluorescence detection is usually composed of a single, common collimating lens to collect fluorescence emitted from multiple points and a single, common focusing lens to image it on a sensor. A microscope objective lens or a camera lens is used as the collimating lens. A microscope objective lens, a camera lens, or a simpler lens (e.g., a single lens) is also used as the focusing lens. The sensor is a two-dimensional sensor (e.g., CCD or CMOS), a one-dimensional (linear) sensor (e.g., photo-diode array), or a dimensionless sensor (e.g., PMT). Fluorescence from all of the multiple points or a part (e.g., only a single point) of them is simultaneously and independently detected by the optical system. In the latter case, the part is scanned across all the multiple points by mechanically changing the relative position of the optical system to the multiple points. In addition to the above components, a long-pass filter to cut excitation light and a spectroscopic means for detecting multi-color fluorescence are inserted between the two lenses. The spectroscopic means can be categorized as time-division filters9,12,19 dichroic mirrors,4,5,15,16,20–22 or wavelength dispersion.8,10,17,18,23 With time-division filters, each of the different plural wavelength-band-pass filters is mechanically and sequentially inserted. With dichroic mirrors, a single dichroic mirror or a series of plural dichroic mirrors is used to split the fluorescence flux into plural fluxes with different wavelength bands. When the plural fluxes travel in different directions, plural focusing lenses and plural sensors are used to detect each flux. With wavelength dispersion, a grating, a prism, or an acousto-optic tunable filter (AOTF) is used to obtain a fluorescence spectrum.
Each of the above optical systems is large and occupies a significant part of the analyzer. To realize compact and inexpensive analyzers, therefore, miniaturizing the optical system is important. Such analyzers will rapidly become widespread; that is, not only scientists but also ordinary people will execute various applications using such analyzers to support their healthcare. Multi-point fluorescence-detection systems have been miniaturized in various studies.23–26 In each system, a two-dimensional sensor is placed close to multiple points, and fluorescence emitted from those points is directly incident onto and detected by the sensor through an emission filter without use of any lenses between the multiple points and the sensor.23–25 Alternatively, fluorescence emitted from the multiple points is imaged by a camera of a cell phone through an emission filter.26 In these optical systems, a pinhole array,23 a spatial modulation,24 or a temporal modulation26 is used to increase spatial resolution. However, fluorescence-detection sensitivity is not high (lower fluorophore concentration detection-limit of about 1 μM), and multi-color fluorescence cannot be detected by these optical systems.
As a representative conventional optical system for detecting multi-point and multi-color fluorescence with high fluorescence-detection sensitivity, the optical system of a Sanger DNA sequencing analyzer (e.g., Applied Biosystems™ 3500xL Genetic Analyzer) is explained below.18,27 Fluorescence emitted from 24 points with intervals of 0.37 mm (forming an 8.5 mm-wide one-dimensional array in which 24 capillaries are irradiated by a laser beam) is collimated by a camera lens (f = 50 mm and F = 1.4, i.e., effective diameter of 35.7 mm) to form a fluorescence flux. The flux is passed through a long-pass filter and a transmission grating and then focused by another camera lens (f = 50 mm and F = 1.4) to form spectrum images of fluorescence (500–700 nm) from the 24 points on a two-dimensional CCD. Because the direction of wavelength-dispersion is perpendicular to the direction of the multi-point array, each fluorescence spectrum image is independently and simultaneously detected. For each point, fluorescence-detection sensitivity is high (i.e., lower fluorophore concentration detection-limit of ∼20 pM), and the dynamic range is also high (2.7-orders-of-magnitude fluorophore-concentration range). The “size” of the optical system (defined as the size occupied by the optical system between the multiple points and the sensor surface of the CCD) is 2 × 106 mm3 (100 × 100 × 200 mm). Note that the size does not include parts surrounding the optical system, such as holders of components, and interspaces between the optical system and other systems.
In the present study, an ultra-small optical system for multi-point, multi-color fluorescence detection was developed. Specifically, the optical system of a four-capillary-array DNA sequencer with four-color fluorescence detection was miniaturized by three orders of magnitude. As for detecting fluorescence on four points with this optical system, sensitivity is as high as and crosstalk between adjacent points is as low as those of a conventional optical system. Moreover, the dynamic range is more than one order of magnitude higher than that of a conventional system. These advantageous features of the developed optical system make it possible to provide not only a compact and inexpensive capillary-array DNA sequencer but also other analyzers equipped with a multi-point, multi-color detection system.
Results and discussion
System concept
A four-emission-point, four-color photo-detection system is schematically illustrated in Fig. 1a and b. In the following description, suffixes i (i = 1, 2, 3, and 4) and j (j = 1, 2, 3, and 4) indicate emission-point number and color number, respectively. First, light rays from a four-emission-point array Ei (each point with a diameter dp and an interval p) are respectively collimated to give a four-flux array Fi by a four-lens array Li (each lens with effective diameter D, focal length f, and interval p). Each axis of Li coincides with the center of the corresponding Ei, and all axes of Li and Fi are parallel to each other. Second, each Fi is split into a four-color-flux array Cij (Ci1, Ci2, Ci3, and Ci4 indicated by green, yellow, orange, and red) for each i (making a total of sixteen color fluxes) by a four-dichroic-mirror array Mj (with interval q (>p) and at 45° inclination to the axis of Fi). The direction of the line on which each Mj is arrayed (hereafter, “array direction”) is perpendicular to the array directions of Ei and Li. Each axis of Cij is parallel to each axis of Li. Third, each Cij is perpendicularly input into an image-sensor surface S, and the resultant sixteen images, Sij (with diameter dsj and interval p along the array directions of Ei and Li and q along the array direction of Mj), of the four emission points are detected by the image sensor. | ||
| Fig. 1 Diagram of an ultra-small four-color (Cij) detection system for a four-emission-point array (Ei), where i = 1 to 4 (emission-point number) and j = 1 to 4 (color number), using a four-lens array (Li), a four-dichroic-mirror array (Mj), and an image sensor (S); dp: diameter of Ei; f: focal length of Li; D: effective diameter of Li; g: emission-point distance; hj: sensor distance for Cij; p: intervals between emission points (Ei) and between lenses (Li); q: interval between mirrors (Mj); and dsj: diameter of image of Cij. (a) Cross-sectional view perpendicular to Ei and (b) planar view parallel to Ei. (c) Optimal conditions for an ultra-small detection system with high sensitivity and low crosstalk, where dp = 0.05 mm, p = 1 mm, and p < q. | ||
A challenge regarding the above-described system is to achieve photo-detection with both high sensitivity and low crosstalk for all emission points, because those two features have a trade-off relation as explained below. In particular, dsj changes with optical length between Li and S (sensor distance, h); that is, ds1 at h = h1 for Si1, ds2 at h = h2 for Si2, ds3 at h = h3 for Si3, and ds4 at h = h4 for Si4 differ because each emission point has a finite diameter (dp > 0), so all color fluxes (Cij) are not completely parallel. For low crosstalk, to avoid overlap between any two images (Sij), it is important to minimize maximum dsj. Under practical conditions, ds1 < ds2 < ds3 < ds4 because 0 < h1 < h2 < h3 < h4; therefore, maximum dsj is minimized when ds4 is minimized; that is, each emission point is focused at h = h4 or Ci4 is just focused on S by setting the distance between Ei and Li (emission-point distance, g) as
 | (1) |
 | (2) |
 | (3) |
On the other hand, as for the conditions for high sensitivity, light-collection efficiency of Li must be increased. Therefore, the effective F-number (Fe) of Li (Fe = g/D = (1 + f/(h4 − f)) * f/D) must be less than a specific target F-number (F0): Fe < F0; that is,
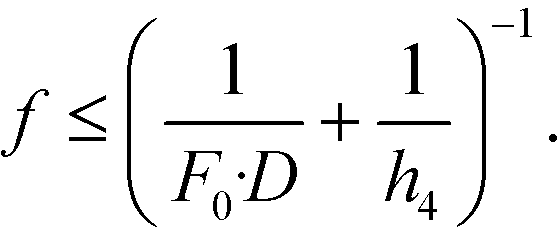 | (4) |
As described above, eqn (3) and (4) obviously express a trade-off relation; namely, larger f and smaller h4 are preferable for low crosstalk, whereas smaller f and larger h4 are preferable for high sensitivity. Eqn (3) and (4) are expressed in Fig. 1c, where dp = 0.05 mm, p = 1 mm, D = 1.13 mm, F0 = 2.0, 1.4, or 1.0, the horizontal axis is h4, and the vertical axis is f. Here, the shape of each Li is assumed as a 1 × 1 mm square, which gives D = 1.13 mm. The region below each dashed line indicates the high-sensitivity conditions given by eqn (4), and the region above the solid line indicates the low-crosstalk conditions given by eqn (3). Therefore, the region between the dashed line and the solid line indicates both conditions; namely, the gray region indicates both high sensitivity with Fe < 2.0 and low crosstalk. As shown by the gray region, high sensitivity and low crosstalk are concurrently achievable only when the developed system is miniaturized such that 0 < f < 2.2 mm and 0 < h4 < 45 mm.
System development
The developed system is shown in Fig. 2. A perspective view of the system, where practical fluxes obtained by light ray-trace simulation are overlaid, is shown in Fig. 2a. A cross-sectional view, where ideally complete parallel fluxes are overlaid, and the part between Ei and Li is not illustrated, is shown in Fig. 2b. As shown in Fig. 2a, the system is composed of a four-emission-point array Ei (each point has a circular shape with dp = 0.05 mm and p = 1 mm), a four-lens array Li (each lens has a 1 × 1 mm square shape with thickness of 1 mm, D = 1.13 mm, f = 1.44 mm, and p = 1 mm) as indicated by the enlarged view in the figure, a long-pass filter LF (with a size of 15 × 3 × 1 mm), a four-dichroic-mirror array Mj (each mirror with a size of 15 × 3 × 1 mm and q = 2.5 mm), and a CMOS image sensor (with the surface indicated by S). Front surfaces of M1, M2, M3, and M4 are indicated in green, yellow, orange, and red, respectively. As shown in Fig. 2b, to miniaturize the optical system, i.e., shorten hj, mirrors with the above-mentioned small size were arrayed in a stepwise manner to compensate parallel displacement of each Fi by refraction in each Mj (see “dichroic-mirror arrays in stepwise and non-stepwise manners” in the ESI†). As a result, short sensor distances of h = h1 = 9.7 mm (10.4 mm), h = h2 = 11.8 mm (12.1 mm), h = h3 = 14.3 mm (15.0 mm), and h = h4 = 16.8 mm (17.8 mm) as well as a wide aperture of W = 1.4 mm were obtained. Here, the sensor distances are corrected for extension of optical length by light transmission through Mj (made of quartz). Uncorrected sensor distances (physical sensor distances) are indicated in brackets above. Aperture W is defined as the width of the widest parallel flux that is totally passed through LF and split by Mj into Ci1, Ci2, Ci3, and Ci4 indicated in green, yellow, orange, and red, respectively, as shown in Fig. 2b. Because W is larger than any widths of Fi and Cij in the array direction of Mj (which is smaller than width of Li in the same direction, namely, 1 mm), all rays emitted from Ei and collected by Li are incident on S without any light loss due to vignetting in the four-dichroic-mirror array. When four mirrors (Mj) with the same size and the same interval are arrayed in a non-stepwise manner, W considerably decreases from 1.4 mm to 0.03 mm (only 3% of the rays is incident on S); it is therefore impossible to achieve highly sensitive photo-detection (also see the same section in the ESI†). The above conditions (i.e., f = 1.44 mm and h4 = 16.8 mm) are indicated by the black dot in the gray region in Fig. 1c. These conditions therefore enable a low-crosstalk, high-sensitivity, and ultra-small system to be fabricated. The distance between Ei and S is only 12.0 mm. That is, Ei, Li, LF, and Mj are directly mountable on S. The size of the system is just 15.0 × 10.2 × 12.0 mm (1836 mm3), which is three orders of magnitude smaller than that of a conventional system. The emission-point distance was set as g = 1.57 mm according to eqn (1) (i.e., distance between Li and S was 10.4 mm as shown in Fig. 2b), when the four color fluxes (Ci4) were focused on S with ds4 = 0.54 mm (<p = 1 mm) given by eqn (2), and the conditions for low crosstalk, given by eqn (3), were satisfied. Additionally, because D = 1.13 mm, Fe = g/D = 1.39, which corresponds to a one-half light-collection angle of 21°, or NA = 0.36, the conditions for high sensitivity, given by eqn (4), where F0 = 1.4, were also satisfied. | ||
| Fig. 2 Design of the developed ultra-small system with a size of 15.0 × 10.2 × 12.0 mm. (a) Perspective view overlaying ray-trace simulation fluxes of rays emitted from Ei (black lines are rays from E1 and E3, and blue lines are rays from E2 and E4); LF: long-pass filter; Sij: image of Cij. (b) Cross-sectional view overlaying complete parallel light fluxes; hj: sensor distances for color number j; W: aperture of the system. | ||
Results of a ray-trace simulation of 600 nm-wavelength rays emitted from Ei and collected by Li are shown in Fig. 2a, where the one-half light-emission angle from Ei was 21°, which is equal to the one-half light-collection angle of Li. To improve visualization, rays from P1 and P3 are indicated by black lines, and rays from P2 and P4 are indicated by blue lines, respectively. Four circular images of Si1, Si2, Si3, and Si4 (for each i, a total of sixteen circular images) on S are indicated in green, yellow, orange, and red, respectively. As shown in Fig. 2b, the intervals between S1j and S2j, S2j and S3j, and S3j and S4j are respectively p = 1 mm, those between Si2 and Si3, and Si3 and Si4, are respectively q = 2.5 mm, and the interval between Si1 and Si2 is 2.1 mm. The aspheric surface shape and refractive index of each lens used in the simulation were complied with actual specifications published by the manufacturer of the lens. Therefore, unlike ideal optical calculations based on eqn (1) to (4) and Fig. 1c, the present simulation considered aberrations of each lens. As a result, ds1 = 0.57 mm, ds2 = 0.53 mm, ds3 = 0.51 mm, and ds4 = 0.64 mm (where each dsj is the full-width at 10% maximum) were obtained (see “intensity profile and size of emission-point image” in the ESI†). The simulated value of ds4 (0.64 mm) is slightly larger than the ideal value of ds4 (0.54 mm) by eqn (2). On the other hand, when the one-half light-emission angle from Ei was reduced to 10°, ds1 = 0.42 mm, ds2 = 0.46 mm, ds3 = 0.50 mm, and ds4 = 0.55 mm were obtained (see the same section in the ESI†). In this case, the simulated value of ds4 (0.55 mm) agrees well with the ideal value of ds4 (0.54 mm) given by eqn (2). These results indicate dsj slightly increases with an increase of the one-half light-emission angle from Ei because of aberrations caused by the marginal part of Li. However, even when the one-half light-emission angle from Ei is 21°, because all dsj values are less than the interval between any two images (Sij), any two images do not overlap, as shown in Fig. 2a; that is, low crosstalk photo-detection is achieved.
As shown in Fig. 3a, the four-emission-point array (Ei) was formed by illuminating halogen-lamp light onto a stainless-steel-plate (with a size of 15 × 15 mm and thickness of 0.1 mm) with a four-pinhole array from underneath. The diameters and intervals of the four pinholes were φ0.05 ± 0.002 mm and 1 mm, respectively. On the other hand, as shown in Fig. 3c, the four-lens array Li was fabricated by cutting four φ2.4 mm lenses (one of which is shown in Fig. 3b) into four 1 × 1 mm square lenses (as indicated by a dashed square in Fig. 3b) and adhering them side-by-side at intervals of 1 mm (see the Experimental section for details). Subsequently, as shown in Fig. 4a–d, which are a series of photographs of the same field of perspective view taken by a fixed camera, four-emission-point, four-color photo-detection by the system shown in Fig. 2 was demonstrated. First, the four-emission-point array (shown in Fig. 3a) was placed horizontally (Fig. 4a). The one-half light-emission angle upward from each pinhole was approximately 10°. Second, the four-lens array (shown in Fig. 3c) was positioned above the four-emission-point array (Fig. 4b). Third, the four-dichroic-mirror array (Mj) with the long-pass filter was positioned above the four-lens array (Fig. 4c). Fourth, a piece of powder paper with a size of 10 × 10 mm was placed on the four-dichroic-mirror array (Fig. 4d). Consequently, the sixteen circular images (Sij) could be observed on the paper by the human eye. According to the transmission spectra shown in Fig. 4e, and the simulation results shown in Fig. 2a, the four circular images of Si1, Si2, Si3, and Si4 (for each i, a total of sixteen circular images) appeared green, yellow, orange, and red, respectively. Transmission spectra for Ci1, Ci2, Ci3, and Ci4, normalized to Fi are shown by green, yellow, orange, and red lines, respectively, in Fig. 4e. Wavelength bands of Ci1, Ci2, Ci3, and Ci4 with transmittance of more than 50% are 520–555 nm, 555–585 nm, 585–620 nm, and 620–675 nm, respectively. Not only is the spectral resolution between any two-color fluxes (Cij) high but also the maximum transmittance for each Cij is more than 90%. Finally, after the paper was removed, the CMOS image sensor was positioned on the four-dichroic-mirror array. Then, as shown in Fig. 4f, an image with a size of 10 × 5 mm (1538 × 769 pixels) containing the sixteen circular images (Sij) was obtained. There is no overlap (no crosstalk) between any two images (Sij). By adjusting the emission-point distance as g = 1.57 mm, Si4 is just in focus whereas Si1, Si2, and Si3 are slightly out of focus (see “intensity profile and size of emission-point image” in the ESI†). The light intensity of Si3 is smaller than that of Si1, Si2, and Si4 because of a smaller spectral overlap of the halogen-lamp-light spectrum and transmission spectrum for Ci3, especially in the range of >700 nm (not shown in Fig. 4e). Intervals between images (Sij) agree with those in Fig. 2a, although they vary slightly due to imperfect assemblies of the four-lens array and the four-dichroic-mirror array. The diameters of Sij are ds1 = 0.40 ± 0.01 mm, ds2 = 0.45 ± 0.01 mm, ds3 = 0.48 ± 0.01 mm, and ds4 = 0.54 ± 0.01 mm (average ± standard deviation for i, where each dsj is the full-width at 10% maximum) were obtained (see the same section in the ESI†). These experimental values of dsj agree well with the simulated values of dsj (ds1 = 0.42 mm, ds2 = 0.46 mm, ds3 = 0.50 mm, and ds4 = 0.55 mm) when the one-half light-emission angle is 10° and smaller than the interval between any two images.
 | ||
| Fig. 3 Components of the ultra-small system demonstrated in Fig. 4. Scale bars are 3 mm. (a) Four-emission-point array (Ei) with diameters and intervals of φ0.05 and 1 mm, respectively, formed by illuminating a halogen-lamp light onto a four-pinhole-array plate from underneath. (b) Glass-molded plano-convex aspheric lens with an outer diameter of φ2.4 mm and a clear aperture with diameter of φ1.6 mm. (c) Four-lens array (Li) fabricated by cutting four of the lens in (b) along the dashed square into four 1 × 1 mm square lens and adhering them at intervals of 1 mm in the holder. | ||
 | ||
| Fig. 4 Demonstration of four-color, four-emission-point detection by the ultra-small system. (a)−(d) A series of photographs of the same field of perspective view taken by a fixed camera: (a) four-emission-point array Ei (shown in Fig. 3(a)); (b) four-lens array Li (shown in Fig. 3(c)) positioned above Ei; (c) four-dichroic-mirror array Mj positioned above Li; (d) a piece of 10 × 10 mm powder paper placed on Mj for displaying sixteen visible circular images (Sij); (e) total transmission spectra for Ci1, Ci2, Ci3, and Ci4; and (f) sixteen circular images (Sij) taken by a CMOS image sensor placed on Mj. | ||
Capillary-array electrophoresis
For a more practical demonstration of the developed multi-point, and multi-color photo-detection system, the system was applied to capillary-array electrophoresis. As shown in Fig. 5, a four-capillary array Pi (with outer and inner diameters of 0.36 mm and 0.05 mm, respectively) was formed by a stainless-steel holder composed of parts A (PA) and B (PB). Four grooves and four pinholes (Hi, with diameters of φ0.2 mm) at the centers of the grooves were formed on part A at intervals of 1 mm. As shown in Fig. 5a, parts of the capillaries (polyimide coatings were removed in advance) were respectively placed on the grooves. By sandwiching the capillaries between parts A and B as shown in Fig. 5b (the capillaries and part A in Fig. 5a were flipped upside down), the capillaries were fixed on the same plane at intervals of 1 mm so that the detection points (Di) of the capillaries (Pi) were just below and on the axes of the pinholes (Hi). As schematically illustrated in Fig. 5a and b, a focused 505 nm laser beam LB (with a diameter of 0.01 mm and a power of 15 mW, Showa Optronics Co., Ltd.) was input through the side of the plane between parts A and B and simultaneously and uniformly irradiated the detection points (Di) by a technique called multiple-laser-beam focusing.14 As shown in Fig. 5c and d, one of the pinholes was observed from the perpendicular direction to the front surface of part A in Fig. 5b. Microscopy images focused on the pinhole and on the inside wall of the capillary through the pinhole are shown in Fig. 5c and d, respectively. Because both side edges of the inside wall are observed, although those of the outside wall are not observed through the pinhole, as shown in Fig. 5d, laser-induced fluorescence from the inside is passed through the pinhole, whereas laser-scattering light from the outside wall is cut out by the pinhole. | ||
| Fig. 5 Four-capillary array (Pi) formed by a holder composed of part-A PA and part-B PB and irradiated by a laser beam LB. (a) Four capillaries (Pi) placed on the four grooves on PA at intervals of 1 mm and irradiated by the LB at four detection positions (Di). Four pinholes (Hi) are formed through PA and just below Di. (b) Four capillaries (Pi) sandwiched by PA and PB. (c) and (d) Microscopy images of one Hi, focusing on the pinhole and the inside wall of the capillary through the pinhole, respectively. | ||
The four-capillary array with the laser beam shown in Fig. 5b was connected to the developed ultra-small optical system shown in Fig. 2a so that Di was positioned at Ei for each i and that the axes of the capillaries were perpendicular to the array directions of the four-emission points and four lenses but parallel to the sensor surface (see “four-capillary array detection system” and Fig. S3 in the ESI†). The detection points functioned as emission points; that is, dp = 0.05 mm, p = 1 mm, and the distance between each lens and the plane was g = 1.57 mm. Fluorescence and background light from the emission points were detected by the optical system. Instead of sixteen circular images, Sij in Fig. 2a, sixteen rectangular images were obtained on the sensor surface by light ray-trace simulations, as shown in Fig. S3.† This is because the shape of each emission point is not circular with a diameter of dp = 0.05 mm but rectangular with a width of dp = 0.05 mm (inner diameter of the capillary) and a height of 0.01 mm (laser-beam diameter). Because both the width and height of each rectangular emission point are smaller than those of each circular emission point, any two of the rectangular images do not overlap; that is, low-crosstalk fluorescence detection is achieved.
CMOS images for 8 M urea solutions containing 100 nM dR110 (λmax = 541 nm), 100 nM dR6G (λmax = 568 nm), 100 nM dTAMRA (λmax = 595 nm), and 100 nM dROX (λmax = 618 nm) injected into the four capillaries are shown in Fig. 6a–d, respectively. In each CMOS image, as shown by the simulation results in Fig. S3,† the sixteen rectangular images (Sij) were observed without mutual overlap. The fluorescence intensity of Sij changes with the color number j but stays almost constant with the emission-point number i (between the four capillaries). The patterns of change in the fluorescence intensity of Si1, Si2, Si3, and Si4 obviously differ for the four CMOS images, that is, the four kinds of fluorophore. For each fluorophore, relative fluorescence intensities accumulated in Si1, Si2, Si3, and Si4 with reference to the maximum fluorescence intensity are respectively shown in Fig. 7a. Each column and error bar respectively indicate the average and standard deviation of relative fluorescence intensity on the four capillaries. These results agree well with relative fluorescence intensities calculated from the product of the transmission spectra for Ci1, Ci2, Ci3, and Ci4 shown in Fig. 4e and the fluorescence spectra of the four kinds of fluorophore. Because the patterns of change in the fluorescence intensity of Si1, Si2, Si3, and Si4 for the four kinds of fluorophore differ significantly, it is possible to quantify the concentration of each fluorophore on each capillary (even when more than two kinds of fluorophore coexist on the detection point) by deconvolution of spectral overlaps between the four kinds of fluorophore shown in Fig. 7a.
 | ||
| Fig. 6 CMOS images obtained by the developed ultra-small optical system for 8 M urea solutions containing (a) 100 nM dR110, (b) 100 nM dR6G, (c) 100 nM dTAMRA, and (d) 100 nM dROX injected into the four capillaries. Sixteen rectangular images (Sij) were observed in each CMOS image. | ||
 | ||
| Fig. 7 Four-color fluorescence detection of the four-capillary array by the developed ultra-small optical system. (a) Relative fluorescence intensity of Sij against color number j in Fig. 6. (b) Relative fluorescence intensity of S24 (emission-point number i = 2 (E2) and color number j =4 (C4)) against the dROX concentration when dROX with various concentrations was injected into capillary P2. (c) Sanger DNA sequencing results for 203 to 288 bases obtained by P2. | ||
The relative fluorescence intensity of S24 (i = 2 and j = 4) with reference to the fluorescence intensity of S24 at 10−11 M dROX is plotted against dROX concentration in Fig. 7b, where an 8 M urea solution containing dROX at various concentration was injected into capillary P2 and an 8 M urea solution without dROX was injected into the other capillaries (P1, P3, and P4). Relative fluorescence intensity of S24 was derived by subtracting a constant value corresponding to the pixel background intensity accumulated within S24 from the pixel signal intensity accumulated within S24. As a result, a linear relation with a slope of one ranging from 10−11 M to at least 5 × 10⁻⁷ M dROX, that is, covering a dROX concentration range of more than 4.7 orders of magnitude, was obtained. At the same time, the relative fluorescence intensities of S14, S34, and S44 are less than 0.1% of the relative fluorescence intensity of S24 at any dROX concentration. Therefore, very low crosstalk was also obtained. On the other hand, the lower concentration detection-limit was 1.7 × 10⁻¹¹ M (17 pM) dROX with a S/N of 2, where S and N are the relative fluorescence intensity and the standard deviation of the relative background intensity, respectively. Sensitivity of the developed system is as high as that of a conventional system, and the dynamic range covers dROX concentration of more than 4.3 orders of magnitude (ranging from 1.7 × 10⁻¹¹ M to at least 5 × 10⁻⁷ M dROX), namely, more than 1.6 orders of magnitude higher than that of the conventional system. Such a wide dynamic range was obtained because the area of each rectangular image (Sij) is approximately two orders of magnitude larger than the area of each emission point (Ei) (i.e., magnification ratio of 11.5); therefore, the detectable photon number without detector saturation for each Sij is approximately two orders of magnitude higher than that for a conventional system using a zero-magnification optical system.
A representative electropherogram for DNA sequencing by capillary-array electrophoresis is shown in Fig. 7c. Similar results were obtained by the other three capillaries. In each capillary, DNA fragments labeled with four kinds of fluorophore were electrophoretically separated, and laser-induced fluorescence was detected and deconvoluted to give each fluorophore concentration at arbitrary time points. Read length and migration time were comparable to those obtained by a conventional system under the same electrophoretic conditions (approximately 750 bases and 60 min).
Outlook
Based on the developed optical system, several advanced systems, as described below, that maintain the above-described features of the developed system can be developed.As for the first advanced system, although the four-lens array was fabricated by bonding 1 mm-square glass lenses, it is possible to fabricate a plastic-lens array with similar specifications by injection molding, which is suitable for not only mass production of the lens array at low cost but also accurate alignment of each lens. Additionally, it is also feasible to array more lenses, to array lenses more densely, and/or to array two-dimensional lenses as explained below.
As for the second, the number of the emission points from which multi-color fluorescence is independently and simultaneously detected is easily increased as long as the width of the sensor surface of a CCD or CMOS is larger than that of the emission-point array. Fluorescence from up-to-13 emission points with the same interval (p = 1 mm) is detectable only by increasing the number of identical lens in the developed system (where the sensor width of the CMOS is 13.312 mm). When the sensor is replaced with a wider one, for example, a front-illuminated CCD area image sensor S9979 (Hamamatsu Photonics K.K.) with width of 73.728 mm, fluorescence from up to 73 points is detectable. Of course, it is possible to easily array multiple image sensors to have a much larger width and to detect fluorescence from significantly more emission points.
As for the third, fluorescence from more densely arrayed emission points (p < 1 mm), that is, more emission points, is also detectable. For example, fluorescence from emission points arrayed four-times-more densely (i.e., four-times more emission points) with diameter of dp = 0.01 mm and interval of p = 0.25 mm is detectable by 0.25 mm-square lenses (with f = 0.4 mm and p = 0.25 mm) and a smaller four-dichroic-mirror array (with h4 = 10.0 mm). In this case, because ds4 = 0.24 mm < p = 0.25 mm, the conditions for low crosstalk, i.e., eqn (3), are satisfied. On the other hand, because g = 0.42 mm, D = 0.28 mm, and Fe = g/D = 1.47, the conditions for high sensitivity, i.e., eqn (3), are satisfied when F0 = 1.5.
As for the fourth, it is possible to detect fluorescence from two-dimensionally arrayed emission points by sequentially scanning a field including a one-dimensional array of part of the emission points from which fluorescence is detected at a time in the perpendicular direction to the one-dimensional array. It is also effective to scan the field in the parallel direction to the one-dimensional array to detect fluorescence from a one-dimensional dense array of emission points with a smaller interval than the lens-array interval of the developed system.
As for the fifth, an array of more than four dichroic mirrors can detect more-than-four-color fluorescence. For example, eight-color fluorescence can be detected by an eight-dichroic-mirror array. Because the spectroscopic resolution is high, such fluorescence detection is practically equivalent to fluorescence-spectrum detection, which enables independent and simultaneous quantification of concentrations of coexistent and up-to-eight kinds of fluorophore.
As for the sixth, when multiple emission points are not in the capillary array or the microchip channel array, but on plates, it is necessary to combine the developed system with a fluorescence–excitation technique other than side-entry laser-beam irradiation.14,18,27 As explained below, one promising technique is to use an array of epi-illumination systems. The long-pass filter in the system shown in Fig. 2 is replaced by another dichroic mirror to separate excitation light and fluorescence. A laser-beam array is reflected onto the lens array of the developed system by the dichroic mirror in parallel, focused by the lens array, and irradiated onto the emission-point array. Fluorescence from the emission-point array is collected by the same lens array, passes through the same dichroic mirror, and is detected.
As for the seventh, it is feasible to simply replace the dichroic-mirror array and the monochrome image sensor in the developed system with a color image sensor such as a Bayer-pattern RGB-color-filtered image sensor. Even in that case, it is necessary to satisfy eqn (3) and (4), where h4 is replaced with h, that is, the sensor distance when the dichroic-mirror array is removed. In eqn (2), ds4 is replaced with ds. Thanks to recent popularization of digital color cameras, the cost of such a color sensor has been remarkably reduced. Therefore, adopting such a color sensor results in a more-inexpensive optical system or analyzer, although sensitivity and spectroscopic resolution of fluorescence detection are decreased. Moreover, it enables simultaneous detection of fluorescence from more densely and two-dimensionally arrayed emission points by two-dimensionally arrayed lenses. For example, fluorescence from two-dimensionally arrayed emission points with dp = 0.01 mm and p = 0.10 mm is independently and simultaneously detectable by two-dimensionally arrayed 0.1 mm square lenses with f = 0.15 mm, p = 0.10 mm, and h = 1.5 mm. In that case, because ds = 0.09 mm < p = 0.10 mm, the conditions for low crosstalk; i.e., eqn (3) are satisfied. On the other hand, because g = 0.17 mm, D = 0.11 mm, and Fe = g/D = 1.47, the conditions for high sensitivity, i.e., eqn (3) are satisfied when F0 = 1.5.
As for the last system, it should be noted that the developed systems are applicable to not only fluorescence detection but also absorbance detection. That is, it is possible to construct an ultra-small system for multi-emission-point, multi-color absorbance detection. In particular, rays emitted from emission points are replaced by transmitted rays through sample-solution-containing cells or channels where emission points are respectively positioned. This system opens up the way to creating more-advanced systems and various applications.
Experimental
Lens array
The four-lens array was fabricated by TOA Optical Technologies, Ltd. A commercial glass-molded plano-convex aspheric lens (LightPath® technologies, lens code: 354140, Fig. 3b) with an outer diameter of φ2.4 mm, a clear aperture of φ1.6 mm, and a height of 1 mm was cut into a 1 × 1 mm square lens with a height of 1 mm so that the central axis coincided with the optical axis (as indicated by the dashed line in Fig. 3b). The actual side length of the square lens was 0.993 ± 0.001 mm (average ± standard deviation). The optical axis deviated from the central axis by 0.001 ± 0.001 mm. The aspheric surface profile z (sag) as a function of r (radial distance from the optical axis) is given by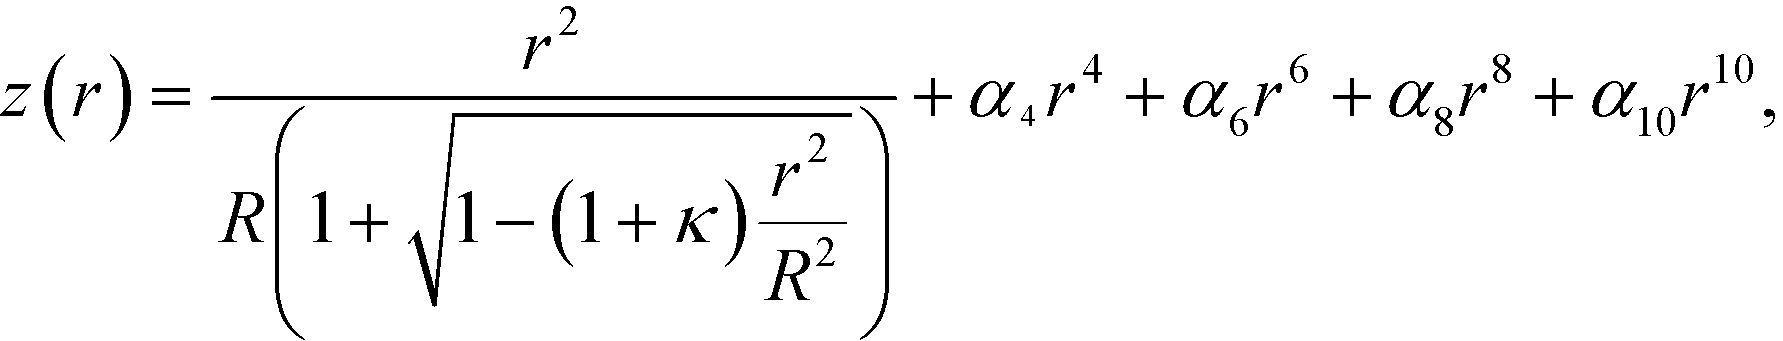 | (5) |
Four pieces of the square lens were adhered side-by-side to form the four-lens array (Fig. 3c) with a size of 1 × 4 mm and a height of 1 mm so that the four optical axes were parallel at intervals of 1 mm and the planar surfaces were in the same plane. The actual size of the four-lens array (including the adhesive) was 1.048 × 4.012 mm. The interval between the lenses was 1.006 ± 0.003 mm. The standard deviation of the positions of the four optical axes in the perpendicular direction to the four-lens array was also 0.003 mm. The difference in the levels of the planar surfaces was within 0.002 mm. As shown in Fig. 3c and 4b, the four-lens array was mounted in a planar holder with a thickness of 2 mm so that the same plane coincided with the bottom surface of the holder. The four-lens array was positioned by manipulating the holder.
Dichroic-mirror array
The long-pass filter (LF) and the four dichroic mirrors (Mj) were fabricated by Asahi Spectra Co., Ltd. Multiple thin layers of the dielectric material were respectively deposited on a quartz plate with thickness of 1 mm to meet the following specifications: LF: IA = 0°, T ≤ 0.01% at 505 nm, Tave ≥ 95% at 530–650 nm, and T ≥ 90% at 530–650 nm; M1: IA = 45°, Tave ≥ 90% at 530–545 nm, and R ≥ 95% at 565–650 nm; M2: IA = 45°, R ≥ 95% at 560–575 nm and Tave ≥ 90% at 595–650 nm; M3: IA = 45°, R ≥ 95% at 590–605 nm and Tave ≥ 90% at 625–650 nm; M4: IA = 45°, R ≥ 95% at 615–650 nm, where IA, T, Tave, and R are the incident angle, transmittance, averaged transmittance, and reflectance of unpolarized light. Measured transmission spectra of the fabricated LF and Mj (indicated by TS(LF) and TS(Mj)) are shown in Fig. S5.† According to Fig. 2b, transmission spectra for Cij (indicated by TS(Cij)) shown in Fig. 4e were obtained from the following equations: TS(Ci1) = TS(LF) × TS(M1), TS(Ci2) = TS(LF) × [1 − TS(M1)] × [1 − TS(M2)], TS(Ci3) = TS(LF) × [1 − TS(M1)] × TS(M2) × [1 − TS(M3)], and TS(Ci4) = TS(LF) × [1 − TS(M1)] × TS(M2) × TS(M3) × [1 − TS(M4)], where [1 − TS(Mj)] indicates reflection spectra of Mj. As shown in Fig. 2a, b, and 4c, each LF and Mj was cut into pieces with a size of 3 × 15 mm and mounted on a dichroic-mirror-array holder.CMOS image sensing
A C11440-52U scientific CMOS-board-level camera (Hamamatsu Photonics K.K.) was used for CMOS image sensing. The C-mount unit was removed from the board to expose the surface of the CMOS sensor on the board. The sensor area is 13.312 × 13.312 mm, composed of 2048 × 2048 pixels, each with a size of 6.5 × 6.5 μm. Full images were recorded with 16 bit A/D conversion and exposure time of 200 ms. For image analysis, parts of the acquired full images with areas of 10 × 5 mm were used, as shown in Fig. 4f and 6. For fluorescence-detection analysis (see Fig. 7a and b) and capillary electrophoresis (see Fig. 7c), full images were consecutively recorded at 5 frames per s, and accumulated fluorescence intensities in sixteen regions of interest located at Sij in the acquired full images were analyzed.Light ray-trace simulation
A 3D light-ray-trace simulation was carried out using LightTools (Synopsys' Optical Solutions Group) with the simulation models shown in Fig. 2a. A million rays with equal power at 600 nm were emitted from each emission point, and some of the rays (10![[thin space (1/6-em)]](https://www.rsc.org/images/entities/char_2009.gif) 000 rays) are displayed in Fig. 2a. The starting positions of the rays were randomly and uniformly distributed in each emission point. The directions of the rays were also randomly and uniformly distributed within a circular cone with a one-half angle (one-half light-emission angle) of 21° or 10° and an axis coinciding with the axis of each lens. For all the rays, the traveling directions of the rays refracted by Li, LF, M1, M2, and M3 and the rays reflected by M1, M2, M3, and M4 were sequentially tracked according to Snell's law and Fresnel's law. Spectroscopic properties of LF, M1, M2, M3, and M4 shown in Fig. S5† were not considered.
000 rays) are displayed in Fig. 2a. The starting positions of the rays were randomly and uniformly distributed in each emission point. The directions of the rays were also randomly and uniformly distributed within a circular cone with a one-half angle (one-half light-emission angle) of 21° or 10° and an axis coinciding with the axis of each lens. For all the rays, the traveling directions of the rays refracted by Li, LF, M1, M2, and M3 and the rays reflected by M1, M2, M3, and M4 were sequentially tracked according to Snell's law and Fresnel's law. Spectroscopic properties of LF, M1, M2, M3, and M4 shown in Fig. S5† were not considered.
Capillary electrophoresis
Solutions containing dR110, dR6G, dTAMRA, and dROX were prepared from an ABI Prism BigDye Primer Cycle Sequencing Ready Reaction Kit (Applied Biosystems™). The total and effective lengths of the four capillaries were 56 cm and 36 cm, respectively. The temperature of 32 cm regions of the capillaries between positions at 2 cm and 34 cm from the cathode ends was kept at 60 °C by placing the regions in a tube containing water continuously flowing at 60 °C. The other regions were at room temperature. A POP-7™ polymer solution (Applied Biosystems™) were injected into the capillaries from the anode ends by applying a pressure of 3 MPa for 10 min to the polymer solution. Then, for pre-electrophoresis, 10.2 kV was applied between both ends for 5 min, immersed in 1× Genetic Analyzer Buffer with EDTA (Applied Biosystems™). Next, for sample injection, with the cathode ends immersed in 3500/3500xL Sequencing Standards, BigDye Terminator v3.1 (Applied Biosystems™) dissolved in formamide according to the instructions, 1.5 kV was applied for 8 s. After that, for electrophoresis, 10.2 kV was applied.Conclusion
An ultra-small, multi-emission-point, and multi-color fluorescence-detection system with low crosstalk, high sensitivity, and high dynamic range was developed. In this system, the lens array is aligned with the emission-point array, the dichroic-mirror array is aligned perpendicularly to the emission-point array, and the two-dimensional sensor surface is placed parallel to the emission-point array, lens array, and dichroic-mirror array. Accordingly, for Sanger DNA sequencing by four-capillary-array electrophoresis, the system achieved four-emission-point, four-color fluorescence detection with a size more than three-orders-magnitude smaller than a conventional system. That is, it will enable a compact or possibly portable capillary-array DNA sequencer. Moreover, as for the developed system, because two camera lenses and transmission grating are removed, and the sizes of the long-pass filter and dichroic mirrors are smaller than those of a conventional system, the manufacturing cost is lower. The expected cost for the developed system including the lens array, the long-pass filter, the dichroic-mirror array, and their holders can be less than US$300, when the lens array is fabricated by injection molding. Therefore, a capillary-array DNA sequencer based on the developed system will be inexpensive.On the other hand, as for fluorescence detection by the developed system, whereas sensitivity is as high as that of a conventional system, the dynamic range is more than one order of magnitude higher. It is therefore possible to concurrently detect trace amounts to larger amounts of DNA fragments; that is, the developed system is more robust over a wide range of sample concentrations. This feature reduces the burden on users in terms of sample preparation or sample control. It is also possible to detect rare DNA mutation, e.g., present at <0.1%, in a background wild-type DNA.
Other than Sanger DNA sequencing and STR genotyping, these advanced systems can be used in applications such as next-generation, single-molecule real-time, and nanopore DNA sequencing. As for next-generation DNA sequencing, patterned colonies on the plate, recently distributed by Illumina as a “patterned flow cell”, are preferable to random colonies, because the lens array can be matched to the patterned colonies. The applications also include qPCR, ddPCR, melting-curve analysis, nucleic-acid-hybridization- or antigen–antibody-reaction-based analysis on a microarray plate or a microtiter plate, and flow cytometric analysis of single cells.
Conflicts of interest
There are no conflicts to declare.Acknowledgements
We thank Chihiro Uematsu and Dr. Yoshinobu Kohara of Hitachi, Ltd. for their valuable discussions on the manuscript. We also thank Takehiko Shibasaki, Dr. Ryoji Inaba, and Yoshitaka Kodama of Hitachi High-Technologies Corporation for facilitating this research.References
- H. D. VanGuilder, K. E. Vrana and W. M. Freeman, BioTechniques, 2008, 44, 619–626 CrossRef CAS PubMed.
- G. Orru, F. Coghe, G. Faa, S. Pillai, C. Manieli, C. Montaldo, F. Pilia, G. Pichiri, V. Piras and P. Coni, Diagn. Mol. Pathol., 2010, 19, 1–8 CrossRef CAS PubMed.
- M. Baker, Nat. Methods, 2012, 9, 541–544 CrossRef CAS.
- Q. Zhong, S. Bhattacharya, S. Kotsopoulos, J. Olson, V. Taly, A. D. Griffiths, D. R. Link and J. W. Larson, Lab Chip, 2011, 11, 2167–2174 RSC.
- C. M. Hindson, J. R. Chevillet, H. A. Briggs, E. N. Gallichotte, I. K. Ruf, B. J. Hindson, R. L. Vessella and M. Tewari, Nat. Methods, 2013, 10, 1003–1005 CrossRef CAS PubMed.
- X. Wang, Y. Hong, P. Cai, N. Tang, Y. Chen, T. Yan, Y. Liu, Q. Huang and Q. Li, Sci. Rep., 2017, 7, 42894 CrossRef CAS PubMed.
- Q. Huang, X. Wang, N. Tang, T. Yan, P. Chen and Q. Li, J. Mol. Diagn., 2017, 19, 567–574 CrossRef CAS PubMed.
- Z. Liu, S. Ma, Y. Ji, L. Liu, Z. Hu, J. Guo, H. Ma and Y. He, Anal. Chem., 2010, 82, 7752–7757 CrossRef CAS PubMed.
- T. Ueno and T. Funatsu, PLoS One, 2014, 9, e90920 Search PubMed.
- H. Lee, C. Kim, D. Lee, J. H. Park, P. C. Searson and K. H. Lee, Int. J. Nanomed., 2017, 12, 4397–4407 CrossRef PubMed.
- G. Yeretssian, M. Lecocq, G. Lebon, H. C. Hurst and V. Sakanyan, Mol. Cell. Proteomics, 2005, 4, 605–617 CAS.
- M. K. Han, Y. H. Oh, J. Kang, Y. P. Kim, S. Seo, J. Kim, K. Park and H. S. Kim, Proteomics, 2009, 9, 5544–5552 CrossRef CAS PubMed.
- C. Li, K. Wen, T. Mi, X. Zhang, H. Zhang, S. Zhang, J. Shen and Z. Wang, Biosens. Bioelectron., 2016, 79, 258–265 CrossRef CAS PubMed.
- T. Anazawa, S. Takahashi and H. Kambara, Anal. Chem., 1996, 68, 2699–2704 CrossRef CAS PubMed.
- I. L. Medintz, B. M. Paegel and R. A. Mathies, J. Chromatogr. A, 2001, 924, 265–270 CrossRef CAS PubMed.
- C. A. Emrich, H. Tian, I. L. Medintz and R. A. Mathies, Anal. Chem., 2002, 74, 5076–5083 CrossRef CAS PubMed.
- D. Le Roux, B. E. Root, C. R. Reedy, J. A. Hickey, O. N. Scott, J. M. Bienvenue, J. P. Landers, L. Chassagne and P. de Mazancourt, Anal. Chem., 2014, 86, 8192–8199 CrossRef CAS PubMed.
- T. Anazawa, Y. Uchiho, T. Yokoi, G. Chalkidis and M. Yamazaki, Lab Chip, 2017, 17, 2235–2242 RSC.
- D. R. Bentley, et al. , Nature, 2008, 456, 53–59 CrossRef CAS PubMed.
- J. Eid, et al. , Science, 2009, 323, 133–138 CrossRef CAS PubMed.
- B. McNally, A. Singer, Z. Yu, Y. Sun, Z. Weng and A. Meller, Nano Lett., 2010, 10, 2237–2244 CrossRef CAS PubMed.
- B. K. McKenna, J. G. Evans, M. C. Cheung and D. J. Ehrlich, Nat. Methods, 2011, 8, 401–403 CrossRef CAS PubMed.
- J. Balsam, M. Ossandon, Y. Kostov, H. A. Bruck and A. Rasooly, Lab Chip, 2011, 11, 941–949 RSC.
- M. Muluneh, B. Kim, G. Buchsbaum and D. Issadore, Lab Chip, 2014, 14, 4638–4646 RSC.
- M. Kim, M. Pan, Y. Gai, S. Pang, C. Han, C. Yang and S. K. Tang, Lab Chip, 2015, 15, 1417–1423 RSC.
- V. R. Yelleswarapu, H. H. Jeong, S. Yadavali and D. Issadore, Lab Chip, 2017, 17, 1083–1094 RSC.
- T. Anazawa, T. Yokoi and Y. Uchiho, Anal. Chem., 2015, 87, 8623–8628 CrossRef CAS PubMed.
Footnote |
| † Electronic supplementary information (ESI) available. See DOI: 10.1039/c7lc01070b |
| This journal is © The Royal Society of Chemistry 2017 |