 Open Access Article
Coplanar electrode microfluidic chip enabling accurate sheathless impedance cytometry†
Adele
De Ninno‡
a,
Vito
Errico‡
 a,
Francesca Romana
Bertani
b,
Luca
Businaro
b,
Paolo
Bisegna
*a and
Federica
Caselli
 *a
*a
aDepartment of Civil Engineering and Computer Science, University of Rome Tor Vergata, via del Politecnico 1, 00133 Rome, Italy. E-mail: bisegna@uniroma2.it; caselli@ing.uniroma2.it
bItalian National Research Council - Institute for Photonics and Nanotechnologies (CNR - IFN), via Cineto Romano 42, 00156 Rome, Italy
First published on 9th February 2017
Abstract
Microfluidic impedance cytometry offers a simple non-invasive method for single-cell analysis. Coplanar electrode chips are especially attractive due to ease of fabrication, yielding miniaturized, reproducible, and ultimately low-cost devices. However, their accuracy is challenged by the dependence of the measured signal on particle trajectory within the interrogation volume, that manifests itself as an error in the estimated particle size, unless any kind of focusing system is used. In this paper, we present an original five-electrode coplanar chip enabling accurate particle sizing without the need for focusing. The chip layout is designed to provide a peculiar signal shape from which a new metric correlating with particle trajectory can be extracted. This metric is exploited to correct the estimated size of polystyrene beads of 5.2, 6 and 7 μm nominal diameter, reaching coefficient of variations lower than the manufacturers' quoted values. The potential impact of the proposed device in the field of life sciences is demonstrated with an application to Saccharomyces cerevisiae yeast.
1 Introduction
Single-cell impedance cytometry is a non-invasive method for characterizing the dielectric properties of individual cells and particles.1,2 A microfluidic impedance chip typically consists of a microchannel equipped with microelectrodes and filled with a conductive buffer. An AC voltage is applied to a pair of electrodes, which causes a current to flow between them. The current change upon passage of a cell between the electrodes is measured and then analyzed to determine the cell dielectric properties. Multifrequency impedance measurements can give multiparametric, high-content data that can be used to distinguish cell types. In particular, at low frequency (below 1 MHz), the signal amplitude reveals the cell size, like in a Coulter volume measurement, while higher frequencies can be used to obtain information on the cell membrane, cytoplasm and subcellular components.3,4 Recent work has demonstrated the application of microfluidic impedance cytometry to analyze plant cells,5 microorganisms,6–8 erythrocytes,9,10 leukocytes,11,12 platelets,13,14 and animal and human cell lines.15–18Two main electrode configuration designs have been proposed in the literature: either channels with single-sided (coplanar) electrodes embedded on one side of the channel, or channels with electrodes embedded in facing sides (parallel electrodes). Whereas fabricating front facing electrodes requires advanced fabrication equipment and may pose alignment issues, coplanar electrodes can be easily patterned at very small dimensions yielding miniaturized, reproducible, and ultimately low cost devices.19–21
In both designs, one main source of measurement inaccuracy is the dependence of the recorded signal on particle position within the interrogation volume.22,23 In fact, due to a non-homogeneous electric field distribution, nominally identical particles flowing through different trajectories in the channel experience different electric field strength and generate a different signal.1 This manifests itself as an error in the estimated particle size.
One approach to cope with the positional dependence of the measured traces is particle focusing. Microfluidic systems for particle positioning, which use microscale hydrodynamic effects like sheath flow24 or inertial focusing,25–27 have been developed. However, sheath flow increases the complexity of the system and consumes additional fluid, while inertial focusing requires high flow rates and is dependent on particle size. Alternatively, focusing systems relying on an external force field like dielectrophoresis7,28,29 (DEP) and acoustophoresis,20 or hybrid approaches like dielectric focusing30 and DEP-inertial microfluidics,31 can be used. Generally, the magnitude of the force on a particle (hence the focused position) depends on the physical properties of the particle, and system optimizations can be difficult in the case of heterogeneous samples. Moreover, active systems may have limited throughput because particles must be exposed to the outer force field for sufficient duration to achieve effective functionality.31
When looking for simple and portable assays, accurate microfluidic impedance cytometers not requiring focusing systems are desirable. In a recent work,32 we have introduced a focusing-free approach for the parallel electrode configuration. That method uses multiple pairs of facing electrodes to measure the transit time of particles through the device using two simultaneous current measurements having different spatial orientations (i.e. transverse to channel axis and oblique). By comparing the transit times relevant to transverse and oblique signals, an estimate of the vertical position of the particle is obtained, that is used to effectively compensate for the non-uniform electric field in the channel. That approach hinges on the availability of parallel-facing electrodes and cannot be straightforwardly extended to a coplanar layout. On the other hand, the latter is even more sensitive to positional dependence,33 and its usefulness has been limited by the uncertainty in the determination of particle volume.34
In this paper, we present an original five-electrode coplanar layout providing accurate particle sizing without the need for focusing. Multi-electrode impedance sensors provide multiple peaks and unique signatures for single cells and particles, and have been exploited e.g. to increase the signal-to-noise ratio35 or maximize the throughput via multiplexing.36 Our chip layout is designed so that the signal trace is a fingerprint from which a new metric encoding for particle trajectory height is obtained. This metric is used to effectively compensate for the non-uniform electric field in the channel, thus eliminating the positional dependence issue.
2 Operating principle
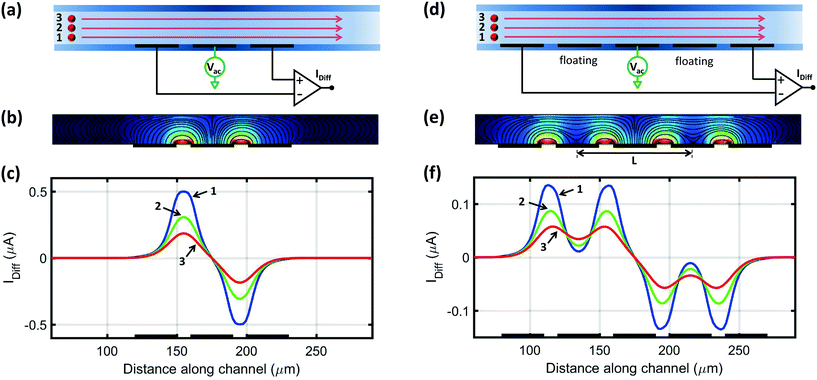
Fig. 1(a) shows the typical three-electrode coplanar layout. The channel is filled with a conductive fluid, an AC voltage is applied to the central electrode, and the differential current flowing through the lateral electrodes is collected and demodulated. The passage of a particle through the sensing region is recorded as a pair of opposite peaks.37 Peak amplitude is a measure of particle volume1 and peak locations correspond to regions of higher electric field strength (approximately half-way between the central electrode and each lateral electrode, Fig. 1(b)). However, the electric field strength decreases away from the electrodes in the vertical direction, and, therefore, identical particles traveling close to the electrodes (curve 1), through the middle of the channel (curve 2), or close to the top of the channel (curve 3), respectively, yield higher, intermediate, or lower peak amplitudes (Fig. 1(c)§).In order to cope with this positional dependence, rather than striving to create a homogeneous electric field across the sensing region, we propose to modulate the electric field distribution in such a way that the shape of the measured signal encodes information on particle trajectory height. To this aim, a new coplanar layout is here proposed (Fig. 1(d)), that introduces floating electrodes between the central electrode and the lateral current collecting ones. In this way, intermediate weak-field regions are generated in front of the floating electrodes (Fig. 1(e)), which in turn are reflected as local minima in the collected current (Fig. 1(f)). Therefore, the resulting signal traces exhibit a bipolar double-Gaussian profile well captured by the following fitting template (Fig. 2):
| s(t) = a[g(t − tc + δ/2) − g(t − tc − δ/2)], | (1) |
| g(t) = e−(t−γ/2)2/(2σ2) + e−(t+γ/2)2/(2σ2). | (2) |
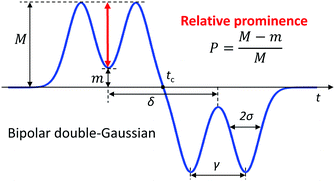 | ||
| Fig. 2 Bipolar double-Gaussian template used as an event fitting function. The definition of relative prominence P is also shown. | ||
The transit time δ can be used to estimate particle velocity v:40
| v = L/δ, | (3) |
| D = Ga1/3, | (4) |
As shown by the simulated traces in Fig. 1(f), the prominence of the two peaks with respect to the saddle in between is higher for particles traveling close to the electrodes (curve 1) than for particles traveling away from the electrodes (curve 3). Because signal amplitude also depends on particle size, the following normalized metric, referred to as relative prominence, is introduced (Fig. 2):
 | (5) |
 | (6) |
| P = 1 − 2e−γ2/(8σ2), | (7) |
Finite element simulations show that the relative prominence P correlates with the height of the particle trajectory (Fig. S1(b)†): the higher the former, the lower the latter. This claim has been experimentally supported by means of a quantitative defocusing approach41 (Fig. S2 and S3†). As a consequence, the relative prominence P can be used to correct the electrical particle diameter (Fig. S1(c)†), as demonstrated in section 4.
3 Experimental
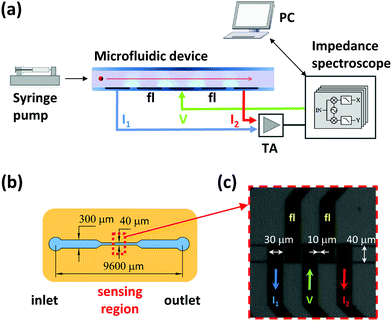
The experimental setup is shown in Fig. 3(a). The microfluidic impedance chip consists of a PDMS (polydimethylsiloxane) fluidic top layer and patterned microelectrodes in a coplanar configuration on glass (Fig. S4(a)†). In the sensing region, the microchannel cross-sectional area is 40 μm (w) × 21 μm (h) (Fig. 3(b)). The Ti/Au electrodes (20 nm/200 nm) were deposited on a glass substrate (75 × 25 × 1 mm) using optical lithography, e-beam evaporation and lift-off procedures. The sensing electrode width is 30 μm, and the spacing between them is 10 μm (Fig. 3(c)). The PDMS (10![[thin space (1/6-em)]](https://www.rsc.org/images/entities/char_2009.gif) :
:![[thin space (1/6-em)]](https://www.rsc.org/images/entities/char_2009.gif) 1 v/v, Sylgard 184, Dow Corning) microchannels were replica molded from photolithographically patterned SU-8 2025 (MicroChem) molds. The PDMS and glass were both activated by O2 plasma treatment (power: 20 W, flux: 60 sccm, pressure: 700 mtorr, time: 30 seconds, Oxford PlasmaLab RIE system) before alignment and irreversible bonding. For fluidic access, a Teflon tube (OD: 1/16′′) was inserted into the chip inlet and connected to a syringe pump (Elite 11, Harvard Apparatus), whereas electrical connections were made to the chips using pogo-pins within a custom chip holder (Fig. S4(b)†).
1 v/v, Sylgard 184, Dow Corning) microchannels were replica molded from photolithographically patterned SU-8 2025 (MicroChem) molds. The PDMS and glass were both activated by O2 plasma treatment (power: 20 W, flux: 60 sccm, pressure: 700 mtorr, time: 30 seconds, Oxford PlasmaLab RIE system) before alignment and irreversible bonding. For fluidic access, a Teflon tube (OD: 1/16′′) was inserted into the chip inlet and connected to a syringe pump (Elite 11, Harvard Apparatus), whereas electrical connections were made to the chips using pogo-pins within a custom chip holder (Fig. S4(b)†).
Model particle samples consisted of polystyrene beads with diameters of 5.2, 6 and 7 μm (Sigma-Aldrich and Polysciences). The beads were resuspended to a concentration of approximately 103 beads per μl in PBS containing 0.1% Tween 20 and enough sucrose to match the density of the suspending medium to the density of the particles (1050 kg m−3). The conductivity of the final medium was verified to be 1.1 S m−1 using a Cond7 conductivity meter combined with a conductivity cell 2301T (XS Instruments).
In order to show the potential impact of the proposed methodology on life sciences applications, baker's yeast (Saccharomyces cerevisiae) was also considered, which is one of the most popular model organisms for basic biological research.42 Yeasts were obtained from a local grocery store and diluted in a PBS buffer spiked with 6 μm beads and containing sufficient sucrose to achieve neutral buoyancy. The number of dead cells was found negligible (<1%) in a standard Trypan Blue exclusion test. Budding cells were also rare, and non-budding cells exhibited a roughly spherical shape by visual inspection. The addition of 0.1% bovine serum albumin (BSA) prevents the adhesion of cells on the microchannel walls. The final medium conductivity was 0.8 S m−1.
Samples were pumped through the device at a flow rate of 10 μl min−1. Impedance was measured using a Zurich Instruments transimpedance amplifier (HF2TA, 10 kΩ gain) and impedance scope (HF2IS, 20 kHz filter bandwidth). An excitation signal of 4 V was applied to the central electrode and the differential current collected by the lateral electrodes was sampled at 115 ksps. A stimulation frequency of 1 MHz was used for the bead suspension,32 whereas yeast measurements were performed at 0.5 MHz.4,7,8,43 Event detection in the data stream was performed with an algorithm reported previously,44 and a simple Matlab script was used for event fitting and feature extraction. With the present flow rate and sample concentration, a theoretical throughput of 166 events per second was computed. A throughput of about 140 events per second was measured, because the segmentation algorithm rejects coincidences. The data from this paper is available in the ESI.†
4 Results
4.1 Experiments with beads
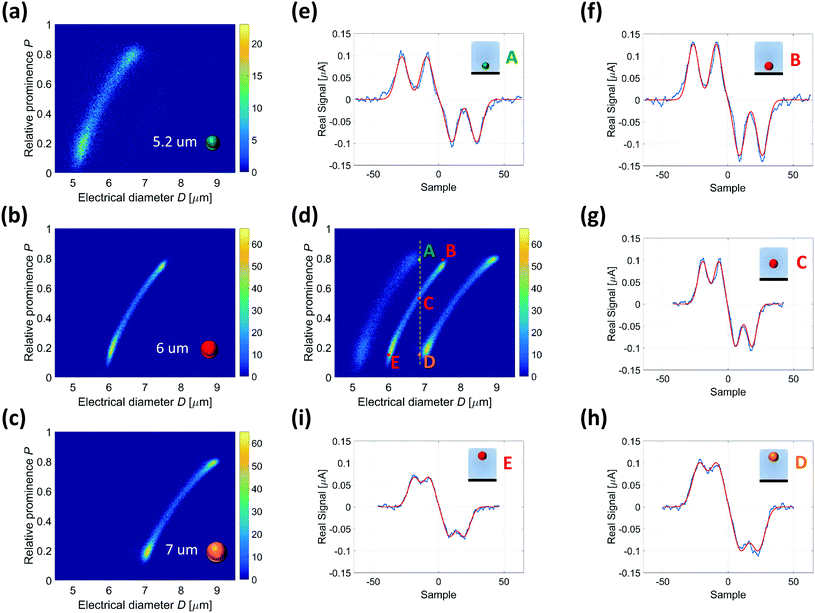
Fig. 4(a)–(c) respectively show the density plots for 5.2, 6 and 7 μm diameter beads, separately pumped into the device, with the relative prominence P (eqn (7)) plotted against the electrical diameter D (eqn (4)). Parameters a, σ and γ in eqn (4) and (7) have been obtained by fitting the bipolar double-Gaussian template (eqn (1)) to the experimental traces. The histogram of the root mean squared error of the fit, normalized by peak amplitude control a, is reported in Fig. S5.†The density plots in Fig. 4(a)–(c) are shown together in Fig. 4(d). Examples of experimental single-particle signals, labelled from A to E, are reported in Fig. 4(e)–(i), along with their fitting template. The 6 μm particles E, C and B, although having the same size, provide increasing values of electrical diameter D (6, 6.8 and 7.5, respectively). These particles are deemed to travel close to the top (particle E), in the middle (particle C), and close to the bottom (particle B) of the channel, as confirmed by the increasing value of the relative prominence of their recorded signals (0.15, 0.53 and 0.79, respectively). Particles A and D, respectively, of 5.2 and 7 μm diameter, provide the same electrical diameter as the centred 6 μm particle (C). Particle A is smaller than particle C, but its recorded signal has larger relative prominence (0.79), suggesting a trajectory closer to the electrodes. On the other hand, particle D is larger than particle C, but its recorded signal has smaller relative prominence (0.15), in favour of a path further away from the electrodes.
Fig. 5 (cf. Fig. S1(c)†) shows the density plots of the relative prominence P against the electrical diameter D normalized by the nominal bead diameter d, for the three populations of beads. Because the measured signal is proportional to particle volume, these density plots overlap. The data in Fig. 5 can be fitted to a quadratic function:
| D/d = c1 + c2P + c3P2, | (8) |
 | (9) |
| d [μm] | c 1 | c 2 | c 3 |
|---|---|---|---|
| 5.2 | 0.98 | 0.13 | 0.30 |
| 6.0 | 0.98 | 0.13 | 0.30 |
| 7.0 | 0.98 | 0.11 | 0.32 |
| All | 0.98 | 0.13 | 0.30 |
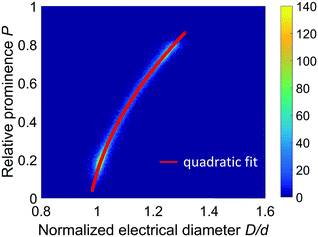 | ||
| Fig. 5 Density plot of the relative prominence P against the electrical diameter D normalized by the nominal bead diameter d. The density plots relevant to the three populations of beads separately measured are plotted together and overlap. The quadratic fit D/d = c1 + c2P + c3P2 is shown as a red line (fit parameters reported in Table 1, last row). | ||
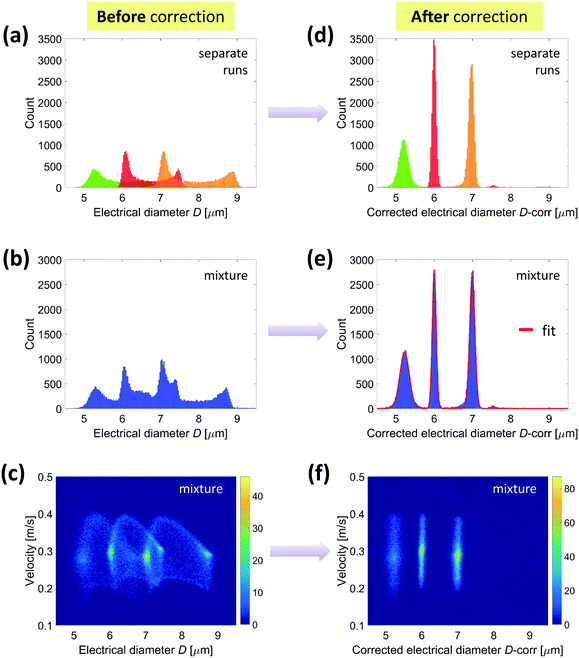
Fig. 6(a) and (b) show the histograms of the electrical diameters of individual particle populations and a mixed sample comprising equal concentrations of each population, respectively. As expected,20 the distribution has a significant spread and asymmetry. According to eqn (9), the following compensation procedure was implemented:
 | (10) |
In order to show the effectiveness of the proposed method also for smaller or larger particles, additional experimental results relevant to a mixture of 3, 6 and 10.1 μm diameter beads have been reported in Fig. S6.†
In addition, the density plots in Fig. 4, 6 and S6† show spots of higher particle density that suggest a certain degree of inertial focusing: the larger the bead size, the more pronounced the focusing.25
4.2 Experiments with yeasts
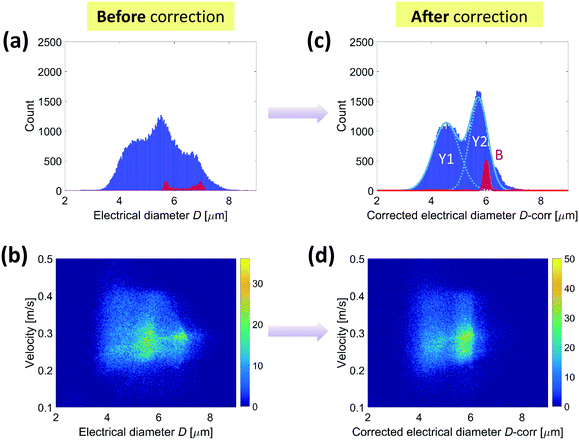
The yeast preparation spiked with 6 μm diameter beads, described in section 3, was then analyzed. Fig. 7 shows the density plot of the relative prominence P against the electrical diameter D. In such a two-dimensional plot, apart from the 6 μm diameter beads (used as an internal reference and identified by means of opacity),46 two yeast populations can be clearly distinguished. On the other hand, their presence is not evident from the histogram of the electrical diameter D only (Fig. 8(a)), unless the compensation procedure in eqn (10) is applied. Indeed, Fig. 8(c) shows that each yeast population has a Gaussian size distribution (4.5 ± 0.5 μm and 5.7 ± 0.3 μm). These findings are compatible with those commonly reported in the literature.47 Density plots of particle velocity versus electrical diameter are reported in Fig. 8(b) and (d) for raw and corrected data, respectively.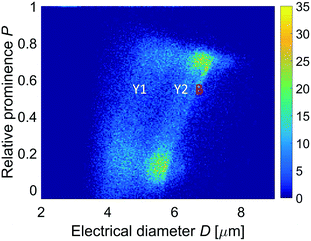 | ||
| Fig. 7 Yeast sample (spiked with 6 μm diameter beads). Density plot of the relative prominence P against the electrical diameter D (Y1 and Y2, yeast populations; B, beads). | ||
5 Conclusions
Combining an original chip layout with a simple compensation strategy, we have achieved coplanar-electrode accurate impedance-based particle sizing without the need for focusing. The proposed layout involves floating electrodes producing weak-field regions, which are reflected as local minima in the collected current. The peculiar shape of the measured signal yields a new metric, named relative prominence, encoding for particle trajectory height. This metric is used to correct the measured electrical diameter, providing excellent coefficient of variation in the estimated size of polystyrene beads. The application of the proposed method to S. cerevisiae shows its potential for high quality data collection in life sciences.Cell analysis is of central significance to research and clinical diagnostics. In particular, cell size is an important factor involved in many biological processes such as cell growth, cell cycles, and cell death. The microfluidic cytometer here presented is easy to fabricate and requires a small sample volume and no additional fluids or methods for particle focusing, thus favouring miniaturized, low-cost and portable implementation. Besides accurate cell sizing, the device allows cell counting and velocity evaluation. Moreover, multifrequency measurements can be used to obtain information on the cell membrane and cytoplasm, which are related e.g. to cell viability. The ensemble of these features make the device attractive for applications in point-of-care diagnostics and basic research studies.
Acknowledgements
The research leading to this work was supported by the Scientific Independence of Young Researchers Programme (SIR 2014) under Grant RBSI14TX20-MUSIC “Multidimensional Single-Cell Microfluidic Impedance Cytometry”. The authors thank Dr. A. Gerardino and Dr. L. Simone for useful discussion.References
- T. Sun and H. Morgan, Microfluid. Nanofluid., 2010, 8, 423–443 CrossRef CAS.
- J. Chen, C. Xue, Y. Zhao, D. Chen, M. Wu and J. Wang, Int. J. Mol. Sci., 2015, 16, 9804–9830 CrossRef CAS PubMed.
- S. Gawad, K. Cheung, U. Seger, A. Bertsch and P. Renaud, Lab Chip, 2004, 4, 241–251 RSC.
- N. Haandbæk, S. C. Burgel, F. Heer and A. Hierlemann, Lab Chip, 2014, 14, 369–377 RSC.
- I. Heidmann, G. Schade-Kampmann, J. Lambalk, M. Ottiger and M. Di Berardino, PLoS One, 2016, 11, 1–15 Search PubMed.
- C. Bernabini, D. Holmes and H. Morgan, Lab Chip, 2011, 11, 407–412 RSC.
- M. Shaker, L. Colella, F. Caselli, P. Bisegna and P. Renaud, Lab Chip, 2014, 14, 2548–2555 RSC.
- N. Haandbæk, S. C. Bürgel, F. Rudolf, F. Heer and A. Hierlemann, ACS Sens., 2016, 1, 1020–1027 CrossRef.
- K. Cheung, S. Gawad and P. Renaud, Cytometry, Part A, 2005, 65A, 124–132 CrossRef CAS PubMed.
- C. Küttel, E. Nascimento, N. Demierre, T. Silva, T. Braschler, P. Renaud and A. G. Oliva, Acta Trop., 2007, 102, 63–68 CrossRef PubMed.
- D. Holmes, D. Pettigrew, C. H. Reccius, J. D. Gwyer, C. van Berkel, J. Holloway, D. E. Davies and H. Morgan, Lab Chip, 2009, 9, 2881–2889 RSC.
- E. Rollo, E. Tenaglia, R. Genolet, A. Harari and C. Guiducci, 20th International Conference on Miniaturized Systems for Chemistry and Life Sciences, MicroTAS, 2016 Search PubMed.
- C. van Berkel, J. D. Gwyer, S. Deane, N. Green, J. Holloway, V. Hollis and H. Morgan, Lab Chip, 2011, 11, 1249–1255 RSC.
- M. Evander, A. J. Ricco, J. Morser, G. T. A. Kovacs, L. L. K. Leung and L. Giovangrandi, Lab Chip, 2013, 13, 722–729 RSC.
- H. L. Gou, X. B. Zhang, N. Bao, J. J. Xu, X. H. Xia, H. Y. Chen and J. Chromatogr, A, 2011, 1218, 5725–5729 CAS.
- J.-L. Hong, K.-C. Lan and L.-S. Jang, Sens. Actuators, B, 2012, 173, 927–934 CrossRef CAS.
- H. Song, Y. Wang, J. M. Rosano, B. Prabhakarpandian, C. Garson, K. Pant and E. Lai, Lab Chip, 2013, 13, 2300–2310 RSC.
- B. de Wagenaar, S. Dekker, H. L. de Boer, J. G. Bomer, W. Olthuis, A. van den Berg and L. I. Segerink, Lab Chip, 2016, 16, 1514–1522 RSC.
- J. Hong, D. S. Yoon, S. K. Kim, T. S. Kim, S. Kim, E. Y. Pak and K. No, Lab Chip, 2005, 5, 270–279 RSC.
- C. Grenvall, C. Antfolk, C. Bisgaard and T. Laurell, Lab Chip, 2014, 14, 4629–4637 RSC.
- C. H. Clausen, G. E. Skands, C. V. Bertelsen and W. E. Svendsen, Micromachines, 2015, 6, 110–120 CrossRef.
- K. C. Cheung, M. Di Berardino, G. Schade-Kampmann, M. Hebeisen, A. Pierzchalski, J. Bocsi, A. Mittag and A. Tárnok, Cytometry, Part A, 2010, 77, 648–666 CrossRef PubMed.
- D. Spencer and H. Morgan, Lab Chip, 2011, 11, 1234–1239 RSC.
- X. Mao, A. Nawaz, S. Lin, M. Lapsley, Y. Zhao, J. McCoy, W. El-Deiry and T. Huang, Biomicrofluidics, 2012, 6, 024113 CrossRef PubMed.
- D. Di Carlo, Lab Chip, 2009, 9, 3038–3046 RSC.
- S. Hur, H. Tse and D. Di Carlo, Lab Chip, 2010, 10, 274–280 RSC.
- R. Pugo, S. Deane, C. Glasse, M. Burcher, H. Morgan and C. Reccius, 14th International Conference on Miniaturized Systems for Chemistry and Life Sciences, MicroTAS, 2010 Search PubMed.
- D. Holmes, H. Morgan and N. Green, Biosens. Bioelectron., 2006, 21, 1621–1630 CrossRef CAS PubMed.
- N. Haandbæk, O. With, S. C. Bürgel, F. Heer and A. Hierlemann, Lab Chip, 2014, 14, 3313–3324 RSC.
- M. Evander, B. Dura, A. Ricco, G. Kovacs and L. Giovangrandi, 14th International Conference on Miniaturized Systems for Chemistry and Life Sciences, MicroTAS, 2010 Search PubMed.
- J. Zhang, S. Yan, G. Alici, N. Nguyen, D. Di Carlo and W. Li, RSC Adv., 2014, 4, 62076–62085 RSC.
- D. Spencer, F. Caselli, P. Bisegna and H. Morgan, Lab Chip, 2016, 16, 2467–2473 RSC.
- T. Sun, N. G. Green, S. Gawad and H. Morgan, IET Nanobiotechnol., 2007, 1, 69–79 CrossRef CAS PubMed.
- J. Riordon, N. M. Catafard and M. Godin, Appl. Phys. Lett., 2012, 101, 154105 CrossRef.
- P. Xie, X. Cao, Z. Lin, N. Talukder, S. Emaminejad and M. Javanmard, Sens. Actuators, B, 2017, 241, 672–680 CrossRef CAS.
- R. Liu, N. Wang, F. Kamili and A. F. Sarioglu, Lab Chip, 2016, 16, 1350–1357 RSC.
- T. Sun, C. van Berkel, N. G. Green and H. Morgan, Microfluid. Nanofluid., 2009, 6, 179–187 CrossRef CAS.
- F. Caselli, P. Bisegna and F. Maceri, J. Microelectromech. Syst., 2010, 19, 1029–1040 CrossRef.
- F. Caselli, M. Shaker, L. Colella, P. Renaud and P. Bisegna, J. Microelectromech. Syst., 2014, 23, 785–794 CrossRef.
- S. Gawad, L. Schild and P. Renaud, Lab Chip, 2001, 1, 76–82 RSC.
- M. Wu, J. W. Roberts and M. Buckley, Exp. Fluids, 2005, 38, 461–465 CrossRef.
- S. Ostergaard, L. Olsson and J. Nielsen, Microbiol. Mol. Biol. Rev., 2000, 64, 34–50 CrossRef CAS PubMed.
- G. Schade-Kampmann, A. Huwiler, M. Hebeisen, T. Hessler and M. Di Berardino, Cell Proliferation, 2008, 41, 830–840 CrossRef CAS PubMed.
- F. Caselli and P. Bisegna, IEEE Trans. Biomed. Eng., 2016, 63, 415–422 CrossRef PubMed.
- G. Mernier, E. Duqi and P. Renaud, Lab Chip, 2012, 12, 4344–4349 RSC.
- R. A. Hoffman, T. S. Johnson and W. B. Britt, Cytometry, 1981, 1, 377–384 CrossRef CAS PubMed.
- F. Sherman, in Guide to Yeast Genetics and Molecular Biology, ed. C. Guthrie and G. R. Fink, Academic Press, 1991, vol. 194, pp. 3–21 Search PubMed.
Footnotes |
| † Electronic supplementary information (ESI) available. See DOI: 10.1039/c6lc01516f |
| ‡ These authors contributed equally to this work. |
| § Finite element simulation results. Details of the finite element model can be found e.g. in ref. 38 and 39. |
| ¶ The 6 μm diameter beads from Polysciences have a much higher reported CV than the 5.2 μm and 7 μm obtained from Sigma Aldrich. That value is probably a conservative estimate. |
| This journal is © The Royal Society of Chemistry 2017 |

