
 Open Access Article
 This Open Access Article is licensed under a
 Creative Commons Attribution 3.0 Unported Licence
Potential of the hydride generation technique coupled to inductively coupled plasma optical emission spectrometry for non-chromatographic As speciation
Maja
Welna
 * and
Pawel
Pohl
* and
Pawel
Pohl
Wroclaw University of Technology, Faculty of Chemistry, Division of Analytical Chemistry and Chemical Metallurgy, Wybrzeze Wyspianskiego 27, 50-370 Wroclaw, Poland. E-mail: maja.welnal@pwr.edu.pl
First published on 12th June 2017
Abstract
A systematic study of hydride generation (HG) in the sample introduction step combined with inductively coupled plasma optical emission spectrometry (ICP OES) for non-chromatographic As speciation from solutions of As(III), As(V), dimethylarsinate (DMA) and monomethylarsonate (MMA) is presented. Hydrides were generated in the reaction with NaBH4 in the acidic medium using a continuous flow system with a gas–liquid phase separation directly coupled with ICP. Optimization of the HG operational parameters was performed to improve the detectability of As. The different reactivities of the examined As species under various reaction conditions [in terms of the type and concentration of acids (HCl, acetic and citric), buffers (acetate and citrate), the NaBH4 concentration and presence of pre-reducing agents (KI-ascorbic acid, thiourea-ascorbic acid and L-cysteine)] were used for selective generation of their individual hydrides. The relationship among As(III), As(V), DMA and MMA signals under different reduction conditions was studied and discussed. Considering all favorable pre-reducing and HG reaction conditions, five speciation procedures (SPs) for species-selective HG of As in one solution, including SP1 for [As(III)], SP2 for [As(III) + DMA], SP3 for [As(III) + As(V) + MMA], SP4 for [DMA + MMA] and SP5 for [As(III) + As(V) + DMA + MMA], were evaluated. Differentiation between As(III), As(V), DMA and MMA along with distinguishing between species having the same nature, i.e. i-As [As(III,V)] and o-As (DMA, MMA), was achieved. By combining the analytical responses obtained with HG-ICP OES, the experimental protocols for determination and non-chromatographic speciation (both individual and operational) of hydride-active As species were proposed.
1 Introduction
Arsenic may exist in various chemical forms, having different toxicities ranging from highly hazardous inorganic arsenicals (i-As), i.e. arsenite [As(III)] and arsenate [As(V)], to relatively harmless organic forms (o-As), i.e. monomethylarsonate (MMA) and dimethylarsinate (DMA). Other o-As compounds, e.g. arsenobetaine (AsB), are non-toxic to humans.1 Since the toxicity of As is species dependent, today, determination of the total As content is insufficient and speciation information is mandatory to reflect the risk associated with exposure to As.In the traditional approach, the most popular strategy for speciation of toxic As forms is based on their chromatographic separation and detection using spectrometric detectors, i.e. inductively coupled plasma mass spectrometry (ICP MS), ICP optical emission spectrometry (ICP OES), atomic absorption spectrometry (AAS) or atomic fluorescence spectrometry (AFS), however, HPLC-ICP MS is favored due to the low detection limits (DLs) of the As species and their high selectivity.e.g.2–4 Otherwise, the current interest in speciation analysis of As goes into development of robust and reliable non-chromatographic methods. These methods are based on the selective solvent extraction of i-As followed by its direct measurement using spectrometric techniques, including ICP-MS,5,6 graphite-furnace (GF) AAS,7,8 and electrospray ion-trap MS.9 They also include extraction of all As species followed by separation of i-As from o-As using different chemical methods and detection with AFS, AAS or ICP MS.10–14 Commonly, a separation step involves anion-exchange (AE) solid-phase extraction (SPE),10–12 enabling selective retention of i-As or by derivatization through hydride generation (HG) under specific reductive conditions.13,14
Among the aforementioned methods, HG is one of the most straightforward approaches and the recommended way for determination of trace amounts of the total As concentrations.15 It is applied in hyphenation with atomic spectroscopy to the elements that form volatile species in the reaction with sodium tetrahydroborate (NaBH4) in acidic media (usually HCl).16 Application of HG in the sample introduction step can satisfy the selectivity and detectability requirements to a large extent.15,17,18 Satisfactorily, all major toxic As compounds, i.e. i-As [As(III,V)] and o-As (DMA, MMA), are hydride-active and react with NaBH4, forming the corresponding hydrides, i.e. AsH3, (CH3)2AsH and CH3AsH2 for As(III,V), DMA and MMA, respectively.19,20 Unfortunately, the effectiveness of the HG processes of these individual As forms depends on the experimental conditions used and largely differs. Generally, different As species do not generate hydrides with similar efficiency, hence determination of total As (t-As) by HG in all these species can be problematic.20 A pre-reduction step is usually carried out as HG is sensitive only when the As species are present in their lower oxidation states. However, when As(III) and As(V) species similarly respond under appropriately selected reaction conditions, previous pre-treatment before HG can be avoided.21–23
On the other hand, by using species-selective HG, speciation of As is possible. Non-chromatographic approaches to differentiation of the four As species, being the direct benefit of HG, are less time-consuming, simpler and more cost-effective alternatives to speciation of As carried out by HPLC.13,24,25 Selectivity is based on (1) differences in the reaction rate of the As species with NaBH4 in the HCl medium, (2) the acidity-dependent reduction reaction between the As species and NaBH4, critically affected by the type and concentration of acid or buffer used as well as pH of the reacting medium and (3) absence or presence of additives, including pre-reductants or chelating/masking reagents. Accordingly, the individual hydrides can be generated either selectively under different chemical conditions or together with other species in various reaction media. As a result, based on the different responses of the four As species resulting from HG, experimental protocols for As speciation are proposed.26–32
There is no doubt that the procedures of speciation of all four As forms by means of HG are the most desired but also the most demanding and challenging because their development has to be proceeded by careful optimization of the experimental parameters, being appropriate for each As species present in the sample solution. Hence, most of the studies dealing with non-chromatographic As speciation by HG focus on i-As, and concern discrimination between As(III) and As(V) only.21–23,33–42 In contrast, the role of o-As is rather diminished. Contribution of o-As to the quantified concentration of i-As or As(III) can only be assessed by evaluating the interferences of DMA and MMA on the As signal under the selected HG reaction conditions.13,14,38,41 Importantly, results show that the presence of DMA and MMA may influence the analytical response of As, therefore, the developed method, although accurate for i-As, can be applied to the samples with no or negligible amounts of the methylated As forms.13,38,41 It must be commented that even though i-As is the dominant As species in most samples, other As species present in them cannot be ignored and the behavior of all hydride-active As species during HG should be verified to obtain reliable results.14 Optionally, to overcome the interfering effect of DMA and MMA on the determination of i-As, SPE with specific sorbents, i.e. silica-based, strong anion-exchange (SAX) cartridges,10–12 can be used to separate i-As from o-As before HG.
Determination and speciation of As by HG from the sample solutions containing various inorganic and organic species of this element is not an easy task because several factors affecting HG efficiency have to be carefully controlled and taken into account to improve the accuracy of the analysis. In reference to this, the objective of this work was to investigate the analytical proceeding for As speciation by a non-chromatographic approach based on HG and differentiation of certain toxicologically relevant As species, i.e. As(III), As(V), DMA and MMA. Different reactivities of the As species under various reaction conditions were used for selective generation of the individual hydrides and evaluation of the relationships among the As signals. Possibilities of erroneous interpretations of the results are also pointed out. Analytical procedures for species-selective discrimination and determination of As(III), As(V), DMA and MMA were optimized, based on the different responses of the As species toward HG. Both speciation and fractionation schemes along with the procedures for total As determination are proposed. It is worth noting that such non-chromatographic As analysis and speciation by HG-ICP OES, as far as we know, has not been presented yet.
2 Experimental
2.1 Reagents and solutions
All chemicals were of analytical grade. Stock standard solutions of As(III), DMA and MMA (1000 μg mL−1) were obtained from their respective salts, i.e. sodium metaarsenite (NaAsO2), sodium cacodylate (C2H6AsNaO2 × 3H2O) and disodium methyl arsenate (CH3AsNa2O3), all of them from Sigma-Aldrich (St Louis, MO, USA). These As species stock solutions were prepared on a mass basis and then stored at 4 °C without adding any preservatives. In the case of As(V), a Merck (1000 μg mL−1) ICP standard solution (Merck, Darmstadt, KGaA, Germany) was used. Single and mixed working solutions were obtained by serial dilutions of the stock standards with water. Synthetic sample solutions of the As species were freshly prepared and analyzed in all the experiments. Single standard solutions (20 ng g−1 as As) for each As species, made either in water only, acidified with different acid media or prepared in the presence of various pre-reducing agents, were investigated.To acidify the sample solutions and/or to use the additional acid solutions in the HG reaction, 37% (m/v) HCl (Sigma-Aldrich) and 80% (m/v) CH3COOH solutions (Avantor Performance Reagents, Gliwice, Poland) and a 2 mol L−1 citric acid solution, made by dissolution of solid C6H8O7 × H2O powder (Avantor Performance Reagents), were applied. Depending on the HG reaction conditions, the sample solutions were acidified to 3 mol L−1 with HCl, while 0.01 to 10 mol L−1 (HCl), 0.01 to 4 mol L−1 (CH3COOH) and 0.01 to 2 mol L−1 (C6H8O7) solutions of acids were additionally employed for the HG reaction.
Solutions of CH3COOH and C6H8O7 at adjusted pH (buffers) were prepared and used as diluents of the sample solutions to test the effect of pH on HG for the different As forms. For this purpose, 0.2, 0.5 and 1.0 mol L−1 acetic acid/sodium acetate buffers (pH = 4.5) were prepared by mixing appropriate aliquots of CH3COOH and CH3COONa solutions, while 0.1 mol L−1 citric acid/sodium citrate buffer (pH = 5.2) was prepared from C6H8O7 and C6H5Na3O7 solutions. pH was measured with a pH meter (type CP-401, Elmetron, Poland) with a glass electrode at 25 °C.
L(+)-Ascorbic acid (AA, Avantor Performance Reagents), L-cysteine (LC, Sigma-Aldrich), KI (Avantor Performance Reagents) and thiourea (TU, Sigma-Aldrich) were used as the pre-reducing agents. Their single solutions, i.e. 4.0 or 10% (m/v) AA, LC, KI and TU, in addition to the mixed solutions, i.e. KI (2.0%)–AA (8.0%) and TU (4.0%)–AA (4.0%), were prepared by dissolving the respective solid reagents in water. In the case of pre-reduction with AA, KI and TU, the sample solutions were treated with KI and TU (individually) or with their mixtures with AA before final acidification to the optimum HCl concentration, i.e. 3 mol L−1. In contrast, the sample solutions treated with LC were not acidified at all, i.e. they were prepared only in pure water.
A 1.0% (m/v) NaBH4 (Sigma-Aldrich) solution was used for the HG reaction. It was prepared daily by dissolving an appropriate amount of powdered NaBH4 in a 0.1% (m/v) NaOH (Sigma-Aldrich) solution for stabilization, and filtered (0.45 μm) before being used to eliminate turbidity. For investigation of the effect of the NaBH4 concentration on the As response, solutions of NaBH4 at the concentration ranging from 0.01 to 1.0% were made. Importantly, the NaOH concentration [in % (m/v)] used to stabilize NaBH4 was always kept 10 times less than the concentration of the reductant.
De-ionized water (18.3 MΩ·cm) from an EASYpure system (Barnstead, Model D7033) was used in all the experiments.
2.2 Sample pre-treatment with pre-reducing agents (pre-reduction of As species)
For pre-reduction with KI alone or its mixture with AA (KI–AA) as well as TU alone or its mixture with AA (TU–AA), appropriate aliquots of the concentrated pre-reducing agent solutions were placed in PP capped containers, into which appropriate aliquots of the As(V), DMA or MMA working standard solutions were added. Final concentrations of the pre-reducing agents were: 0.5% (KI) and 1.0% (TU) (individually) or 0.5–2.0% and 1.0–1.0% (mixtures of KI and TU with AA, respectively). These solutions were mixed, completed with a 4 mol L−1 HCl solution to ensure required acidity (3 mol L−1), and finally left to react before the measurements by HG-ICP OES. For combination of KI–AA and TU–AA, the influence of the pre-reducing agents added individually before acidification, i.e. at first AA and then KI or TU (AA + KI or AA + TU), or already mixed (KI–AA or TU–AA) on the performance of the pre-reduction reaction of the different As species was checked. In the procedure with LC, to the appropriate aliquot of this concentrated pre-reducing agent solution, appropriate aliquots of the As(V), DMA or MMA single standard solutions were added and completed with water to reach the final LC concentration in the resulting solutions equal to 0.5%, and left to react prior to analysis. All these experiments were performed at room temperature and a contact time of 30 min was sufficient for pre-reduction of all the As species. To properly assess the effects of the pre-reducing agents on HG of As and obtain reliable As responses, the As(III) standard solution was also treated with all the studied pre-reducing agents used for pre-reduction. The respective blank sample solutions were always prepared in the same way as the standard solutions and considered in the final results.2.3 Arsenic hydride generation and measurements
The corresponding arsenic hydrides (arsines) from the four As species were generated using a continuous flow system with gas–liquid phase separation directly combined with the ICP OES spectrometer. The system consisted of a modified cyclonic spray chamber (that acts only as a phase separator), a parallel Burgener-type pneumatic nebulizer, Y-shaped (Y) connectors, a reaction coil and peristaltic pumps with delivery tubes.43In the manifold used, reagents, i.e. sample (S), additional acid (A) and NaBH4 (R) solutions, were simultaneously pumped in separate streams using two peristaltic pumps. Two combinations were used, i.e. with three (1) and two (2) streams of the reagents. In the (1) approach, the S and A solutions were merged in the first Y connector, then the resulting acidified sample solution was delivered to the second Y connector, where it was mixed with the incoming R solution. The resulting heterogeneous reaction mixture was introduced through the reaction coil (PTFE tubing 5 cm × 0.5 mm i.d.) to a special cavity at the bottom of the chamber (i.e. the U-shaped end part of the chamber) to separate the volatile species from the liquid phase. Arsines and other gaseous co-products were swept by a carrier Ar stream, introduced through the gas inlet of the nebulizer mounted onto the cyclonic spray chamber, and immediately transported to the plasma torch. The sample inlet of the nebulizer was clogged. The post-reaction waste solution was drained from the chamber with the aid of the third peristaltic pump. Employing the (2) combination, a stream of the A solution was excluded, hence only one Y connector was necessary. In this manifold, the already acidified S solution and the R solution were mixed in the Y connector, followed by introduction of the resulting reaction mixture (through the reaction coil) to the U-type end part of the chamber.
All measurements were performed with the use of the Jobin Yvon (France) sequential optical emission, radially viewed Ar-ICP spectrometer, model JY 38S. The operating parameters for the HG reaction and ICP OES detection are listed in Table 1. A sequential mode to record the analytical line profiles was applied. The background corrected net intensities (Inet) of the analytical line of As (mean of three repeated measurements, n = 3) were used for the studies.
| a I: atomic line. b The concentration of the reagent in the final sample solution depending on the HG reaction and pre-reduction conditions used. | ||
|---|---|---|
| ICP OES spectrometer (detection) | ||
| Generator (MHz) | 40.68 | |
| RF power (W) | 1000 | |
| Injector i.d. (mm) | 2.5 | |
| Observation zone | Radial: 12 mm above the load coil | |
| Ar flow rate (L min−1) | Plasma: 13.0 | |
| Auxiliary: 0.2 | ||
| Nebulizer gas: 0.35 | ||
| Integration time (s) | 0.10 | |
| Measurement replicate | 3 | |
| Analytical line wavelengths (nm) | As Ia 193.7 | |
![[thin space (1/6-em)]](https://www.rsc.org/images/entities/char_2009.gif) |
||
| Continuous flow hydride generation (CF-HG) with gas–liquid phase separation | ||
| Solution flow rate (mL min−1) | Sample (S): 1.5 | |
| Additional acid (A): 1.0 | ||
| Reductant (R): 1.0 | ||
| Reagent concentrationsb | ||
| Reductant solution (R): NaBH4 [% (m/v)] | 0.1 or 1.0 (in 0.01 or 0.1% (m/v) NaOH) | |
| Sample solution (S): | Aqueous | |
| Acidic (sample acid concentration) | Not acidified | |
| 3 mol L−1 HCl | ||
| 0.2 mol L−1 CH3COOH | ||
| pH = 4.5 (acetic/acetate buffer) | ||
| pH = 5.2 (citric/citrate buffer) | ||
| Additional acid solution (A): | 2 or 10 HCl mol L−1 | |
| 0.5 mol L−1 CH3COOH | ||
| Pre-reduction: | 0.5% (KI)–2.0% (AA) | |
| 0.5% LC | ||
3 Results and discussion
To investigate the suitability of HG-ICP OES for As speciation, the signals (the background corrected net intensities of the As I emission line) acquired for the As(III), As(V), DMA and MMA single-species standard solutions were monitored under various HG reaction conditions related to the combined NaBH4–acid system. The effect of the oxidation state and the nature of the examined As species on the performance of their reaction with NaBH4 was scrupulously examined by generating the hydrides in the presence and absence of different pre-reducing agents. The optimized HG reaction and pre-reduction conditions, providing selective generation of the As hydrides from different As species by HG-ICP OES, were proposed.3.1 Optimization of the HG-ICP OES variables
Initial optimization studies were carried out to achieve the best performance of the HG-ICP OES system in terms of sensitivity and accuracy of the measurements of the As signals. The ICP instrumental parameters summarized in Table 1, e.g. the RF power and the Ar flow rates, were set according to the recommendations given by its manufacturer. The most sensitive As atomic emission line at 193.7 nm was selected for the study using conventional PN sample introduction. The criterion for its selection from among other As emission lines, i.e. 197.3 nm, 228.8 nm and 234.9 nm, was the maximum signal-to-background (SBR) ratio.In the case of the HG reaction, typical reductant-acid conditions, i.e. NaBH4 combined with HCl, were used. NaBH4 and HCl concentrations were kept at 1.0% (m/v) and 3 mol L−1, respectively.17 The S solution contained 20 ng g−1 of As(III) and was acidified with HCl. The corresponding As hydride (AsH3) was generated by merging the S and R solutions. Otherwise, the A solution with HCl was merged at first with the S solution, and the resulting acidified solution was next merged with the R solution. Acidity referring to 3 mol L−1 HCl in the S solution after mixing with the A solution was chosen to keep the constant HCl concentration available for the reaction with NaBH4, regardless of the manifold applied to AsH3 generation. Accordingly, two different HG reaction conditions were used, i.e. 0 (S)–6 (A) mol L−1 HCl or 3 (S)-3 (A) mol L−1 HCl, while the NaBH4 concentration was the same (1.0%). Optimization was based on a one-factor-at-a-time (OFAT) approach, by changing one parameter, while keeping the others constant. It included: (1) the reagents, i.e. S, A and R solution flow rates (0.5–1.5 mL min−1); (2) the speed of the waste removal from the chamber (regulated by the speed of the peristaltic pump); (3) the reaction coil length (5–25 cm) as well as (4) the sample read delay time (DT), i.e. the time necessary to complete the HG reaction and obtain a consistent response for As before the measurement run (15–60 s). Briefly, it was found that the S and R solution flow rates were critical. Accordingly, the As response increased linearly with the increasing S solution flow rate. The highest signals were measured at 1.5 mL min−1 either for the acidified S or the S solution initially mixed with the A solution. Similarly, an increase in the R solution flow rate led to a constant growth in the As response; however, above 1.0 mL min−1, repeatability of the As signals became poorer (RSDs > 15%), probably due to larger H2 production that made the plasma unstable. In the case of the A solution, it was concluded that its flow rate of 1.0 mL min−1 was necessary to achieve the maximum and stable As signals. Importantly, at optimum flow rates of all the reagents, i.e. S (1.5 mL min−1), A (1.0 mL min−1) and R (1.0 mL min−1) solutions, the As signals, acquired using for the reaction the acidified S solution or the S solution mixed with the A solution, were very close to each other. Considering the reaction coil length, the best results were obtained when the coil was the shortest. An increase in its length resulted in lower precision of the measured As signals (RSDs > 10%). In addition, there was a higher risk of unsealing the system because of larger back-pressure. The DT necessary to achieve the steady As response was 30 s after merging the acidified S and R solutions in the Y connector. Finally, the stability of the HG reaction conditions was assured by effective drainage of the out-coming liquid from the chamber. It was achieved when the level of the post-reaction solution in the U-type end part of the chamber was kept at a constant level. The flow rate of the waste solution was regulated by the speed of the peristaltic pump.
In consequence, the chosen optimal operating parameters (see Table 1) enabled us to achieve the highest As signals and signal to background ratios and satisfactory repeatability of measurements with HG-ICP OES; the detection limit (3σ) of 0.23 ng g−1 for As(III) was estimated using the standard solutions within 0 to 50 ng g−1, while the relative standard deviation (% RSD) calculated for three repeated measurements of the background-corrected intensity of the As I emission line was better than 3%.
3.2 Arsine generation from various As species
Next, the chemical HG reaction conditions affecting the formation of the As hydrides from As(III), As(V), DMA and MMA were examined to obtain the highest As response for species-selective As detection by HG-ICP OES. | ||
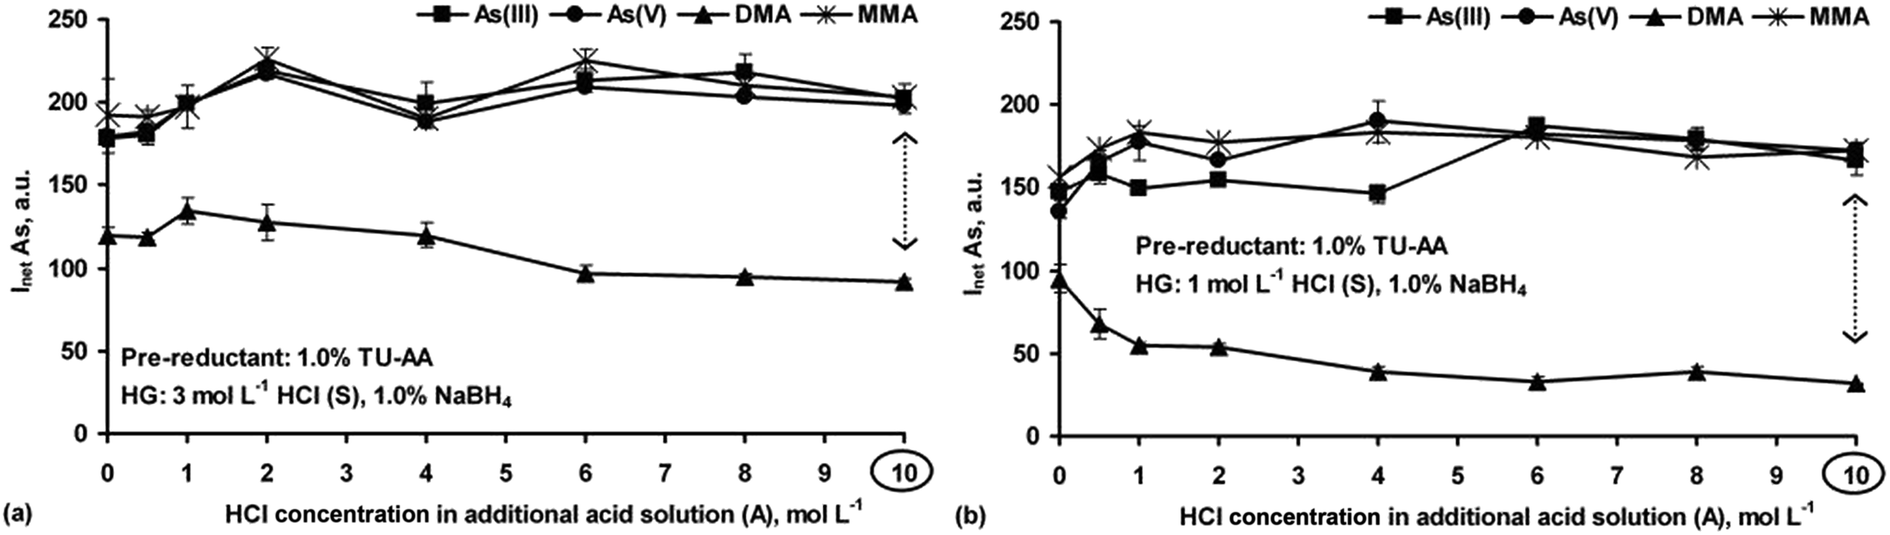
| Fig. 1 Effect of acidity related to the HCl concentration in the additional acid (A) solution on the responses of As(III), As(V), DMA and MMA during arsine generation using a 1.0% NaBH4 (R) solution. The simple S solutions of the As species (20 ng g−1 each) were used (acidification with HCl was omitted) (a) or they were acidified with HCl to 3 mol L−1 (b). | ||
 | ||
| Fig. 2 Effect of acidity related to the CH3COOH concentration in the S and A solutions on the measurements of As(III), As(V), DMA and MMA (20 ng g−1 each) by HG-ICP OES using the 1.0% NaBH4 R solution. Left side: CH3COOH was used for the HG reaction. Simple S solutions (not acidified with HCl) and the A solution containing CH3COOH at various concentrations were used. Right side: acetate buffer at adjusted pH was used for the HG reaction. The S solutions were acidified with the acetate buffer (pH 4.5), the use of the A solution was excluded. | ||
In the strong HCl media (Fig. 1a), all the As species were converted into their hydrides, but their responses depended on the HCl concentration. Maxima for DMA and MMA were reached at 0.25–0.5 mol L−1 HCl. Then, signals for DMA rapidly decreased to a negligible value in 10 mol L−1 HCl. The maximum As signal from MMA remained up to 4 mol L−1 HCl, with a slow decrease (up to 30%) in more concentrated HCl solutions. The higher HCl concentration was suitable for i-As species. Their signals gradually increased to achieve constant values at 2 [As(III)] and 6 [As(V)] mol L−1 HCl. The results indicated that at a fixed NaBH4 concentration (1.0%) and variable HCl concentrations identical As responses for the studied As species could not be obtained. Such behavior agrees with previous reports.20,26,27
The influence of HCl concentrations both in the S and A solutions on HG of the As species was also tested. A series of S solutions acidified with HCl at different concentrations (1–6 mol L−1) were used. The HCl concentration in the A solution changed within 0–10 mol L−1. Taking into account the HCl concentration ranges in the S and A solutions as well as their flow rates, the actual HCl concentration available for the HG reaction varied between 0.6 and 7.6 mol L−1. It was established that above 3 mol L−1 HCl in the S solution and independent of the HCl concentration in the A solution, the As responses coming from As(III), As(V) and MMA were improved, i.e. reached maxima that were close to those obtained when the S solutions not acidified with HCl were used. At higher HCl concentrations, i.e. >3 mol L−1 (S) and >8 mol L−1 (A), DMA gave no response. A decrease in the signal for DMA under strong acidic HG reaction conditions was reported by other researchers.13,14,20,26,27,29 Nevertheless, such a gradual decrease of the signal for MMA was also observed in previous studies.13,14,20,29 These HG reaction conditions, although not applicable for DMA, could be however attractive in non-chromatographic As speciation. The response profiles obtained for all four As species using the S solutions prepared in 3 mol L−1 HCl are demonstrated in Fig. 1b.
Efficient generation of As hydrides in the reaction with CH3COOH (Fig. 2) could be observed for As(III), DMA and MMA. The responses for As(V) in the entire studied CH3COOH concentration range were suppressed. These results are in agreement with those reported by other researchers.19,27 It was concluded that 0.5 mol L−1 CH3COOH used for the HG reaction was effective for equalizing the responses of As(III) and DMA. In contrast, it was not sufficient for As(V) and MMA at all. MMA was converted to its hydride at concentrations of 2 mol L−1 and higher. Considering the CH3COOH concentration in the A solution and the flow rates of the S and A solutions, similar results were obtained when the S solutions were acidified with CH3COOH at 0.2 mol L−1 (the additional A solution was excluded). Furthermore, the influence of the CH3COOH/CH3COONa buffering reaction medium (acetate buffer) at pH 4.5 on the responses of the As species was also checked. As shown in Fig. 2, the use of acetate buffer led to the same results for the As signals as that obtained in the presence of a low concentration of CH3COOH (0.2 mol L−1 in the S solution). However, it was found that the acetate buffer concentration affected the generation of hydrides from As(III) and DMA. The same responses for both species were obtained only at the lower concentration range (0.2–0.5 mol L−1). Nevertheless, using the 0.2 mol L−1 buffer very weak signals for MMA were measured (i.e. ∼3.5% of the signals recorded for As(III) and DMA). Above this concentration, the measurable signals for MMA were not acquired at all. The signals for As(V) were always suppressed and not acquired.
In the case of C6H8O7, dependence of the signals for As(III) and DMA on their concentrations corresponded to those observed in the presence of HCl, but as expected, the maxima of the As signals were shifted toward a lower C6H8O7 concentration (0.1 mol L−1). On the other hand, the response profiles found for As(V) and MMA were very similar to those obtained when CH3COOH was used for the HG reaction. Similar to CH3COOH, low concentrations of C6H8O7 (<0.1 mol L−1) ensured generation of arsines only for the As(III) and DMA species, but in contrast, equal signals were not obtained. HG of As carried out at adjusted pH (5.2) from the S solution prepared in 0.1 mol L−1 citrate buffer was additionally checked. Surprisingly, the results were different from those obtained when C6H8O7 was used. Accordingly, when the HG reaction was performed in the NaBH4–citric acid buffering mixture, only the As response of As(III) was not changed. The responses of the remaining species were negligible. Similar behavior was also observed by Karadjova et al.28
Hence, the obtained results from this experiment in addition to those carried out with citrate buffer were continued to evaluate the HG reaction conditions that would be applicable for selective determinations of the As species. In further experiments, corresponding arsines were generated at constant acidity and variable NaBH4 concentrations (from 0.01 to 1.0%). The responses of As(III), As(V), DMA and MMA recorded under the selected reaction conditions are presented in Fig. 3.
 | ||
| Fig. 3 Effect of the NaBH4 concentration on the measurements of As(III), As(V), DMA and MMA (20 ng g−1 each) by HG-ICP OES using HCl (a) or a citrate buffer (pH 5.2) (b) for the HG reaction media. Inet: the average net intensity of the As line for n = 3 measurements (S, A, R: sample, additional acid, reductant solutions). | ||
At first, the effect of the HCl medium was examined. To make use of the negative behavior of HCl towards DMA (see Fig. 1b), high HCl concentrations in the S (3 mol L−1) and A (10 mol L−1) solutions were applied. As can be seen (Fig. 3a), the relationships between responses of As(III), As(V) and MMA were similar. The signals related to As(V) and MMA significantly increased with higher NaBH4 concentrations and reached the maximal values at 1.0% NaBH4. In contrast, independent of the NaBH4 concentration, generation of the hydrides from DMA was irrelevant. In the region of lower NaBH4 concentrations, i.e. ≤0.1% only As(III) gave a measurable response. This is in agreement only with the results previously published by few researchers.13,14 Several other researchers obtained different results,26,41 but it must be noted that differences in the instrumental designs and HG procedures employed by others make such comparisons difficult.
Next, arsines were generated from the S solutions buffered at pH 5.2 (0.1 mol L−1 citrate buffer was used). It was established (Fig. 3b) that efficient generation of the As hydrides was achieved only for As(III) and DMA, but the NaBH4 concentration was critical. The signals for the As(V) and MMA forms were completely suppressed. Interestingly, using largely different NaBH4 concentrations (0.1 or 1.0%) only As(III) could be determined. Nevertheless, 1.0% NaBH4 was much better because the signal achieved for As(III) was 4-fold higher than that achieved with 0.1% NaBH4.
The effect of the pre-reductants on the generation of the corresponding arsines and their role in the HG reaction for all As species are illustrated in Fig. 4–6 for KI, TU and LC, respectively.
 | ||
| Fig. 4 Effect of the HCl concentration in the additional acid (A) solution (at fixed 1% NaBH4) (a) and effect of the NaBH4 concentration in the R solution (at fixed acidity in the S and A solutions) (b) on the measurements of As(III), As(V), DMA and MMA (20 ng g−1 each) by HG-ICP OES using the S solutions containing 0.5% KI–2.0% AA. Inet: the average net intensity of the As line for n = 3 measurements (S, A, R: sample, additional acid, reductant solutions. AA: ascorbic acid). | ||
The case of KI. In the case of KI, the mixture of this pre-reducing agent with AA (at 1
:4 concentration ratio) was preferred to prevent formation of I2 by self-oxidation of the I− ions in the HCl medium. A 0.5% KI–2.0% AA mixture was chosen. It was also established that the S solution treated with AA + KI (added separately, i.e. first AA then KI) before final acidification was more appropriate than when the already prepared mixture (KI–AA) was used.
As shown in Fig. 4a, generation of the As hydrides from DMA in the presence of KI–AA was not advantageous. Such behavior was not surprising because when KI was used, acidification of the S solution (3 mol L−1 HCl) was required. The relationship of the signal with acidity for DMA was the same as for the reference standard solution of DMA (see Fig. 1b). It may suggest that the responses of DMA after adding KI–AA depended more on the HCl concentration in the S and A solutions than on the KI–AA itself. In contrast to DMA, the use of KI–AA was found to be effective for As(III), As(V) and MMA. Compared to their reference signals (see Fig. 1b), the As responses resulting from the presence of KI–AA were close to that of As(III). Successfully, with the highest HCl concentration in the A solution, complete pre-reduction was afforded. At this point, it appears that the KI–AA mixture equalized the responses for the i-As and MMA forms (differences within the measurement error) as well as improved the signals during the measurements. Accordingly, a ∼11% increase in the signals for As(III), As(V) and MMA was obtained. It must be commented that KI–AA also provided practically the same responses for As(III), As(V) and MMA at lower HCl concentration in the A solution, i.e. 1 mol L−1 HCl. Nevertheless, the interference effect from DMA (∼20%) was observed therein. Additionally, the positive effect of KI–AA was also verified to be valid when the arsines were generated at fixed acidity, i.e. 3 (S)–10 (A) mol L−1 HCl, and varying NaBH4 concentrations, i.e. 0.01–1.0%. As shown in Fig. 4b, complete conversion of As(V) and MMA to As(III) was assured and the resulting As responses were comparable to that obtained for the reference standard solution of As(III) (see Fig. 3a). On the other hand, it was not sufficient for DMA. The positive behavior of the KI–AA mixture for As(V) and MMA in the present study agreed with that previously reported.26 Nevertheless, incomplete MMA conversion was also described.41
The case of TU. As reported previously for KI, the TU–AA mixture was favored due to the better solubility and stability of the S solutions containing TU–AA than TU alone. The mixture of TU–AA at a 1
:1 concentration ratio gave the best results (complete pre-reduction was afforded) and S solution with 1% KI–1% AA was found to be optimal.
Analyzing the results (Fig. 5a), it can be concluded that generation of the As hydrides for As(III), As(V) and MMA was not negatively affected by the presence of TU–AA. The signal for DMA was reduced and this was attributed to the HCl concentration used. TU–AA provided complete pre-reduction of As(V) and MMA to As(III), independent of the HCl concentration in the A solution. Although the presence of 3 mol L−1 HCl in the S solution led to suppression of the signal for DMA, TU–AA added to this solution had a positive effect on the generated DMA hydrides. It was observed that an increase in the HCl concentration in the A solution led to a significant growth of the response for DMA. At the highest, 10 mol L−1 HCl, its signal was ∼12 times higher than that reached for the reference standard solution of DMA and ∼50% of the signals obtained for the remaining As species.
 | ||
| Fig. 5 Effect of the HCl concentration in the sample (S) and additional acid (A) solutions on the measurements of As(III), As(V), DMA and MMA (20 ng g−1 each) by HG-ICP OES using 1.0% NaBH4 and the S solutions containing 1.0% TU–AA and acidified to 3 (a) and 1 (b) mol L−1 of HCl. Inet: the average net intensity of the As line for n = 3 measurements (AA: ascorbic acid. TU: thiourea). | ||
Deterioration of the DMA response in the presence of TU–AA could be achieved by lowering acidification of the S solution to 1 mol L−1 HCl. Under these conditions (Fig. 5b), corresponding signals coming from As(III), As(V) and MMA species were obtained, however, a higher concentration of HCl in the A solution (>6 mol L−1) had to be used for generation of their hydrides. Also, with lower acidification of the S solution, the responses for these As species were somewhat poorer (by 13–20%). Although the signals for DMA considerably decreased (2.9-fold), with TU–AA present in the S solution, no appropriate HCl concentration both in the S and A solutions was found to fully depress the DMA response.
The case of LC. LC can reduce As(V), DMA and MMA to the trivalent state already at low HCl concentration.20,28,29 Accordingly, the effect of the LC concentration in the S solution (0.25–1.0%) was initially studied. The experiments were performed at a fixed concentration of HCl and NaBH4 in the A and R solutions, i.e. 0.25 mol L−1 and 1.0%, respectively. Simple (not acidified with HCl) S solutions of each of the As species were analyzed first. It was found that the signals for all As species increased up to 0.5% LC and reached constant values up to 1.0% LC. Therefore, 0.5% LC was taken as optimal. The effect of the HCl concentration on HG of the As species in the presence of 0.5% LC was also examined using the S solutions acidified to 0.1–3 mol L−1 HCl. The corresponding As hydrides were generated in the reaction between the acidified S solutions and the 1.0% NaBH4 solution. Significant differences between the signals were obtained and this effect strongly depended on the HCl concentration in the S solution and the As form. However, the signal was lower at higher acidity versus lower acidity in the S solution.
Based on these observations, the effect of LC on HG of As as a function of the HCl concentration (0.01–10 mol L−1 in the A solution) was carefully studied. Simple S solutions containing 0.5% LC only (without additional HCl) were used. The relationships between As(III), As(V), DMA and MMA responses and the HCl concentration are given in Fig. 6a. For a better overview, the region with the lower HCl concentrations (<1 mol L−1) is emphasized (Fig. 6b).
 | ||
| Fig. 6 Effect of the HCl concentration in the additional acid (A) solution on the measurements of As(III), As(V), DMA and MMA (20 ng g−1 each) by HG-ICP OES using 1.0% NaBH4 and the simple S solutions containing 0.5% LC (acidification with HCl was omitted). Acidification of the A solution with HCl within 0.01–10 mol L−1 (a) and within 0.01–1 mol L−1 (b). Inet: average net intensity of the As line for n = 3 measurements (S: sample solution. LC: L-cysteine). | ||
The observed changes in the signals versus the HCl concentration were extremely different to those obtained without LC in the S solutions (see Fig. 1a). Interestingly, the relationships between the signal and the HCl concentration for the i-As species were close to but different than those observed for the o-As species. Compared to the signals obtained without LC (see Fig. 1a), maximal signals for different As forms in the presence of LC related to the much lower and narrower acidity range (0.2–0.25 mol L−1 HCl). At a HCl concentration of 0.25 mol L−1 (Fig. 6b), the responses for As(III), As(V) and DMA were practically identical (differences within SDs) and higher by about 27% than the response coming from MMA. With further increase in the HCl concentration, the signals of all the As forms sharply decreased, reaching minima at 0.5–1 mol L−1 HCl [for DMA and MMA] and 1–2 mol L−1 HCl [for As(III) and As(V)] in the A solution. Passing the mentioned minima, the As signals of all the As species started to gradually rise with the increasing HCl concentration and reached maximal values at different concentrations. Interestingly, with HCl at 9 or 10 mol L−1 the same responses for all four As species were achieved, showing quantitative pre-reduction of As(V), DMA and MMA to As(III). The response profiles obtained here were close to those found by Carrero et al.,20 but in contrast, it was possible in this work to get similar signals for i-As and o-As at higher HCl concentrations (>8 mol L−1); those for As(III) and As(V), in the cited work, were ∼30% lower than those for DMA and MMA.
Additional experiments were carried out in which the S solutions with 0.5% LC were acidified with HCl at different concentrations (1–4 mol L−1) while the HCl concentration in the A solution changed within 6–10 mol L−1. The obtained responses were compared with those achieved using the S solutions containing LC only. It was established that for As(III), As(V) and MMA, irrespective of the S solution acidity, the varying HCl concentration in the A solution did not change the signals for these species. On the other hand, the HCl concentration in the S solution led to improvement of the As signals coming from As(III), As(V) and MMA. In all cases, they were ∼20% higher than that obtained for the respective reference standard solutions. However, when the HCl concentration increased above 3 mol L−1, poorer precision was noticed (RSDs > 8%). In contrast, the presence of HCl in the S solutions up to 4 mol L−1 was responsible for deterioration of the As signals for DMA. Every time, its responses were two times lower than that recorded for the reference standard solution of DMA. The effect of the HCl concentration in the A solution was generally less critical. The changes in the DMA signals were minor (±5%).
In summary, the results showed an important role of the HCl concentration in the generation of the As hydrides for As(III), As(V), DMA and MMA in the presence of LC. Nevertheless, using 0.5% LC and different HCl concentrations (both in the S and A solutions), several conditions applicable in As speciation could be selected (see e.g. in Fig. 6).
3.3 Strategies for As determination and speciation by HG-ICP OES
As presented above, the response of As achievable in the HG reaction strongly depends on the oxidation state (III/V), on the nature of the hydride-active As species (inorganic/organic) and experimental conditions. All the best variants that can be utilized for speciation of As by HG-ICP OES are listed in Table 2. The response of the As species is expressed as the relative intensity (IRel), calculated as the ratio of the signal measured under the given conditions to the reference signal acquired under the optimum conditions for AsH3 generation in the HG system and the detection unit used in this work (see Section 3.1). Additionally, the compromised chemical conditions (pre-reduction and HG) for determination of the total As concentration (t-As) are included in this table. Five favorable speciation procedures (SP1–SP5) are highlighted.| Sampleb | Pre-reduction | HG reaction | I Rel | |||
|---|---|---|---|---|---|---|
| S | A | Rc | ||||
| a S, A, R: sample, additional acid, reductant solutions. DMA: dimethylarsinate. MMA: monomethylarsonate. AA: ascorbic acid. LC: L-cysteine. TU: thiourea. RT: room temperature. t-As: the total content of the hydride-active As species. i-As: the inorganic tri- and pentavalent As species [As(III) and As(V)]. o-As: the organic, i.e. methylated pentavalent As species (DMA and MMA). b Standard solutions containing As(III), As(V), DMA and MMA were used. c NaBH4 in the R solution. d Relative intensity calculated as the ratio of the measured intensity of the As analytical line under the given experimental conditions to the reference As signal acquired under the optimum conditions for AsH3 generation by HG-ICP OES from As(III). e Underlined = favorable pre-reduction and/or HG reaction conditions; SP1–SP5 refer to the optimum speciation procedures (SPs) for species-selective As determination under these favorable conditions. f As As(III) for the tri- and pentavalent inorganic and organic arsenic species after pre-reduction. | ||||||
| Selective measurement | ||||||
| As(III) | None | 0.1 mol L−1 citrate buffer (pH 5.2) | None | 1.0% |
 , SP1
, SP1 |
|
| 0.1% | 0.14 | |||||
| None | 3 mol L−1 HCl | 10 mol L−1 HCl | 0.1% | 0.20 | ||
| As(III) and DMA | None | 0.5 mol L−1 acetate buffer (pH 4.5) | None | 1.0% |
 , SP2 , SP2 |
|
| None | 0.2 mol L−1 CH3COOH | None | 1.0% | 0.82 | ||
| None | Acidification omitted | 0.5 mol L−1 CH3COOH | 1.0% | 0.80 | ||
| As(III), As(V) and MMA | 0.5% KI–2.0% AA (RT) | 3 mol L−1 HCl | 10 mol L−1 HCl | 1.0% |
 , SP3
, SP3 |
|
| 1.0% TU–1.0% AA (RT) | 1 mol L−1 HCl | 10 mol L−1 HCl | 1.0% | 0.87 | ||
| o-As | 0.5% LC (RT) | Acidification omitted | 2 mol L−1 HCl | 1.0% | 0.66, SP4 | |
| t-Asf | As(III) + As(V) + DMA + MMA | 0.5% LC (RT) | Acidification omitted | 10 mol L−1 HCl | 1.0% | 0.77, SP5 |
| i-As | 0.5% LC (RT) | Acidification omitted | 0.25 mol L−1 HCl | 1.0% | 1.11 | |
| 0.5% KI–2.0% AA (RT) | 3 mol L−1 HCl | 10 mol L−1 HCl (optionally 1 mol L−1 HCl) | 1.0% |

|
||
| 1.04 | ||||||
| 1.0% TU–1.0% AA (RT) | 3 mol L−1 HCl | 10 mol L−1 HCl (optionally 2 mol L−1 HCl) | 1.0% | 1.05 | ||
| 1.13 | ||||||
| i-As + DMA | 0.5% LC (RT) | Acidification omitted | 0.25 mol L−1 HCl | 1.0% | 1.11 | |
| i-As + MMA | 0.5% LC (RT) | 3 mol L−1 HCl | 10 mol L−1 HCl | 1.0% | 0.95 | |
The reaction medium of low concentrated CH3COOH (0.2 mol L−1 in the final reaction mixture) or in the presence of the acetate buffer (pH 4.5) and 1.0% NaBH4 allowed for the determination of the sum of As(III) and DMA, i.e. [As(III) + DMA]. The differences between these procedures were rather not observed. The responses of As(III) and DMA were similar and their signals were very high, however, ∼20% lower than that associated with the signal for the reference standard solution of As(III). As discussed previously, the use of the buffered S solutions was preferred (SP2) due to better control of acidity of the reaction medium and complete suppression of the HG activity associated with the presence of As(V) and MMA.
The use of the 0.5% KI–2.0% AA mixture in the S solution acidified to 3 mol L−1 HCl and the 10 mol L−1 HCl A solution for the HG reaction with 1.0% NaBH4 (SP3) ensured determination of the sum of As(III), As(V) and MMA, i.e. [i-As + MMA], without contribution of DMA to the overall signal. The use of the TU–AA mixture was disregarded because of the interference effect from DMA (∼16%) and lower responses for As(III), As(V) and MMA (∼15% decrease). It is worth noting that the KI–AA mixture was also found to be useful for leveling the signals during the measurements carried out under the optimum HG reaction conditions (∼15% increase).
Interestingly, the sum of the o-As species, i.e. [DMA + MMA], could be selectively determined after pre-reduction of the simple (not acidified with HCl) S solutions with 0.5% LC, followed by HG with 1.0% NaBH4 in the 2 mol L−1 HCl medium (SP4). The signals achieved for the S solutions pre-treated in this way were nearly 70% of that measured for As(III).
Similarly, in reference to the activity of the individual As species during HG in the presence of 0.5% LC and depending on the acidity conditions employed (either in the S or A solutions), determination of t-As in the S solutions containing three As forms, i.e. i-As + DMA or i-As + MMA as well as all four As species, i.e. As(III) + As(V) + DMA + MMA, is possible. In the first case, however, absence of MMA (for i-As + DMA) or DMA (for i-As + MMA) in the S solution must be considered to obtain reliable results. For example, for 0 (S)–0.25 (A) mol L−1 HCl conditions for HG of i-As and DMA, the contribution of MMA to the overall signal is high (∼73%). Similarly, the presence of DMA may affect quantification of the sum of i-As + MMA because under the optimum HG reaction conditions, i.e. 3 (S)–10 (A) mol L−1 HCl, the response of DMA reached nearly 50% of that achieved for other species. In the second case, determination of t-As is possible, regardless of the different As species present in the S solution. In this procedure (SP5), the simple S solution treated with 0.5% LC only and the high HCl concentration (10 mol L−1 HCl) in the A solution for the HG reaction can be applied. This treatment assures identical responses of all four species but at the cost of lower HG efficiency by 24% for As(III).
3.4 Non-chromatographic As speciation – speciation protocols
Detection of the As species in one solution was investigated in order to examine the selectivity of the optimum speciation procedures (SP1–SP5). Both single standards (with each species at 10 and 20 ng g−1) and mixed standard solutions were analyzed. The concentrations of the species in the respective mixtures were the same that corresponded to 40 and 80 ng g−1 of total As, respectively. The obtained results are demonstrated in Fig. 7 and expressed as the relative intensity (IRel), i.e. the ratio of the signal acquired for a given As species in the S solution without and with the remaining species, depending on the SP used. | ||
| Fig. 7 Assessment of the optimum speciation procedures (SPs) for species-selective As determination by HG-ICP OES in the S solutions containing 10 (a) and 20 ng g−1 (b) of As(III), As(V), DMA and MMA. IRel: relative intensity calculated as the ratio of the Inet acquired for a given As species in the S solution without and with the remaining species under SP conditions. SP1: [As(III)]. SP2: [As(III) + DMA]. SP3: [As(III) + As(V) + MMA]. SP4 [DMA + MMA]. SP5: [As(III) + As(V) + DMA + MMA]. | ||
Any potential interferences were minor for the S solution with the t-As content of 80 ng g−1 (Fig. 7b) or there were practically no interferences for the S solution with the t-As content of 40 ng g−1 (Fig. 7a). It leads to the conclusion that different As species can be determined in one solution by performing species-selective HG and ICP OES detection. Small potential interferences from i-As in the determination of o-As under SP4 were noted. In this approach, the signals for As(III) and As(V) reached maximally 13% of those for DMA and MMA, however, only for higher i-As concentrations in the S solution (20 ng g−1). At lower i-As concentrations (10 ng g−1), only DMA and MMA gave measurable and reproducible responses. For As(III) and As(V), irreproducible responses, being close to the blank level, were obtained and hence, the potential interference effect from both i-As forms was below 5%. These SPs also enabled the satisfactory repeatability of measurements (precision), usually within 1–6%. The respective RSDs were between 4.9 and 6.5% (SP1), 1.6 and 3.8% (SP2), 1.9 and 4.6% (SP3), 3.3 and 4.7% (SP4) and 1.4 and 5.9% (SP5). Preliminary experiments have also been made to test the applicability of the HG-ICP OES method with the developed SP procedures. They were included in the speciation of As in natural drinking water, where the samples were spiked with four As species (10 and 20 ng g−1) and determined following the respective SP procedures. As a result, quantitative recoveries of the added As species were obtained, i.e. 97.2–103.6% [As(III)], 96.0–101.7% [As(V)], 94.3–102.1% (DMA) and 98.8–104.9% (MMA), depending on their optimum conditions for the respective SP procedure used.
Finally, based on the different reactivities of all four As species under SP1–SP5 conditions, the protocols for non-chromatographic speciation of As were proposed. By combining the responses obtained for these five protocols, speciation of hydride-active As species, i.e. As(III), As(V), DMA and MMA, was possible. In addition to individual speciation, the scenario to fractionate As was evaluated. In the case of fractionation analysis, differentiation between the As species having the same nature was achieved. Examples of variants for the measurements of two-, three- and four-species of As in one solution were evaluated and are detailed in Table 3.
| Sample | Protocol | Measured | |
|---|---|---|---|
| a SP1–SP5: the optimum speciation procedures for the As species. SP1: [As(III)], SP2: [As(III) + DMA], SP3: [As(III) + As(V) + MMA], SP4: [DMA + MMA], SP5: [As(III) + As(V) + DMA + MMA]. DMA: dimethylarsinate. MMA: monomethylarsonate. T-As: the total As content (hydride-active and non-hydride-active forms). t-As: the total content of the hydride-active As species. i-As: the inorganic As species [As(III) and As(V)]. o-As: the organic, i.e. methylated pentavalent As species (DMA and MMA). t-Ash: the fraction of the hydride-active As species [As(III) + As(V) + DMA + MMA]. t-Asnh: the fraction of the non-hydride active As species. b As As(III) after pre-reduction with 0.5% LC for the unacidified sample solution. 0.25 mol L−1 HCl (A) and 1% NaBH4 (R) used for HG. c As As(III) after pre-reduction with 0.5% LC for the sample solution acidified to 3 mol L−1 HCl. 10 mol L−1 HCl (A) and 1% NaBH4 (R) used for HG. | |||
| Speciation | As(III) | SP1, SP3 | (a) As(III) – SP1 |
| As(V) | (b) As(V) – by the difference between the sum of {As(III) + As(V)} and As(III) → SP3–SP1 | ||
| DMA | SP2, SP4 | (a) DMA – SP2 | |
| MMA | |||
| (b) MMA – by the difference between the sum of {DMA + MMA} and DMA → SP4–SP2 | |||
| SP2, SP3 (SP4 can be added) | (a) DMA – SP2 | ||
| (b) MMA – SP3 | |||
| It can be verified by comparing the sum of {DMA + MMA} with the o-As content determined under SP4 | |||
| As(III) | SP1, SP3, SP5b | (a) As(III) – SP1 | |
| As(V) | |||
| DMA | (b) As(V) – by the difference between the sum of {As(III) + As(V)} and As(III) → SP3–SP1 | ||
| (c) DMA – by the difference between t-As (SP5b) and the sum of remaining species → SP5b–SP3 | |||
| SP1, SP4, SP5b | (a) As(III) – SP1 | ||
| (b) DMA – SP4 | |||
| (c) As(V) – by the difference between t-As (SP5b) and the sum of remaining species → SP5b–{SP1 + SP4} | |||
| SP1, SP2, SP5b | (a) As(III) – SP1 | ||
| (b) DMA – by the difference between the sum {As(III) + DMA} and As(III) → SP2–SP1 | |||
| (c) As(V) – by the difference between t-As (SP5b) and the sum of remaining species → SP5b–SP2 | |||
| As(III) | SP1, SP4, SP5c (optionally SP3) | (a) As(III) – SP1 | |
| As(V) | (b) MMA – SP4 | ||
| MMA | (c) As(V) – by the difference between t-As (SP5c) and the sum of remaining species → SP5c–{SP1 + SP4} (optionally SP3 for the sum of {As(III) + As(V) + MMA} can be used) | ||
| As(III) | SP1–SP4 (SP5 can be added) | (a) As(III) – SP1 | |
| As(V) | |||
| DMA | (b) DMA – by the difference between the sum of {As(III) + DMA} and As(III) → SP2–SP1 | ||
| MMA | |||
| (c) MMA – by the difference between the sum of {DMA + MMA} and DMA → SP4–{SP2–SP1} | |||
| (d) As(V) – by the difference between the sum of {As(III) + As(V) + MMA} and As(III) and MMA → SP3 + SP2–2SP1–SP4 | |||
| It can be verified by comparing the sum of all species with the t-As content determined under SP5 | |||
| SP1, SP2, SP4, SP5 | (a–c) Repeated (a–c) steps (as above) for As(III) (a), DMA (b) and MMA (c) | ||
| (d) As(V) – by the difference between t-As (SP5) and the sum of remaining species → SP5–SP4–SP1 | |||
| Fractionation | o-As | SP4, SP5 | (a) o-As – SP4 |
| i-As | (b) i-as – by the difference between t-As (SP5) and the sum of o-As → SP5–SP4 | ||
| In this approach fractions of i-as and o-As can be estimated (fractions refer to the sum of the respective species, i.e. i-as [As(III) and As(V)] and o-As (DMA and MMA)) | |||
| t-Ash | SP3 (or SP5c), SP5 | (a) t-Ash – SP5 | |
| t-Asnh | (b) t-Asnh – by the difference between T-As (SP3) and the sum of t-Ash → SP3–SP5 | ||
| T-As means the total As content estimated as As(III) under SP3 after sample digestion and refers to all As species, i.e. non-hydride and hydride active. The fraction of the hydride-active species (t-Ash), i.e. the sum of [As(III) + As(V) + DMA + MMA] and the fraction of the unreactive forms toward HG (t-Asnh) can be estimated | |||
4 Conclusions
Determination of As by HG-ICP OES through the reaction with NaBH4 in the acidic medium from sample solutions containing various, differing by the oxidation state (III/V) and nature (inorganic/organic), species of this element is not an easy task. Four major As species, i.e. As(III), As(V), DMA and MMA, react with NaBH4 in extremely different ways, depending on the reductant concentration, the reaction medium used for generation of the As hydrides (related to the type of acid and its acidity) and finally, the kind of pre-reducing agent employed in the pre-reduction step. The compromised reaction conditions, under which the same response for all four As species can be obtained, have to be found in order to obtain reliable results for determination of the total concentration of As.Otherwise, careful control of the reaction medium, the concentration of NaBH4 and the pre-reducing agent used results (as demonstrated in this study) in selective generation of the hydrides of different As species directly by HG-ICP OES and enables speciation of this element. By combining the responses obtained under different pre-reduction and HG reaction conditions, several protocols for speciation of all four As species in one solution were proposed. Taking into account the measurements of total i-As alone for risk-assessment purposes, the interference effect arising from o-As in HG cannot be ignored. However, it was possible to establish adequate pre-reduction and HG reaction conditions to determine i-As in the presence of o-As without prior separation.
Nowadays, it is well accepted that the combination of HPLC with ICP MS, although very expensive, is the best tool for element speciation because it provides a complete and sophisticated picture of the species eluted from one injection of a sample, moreover, quantified at a (ultra)trace level. On the other hand, in some cases, like for As, it is sufficient to determine e.g. only the most toxic species [As(III,V)] or the group of species of this element (i-As, o-As) as a screening parameter to obtain important information for environmental or food purposes. In this sense, non-chromatographic techniques based on a simple instrumentation (with atomic spectrometric detectors available in most laboratories) can be alternatively used in the speciation studies. They offer shorter analysis time, lower costs and comparable or even better sensitivity (related to the possible species separation improving their pre-concentration) than that provided by the traditional chromatographic approaches. In reference to this, the selective procedures evaluated here for the determination of As(III), As(V), DMA and MMA clearly show the potential of the HG technique coupled to ICP OES for the non-chromatographic As speciation. Although the results of this study refer to simple sample solutions, i.e. standards and natural drinking water, they are important, because they indicate the possibility to effectively speciate and fractionate As obviating in this way chromatographic separation.
Acknowledgements
This study was funded by a statutory activity subsidy from the Polish Ministry of Science and Higher Education for the Faculty of Chemistry, Wroclaw University of Science and Technology.References
- S. Caroli, F. L. Torre, F. Petrucci and N. Violante, Arsenic speciation and Health Aspects, in Element Speciation in Bioinorganic Chemistry, ed. S. Caroli, John Wiley and Sons, New York, 1996, pp. 445–463 Search PubMed.
- S. Chen, Q. Guo and L. Liu, Food Anal. Methods, 2017, 10, 740–748 CrossRef.
- T. Narukawa, A. Hioki and K. Chiba, J. Agric. Food Chem., 2012, 60, 1122–1127 CrossRef CAS PubMed.
- B. Sadee, M. E. Foulkes and S. J. Hill, J. Anal. At. Spectrom., 2015, 30, 102–118 RSC.
- L. Jorhem, C. Astrand, B. Sundstrom, M. Baxter, P. Stokes, J. Lewis and K. Petersson Grawe, Food Addit. Contam., Part A, 2008, 25, 284–292 CrossRef CAS PubMed.
- M. Fontcuberta, J. Calderon, J. R. Villalbí, F. Centrich, S. Portana, A. Espelt, J. Duran and M. Nebot, J. Agric. Food Chem., 2011, 59, 10013–10022 CrossRef CAS PubMed.
- I. N. Pasias, N. S. Thomaidi and E. A. Piperaki, Microchem. J., 2013, 108, 1–6 CrossRef CAS.
- T. Ahmadi-Jouibari and N. Fattahi, Food Addit. Contam., Part A, 2015, 32, 1140–1147 CrossRef CAS PubMed.
- W. H. Lamont, J. Food Compos. Anal., 2003, 16, 687–695 CrossRef CAS.
- G. Chen and T. Chen, Talanta, 2014, 119, 202–206 CrossRef CAS PubMed.
- R. R. Rasmussen, Y. Qian and J. J. Sloth, Anal. Bioanal. Chem., 2013, 405, 7851–7857 CrossRef CAS PubMed.
- Y. Huang, J. Shan, B. Fan, Y. He, S. Xia, Y. Sun, J. Lu, M. Wang and F. Wang, Anal. Methods, 2015, 7, 8896–8900 RSC.
- S. Musil, Á. H. Petursdottir, A. Raab, H. Gunnlaugsdottir, E. Krupp and J. Feldmann, Anal. Chem., 2014, 86, 993–999 CrossRef CAS PubMed.
- K. Tasev, I. Karadjova and T. Stafilov, Microchim. Acta, 2005, 149, 55–60 CrossRef CAS.
- G. Luo, Anal. Lett., 2012, 45, 2493–2507 CrossRef CAS.
- P. Pohl, TrAC, Trends Anal. Chem., 2004, 23, 87–101 CrossRef CAS.
- M. Welna, Aust. J. Chem., 2015, 68, 441–446 CrossRef CAS.
- J. R. Behari and R. Prakash, Chemosphere, 2006, 63, 17–21 CrossRef CAS PubMed.
- K. Marschner, S. Musil and J. Dedina, Anal. Chem., 2016, 88, 6366–6373 CrossRef CAS PubMed.
- P. Carrero, A. Malave, J. L. Burguera, M. Burguera and C. Rondon, Anal. Chim. Acta, 2001, 438, 195–204 CrossRef CAS.
- A. N. Anthemidis, G. A. Zachariadis and J. A. Stratis, Anal. Chim. Acta, 2005, 547, 237–242 CrossRef CAS.
- P. Liang and A. Li, Fresenius. J. Anal. Chem., 2000, 368, 418–420 CrossRef CAS.
- P. Cicero do Nascimento, D. Bohrer, E. Becker and L. Machado de Carvalho, J. Non-Cryst. Solids, 2005, 351, 1312–1316 CrossRef CAS.
- A. Gonzalvez, M. L. Cervera, S. Armenta and M. de la Guardia, Anal. Chim. Acta, 2009, 636, 129–157 CrossRef CAS PubMed.
- M. A. Vieira, P. Grinberg, C. R. R. Bobeda, M. N. M. Reyes and R. C. Campos, Spectrochim. Acta, Part B, 2009, 64, 459–476 CrossRef.
- J. Majda Bundaleska, T. Stafilov and S. Arpadjan, Int. J. Environ. Anal. Chem., 2005, 85, 199–207 CrossRef.
- Y. Y. Cabon and N. Cabon, Anal. Chim. Acta, 2000, 418, 19–31 CrossRef.
- I. B. Karadjova, L. Lampugnani, M. Onor, A. D. '. Ulivo and D. L. Tsalev, Spectrochim. Acta, Part B, 2005, 60, 816–823 CrossRef.
- A. Shraim, B. Chiswell and H. Olszowy, Talanta, 1999, 50, 1109–1127 CrossRef CAS PubMed.
- M. N. Matos Reyes, M. L. Cervera, R. C. Campos and M. de la Guardia, Spectrochim. Acta, Part B, 2007, 62, 1078–1082 CrossRef.
- P. Cava-Montesinos, K. Nilles, M. L. Cervera and M. de la Guardia, Talanta, 2005, 66, 895–901 CrossRef CAS PubMed.
- P. K. Petrov, J. Majda Serafimovska, S. Arpadjan, D. L. Tsalev and T. Stafilov, Cent. Eur. J. Chem., 2008, 6, 216–221 CAS.
- S. M. Macedo, D. C. dos Santos, R. M. de Jesus, G. O. da Rocha, S. L. C. Ferreira and J. B. de Andrade, Microchem. J., 2010, 96, 46–49 CrossRef CAS.
- S. M. Macedo, R. M. de Jesus, K. S. Garcia, V. Hatje, A. F. d. S. Queiroz and S. L. C. Ferreira, Talanta, 2009, 80, 974–979 CrossRef CAS PubMed.
- S. Maity, S. Chakravarty, P. Thakur, K. K. Gupta, S. Bhattacharjee and B. C. Roy, Chemosphere, 2004, 54, 1199–1206 CrossRef CAS PubMed.
- A. Maratta, L. Dante Martinez and P. Pacheco, Microchem. J., 2016, 127, 199–205 CrossRef CAS.
- L. Cai, C. Xu, M. Zhong, Y. Wu and S. Zheng, Asian J. Chem., 2013, 25, 8169–8172 CAS.
- M. E. Sigrist and H. R. Beldomenico, Spectrochim. Acta, Part B, 2004, 59, 1041–1045 CrossRef.
- J. Muller, Fresenius. J. Anal. Chem., 1999, 363, 572–576 CrossRef.
- A. Caballo-Lopez and M. D. Luque de Castro, J. Anal. At. Spectrom., 2002, 17, 1363–1367 RSC.
- C. Cerveira, D. Pozebon, D. Pompeu de Moraes and J. Camila Silva de Fraga, Anal. Methods, 2015, 7, 4528–4534 RSC.
- T. Deng and M. Liao, Spectrosc. Lett., 2005, 38, 109–119 CrossRef CAS.
- M. Welna, J. Lasowska and W. Zyrnicki, J. Braz. Chem. Soc., 2011, 22, 1164–1167 CrossRef CAS.
| This journal is © The Royal Society of Chemistry 2017 |