 Open Access Article
 This Open Access Article is licensed under a
 Creative Commons Attribution 3.0 Unported Licence
Atmospheric protein chemistry influenced by anthropogenic air pollutants: nitration and oligomerization upon exposure to ozone and nitrogen dioxide†
Fobang
Liu
a,
Pascale S. J.
Lakey
a,
Thomas
Berkemeier
ab,
Haijie
Tong
 a,
Anna Theresa
Kunert
a,
Hannah
Meusel
a,
Yafang
Cheng
a,
Hang
Su
a,
Janine
Fröhlich-Nowoisky
a,
Senchao
Lai
c,
Michael G.
Weller
d,
Manabu
Shiraiwa
e,
Ulrich
Pöschl
a and
Christopher J.
Kampf
*af
a,
Anna Theresa
Kunert
a,
Hannah
Meusel
a,
Yafang
Cheng
a,
Hang
Su
a,
Janine
Fröhlich-Nowoisky
a,
Senchao
Lai
c,
Michael G.
Weller
d,
Manabu
Shiraiwa
e,
Ulrich
Pöschl
a and
Christopher J.
Kampf
*af
aMultiphase Chemistry Department, Max Planck Institute for Chemistry, Hahn-Meitner-Weg 1, 55128 Mainz, Germany
bSchool of Chemical & Biomolecular Engineering, Georgia Tech, Atlanta, GA, USA
cSchool of Environment and Energy, South China University of Technology, Higher Education Mega Center, Guangzhou 510006, P. R. China
dDivision 1.5 Protein Analysis, Federal Institute for Materials Research and Testing (BAM), Richard-Willstätter-Str. 11, 12489 Berlin, Germany
eDepartment of Chemistry, University of California, Irvine, CA, USA
fInstitute for Organic Chemistry, Johannes Gutenberg University Mainz, Duesbergweg 10-14, 55128 Mainz, Germany. E-mail: kampfc@uni-mainz.de
First published on 10th March 2017
Abstract
The allergenic potential of airborne proteins may be enhanced via post-translational modification induced by air pollutants like ozone (O3) and nitrogen dioxide (NO2). The molecular mechanisms and kinetics of the chemical modifications that enhance the allergenicity of proteins, however, are still not fully understood. Here, protein tyrosine nitration and oligomerization upon simultaneous exposure of O3 and NO2 were studied in coated-wall flow-tube and bulk solution experiments under varying atmospherically relevant conditions (5–200 ppb O3, 5–200 ppb NO2, 45–96% RH), using bovine serum albumin as a model protein. Generally, more tyrosine residues were found to react via the nitration pathway than via the oligomerization pathway. Depending on reaction conditions, oligomer mass fractions and nitration degrees were in the ranges of 2.5–25% and 0.5–7%, respectively. The experimental results were well reproduced by the kinetic multilayer model of aerosol surface and bulk chemistry (KM-SUB). The extent of nitration and oligomerization strongly depends on relative humidity (RH) due to moisture-induced phase transition of proteins, highlighting the importance of cloud processing conditions for accelerated protein chemistry. Dimeric and nitrated species were major products in the liquid phase, while protein oligomerization was observed to a greater extent for the solid and semi-solid phase states of proteins. Our results show that the rate of both processes was sensitive towards ambient ozone concentration, but rather insensitive towards different NO2 levels. An increase of tropospheric ozone concentrations in the Anthropocene may thus promote pro-allergic protein modifications and contribute to the observed increase of allergies over the past decades.
1. Introduction
Allergies represent an important issue for human health and the prevalence of allergic diseases has been increasing worldwide over the past decades.1,2 Among other explanations, air pollution has been proposed as a potential driver for this increase.3–6 It is well established that air pollutants, especially diesel exhaust particles (DEPs), can act as adjuvants and facilitate allergic sensitization in the human body.7,8 Air pollutants like nitrogen dioxide (NO2), sulfur dioxide (SO2), and ozone (O3) have been shown to interact with and modify allergen carriers like pollen grains and fungal spores, increasing the release of allergenic proteins.8,9 Moreover, post-translational modifications (PTM) of allergenic proteins can be induced by reactive trace gases such as O3 and NO2 which modifies their structure and activity, thus altering the immunogenicity of the proteins.10–13Airborne allergenic proteins (aeroallergens) are contained not only in coarse biological particles such as pollen grains,14 but also in the fine fraction of air particulate matter (aerodynamic diameter < 2.5 μm).15–17 The occurrence of allergenic proteins in fine particles can be explained by several processes, including the release of pollen cytoplasmic granules (PCGs) from the rupture of pollen grains,9 fragmentation of airborne cellular material,18 and contact transfer of allergenic proteins onto fine particles.18,19 Therefore, aeroallergens can be directly exposed to ambient O3 and NO2, promoting chemical modifications like tyrosine (Tyr) nitration and oligomerization.
Laboratory and field investigations have shown that proteins can be oxidized, nitrated and/or oligomerized upon exposure to NO2 and O3 in synthetic gas mixtures or polluted urban air.11,12,15,20 The mechanisms of protein nitration by O3 and NO2, and protein cross-linking (oligomerization) by O3 both involve the formation of long-lived reactive oxygen intermediates (ROIs), which are most likely tyrosyl radicals, as proposed earlier.12,20–24 The ROIs can subsequently react with each other forming dityrosine (DTyr) crosslinks with NO2 to form nitrotyrosine (NTyr) residues, or undergo further oxidation reactions. Using quantum chemical methods, Sandhiya et al.22 showed that six different intermediates can be formed through the initial oxidation of Tyr residues by O3, out of which the tyrosyl radical is favorable due to a small energy barrier, particularly in the aqueous phase. In the absence of NO2, tyrosyl radicals can undergo self-reaction to stabilize in the form of dimers. Under physiological conditions, Pfeiffer et al.25 found that DTyr was a major product of Tyr modification caused by low steady-state concentrations of peroxynitrite, while high fluxes (>2 μM s−1) of nitrogen oxide/superoxide anions (NO/O2−) are required to render peroxynitrite an efficient trigger of Tyr nitration. Thus, kinetic competition between Tyr nitration and dimerization (or oligomerization) upon protein exposure to O3 and NO2 can be expected, which needs to be explored in detail to assess the relevant atmospheric conditions that favor potentially health relevant protein modifications.
In this study, we explored the oxidation, nitration, and oligomerization reactions of proteins induced by O3 and NO2, and their kinetics under different atmospherically relevant conditions using bovine serum albumin (BSA) as a model protein. Coated-wall flow-tube and bulk solution experiments were performed to study the kinetics of protein nitration and oligomerization at O3 and NO2 concentrations of 5–200 ppb, and relative humidities (RH) of 45% and 96%, utilizing a size exclusion chromatography/spectrophotometry method. Additionally, we used the kinetic multilayer model of aerosol surface and bulk chemistry (KM-SUB)26 to investigate which chemical reactions and transport processes control the concentration and time dependence of protein oligomerization and nitration.
2. Experimental
2.1. Materials
Bovine serum albumin (BSA, A5611) and sodium phosphate monobasic monohydrate (NaH2PO4·H2O, 71504), were purchased from Sigma Aldrich (Germany). Sodium hydroxide (NaOH, 0583) was purchased from VWR (Germany). 10× Tris/glycine/SDS (161-0732) was purchased from Bio-Rad Laboratories (USA). High purity water (18.2 MΩ cm) for chromatography was taken from a Milli-Q Integral 3 water purification system (Merck Millipore, USA). The high purity water (18.2 MΩ cm) was autoclaved before use if not specified otherwise.2.2. Protein O3/NO2 exposure setup
Reactions of BSA with O3/NO2 mixtures were performed both homogeneously in aqueous solutions and heterogeneously via the exposure of BSA-coated glass tubes to gaseous O3/NO2 at different levels of relative humidity (RH). Before the exposure experiments, BSA solutions (0.6 mL, 0.33 mg mL−1) were loaded into the glass tube and dried by passing a nitrogen (N2, 99.999%) flow at ∼1 L min−1 through a specific rotating device,27 which is essential to ensure homogeneous coating and experiment reproducibility. The BSA-coated glass tube was then connected to the experimental setup. The experimental setup (Fig. S1, ESI†) was described previously,20 and was extended by incorporating an additional flow of NO2 after the humidifier.Briefly, ozone was produced from synthetic air passed through a UV lamp (L.O.T.-Oriel GmbH & Co. KG, Germany) at ∼1.9 L min−1. The gas flow was then split and one flow was passed through a Nafion® gas humidifier (MH-110-12F-4, PermaPure, USA) operated with autoclaved high purity water, while the other flow remained dry. RH could be varied in a wide range by adjusting the ratio between the dry and humidified air flow. During the experiments, the standard deviation from the set RH values was <2% RH. The gas flow with a set O3 concentration and RH was then mixed with a N2 flow containing ∼5 ppmV NO2 (Air Liquide, Germany). The NO2 concentrations were adjusted by varying the flow rate (20–80 mL min−1) of the ∼5 ppmV NO2 flow. The combined gas flow was then directed through the BSA-coated glass tube. The concentrations of O3 and NO2 as well as RH were measured using commercial monitoring instruments (Ozone analyzer, 49i, Thermo Scientific, Germany; NOx analyzer, 42i-TL, Thermo Scientific, Germany; RH sensor FHA 646-E1C with ALMEMO 2590-3 instrument, Ahlborn, Mess- und Regelungstechnik, Germany). After exposure, the proteins were extracted from the glass tube with 1.5 mL of 1× Tris/glycine/SDS (pH 8.3) buffer to avoid precipitation of protein oligomers in the extract solution.
For homogeneous bulk solution reactions, the O3/NO2 gas mixtures were directly bubbled through 1.5 mL of 0.13 mg mL−1 BSA aqueous solutions (pH 7.0 ± 0.2; measured by a pH meter, model WTW multi 350i, WTW, Germany) at a flow rate of 60 mL min−1 using a Teflon tube (ID: 1.59 mm). All heterogeneous and homogeneous exposure experiments were performed in duplicate.
2.3. SEC-HPLC-DAD analysis
Product analysis was performed using high-performance liquid chromatography coupled to diode array detection (HPLC-DAD, Agilent Technologies 1200 series). The HPLC-DAD system consisted of a binary pump (G1379B), an autosampler with a thermostat (G1330B), a column thermostat (G1316B), and a photodiode array detector (DAD, G1315C). ChemStation software (Rev. B.03.01, Agilent) was used for system control and data analysis. Molecular weight (MW) separation by size exclusion chromatography (SEC) was carried out using an AdvanceBio SEC column (Agilent, 300 Å, 300 × 4.6 mm, 2.7 μm). Isocratic separation at a flow rate of 0.35 mL min−1 was carried out using a mobile phase of 150 mM NaH2PO4 buffer (adjusted to pH 7 with 10 M NaOH (aq)) after injecting 40 μL of sample. The absorbance was monitored by the DAD at wavelengths of 220, 280 and 357 nm. Each chromatographic run was performed in duplicate.A protein standard mix 15–600 kDa (69385, Sigma Aldrich, Germany) containing bovine thyroglobulin (MW = 670 kDa), γ-globulin from bovine blood (MW = 150 kDa), chicken egg albumin, grade VI (MW = 44.3 kDa), and ribonuclease A (MW = 13.7 kDa) was used for SEC column calibration (elution time vs. log![[thin space (1/6-em)]](https://www.rsc.org/images/entities/char_2009.gif) MW). Details can be found in Fig. S2 in the ESI.† It should be noted that SEC separates molecules according to their hydrodynamic sizes, thus only approximate molecular masses can be obtained by this calibration method.
MW). Details can be found in Fig. S2 in the ESI.† It should be noted that SEC separates molecules according to their hydrodynamic sizes, thus only approximate molecular masses can be obtained by this calibration method.
2.4. Determination of protein oligomer mass fractions and nitration degrees
A detailed description of the simultaneous determination of protein oligomer mass fractions and nitration degrees using the SEC-HPLC-DAD analysis described above can be found in Liu et al.28 Briefly, we report the formation of BSA oligomers as the temporal evolution in the ratios of the respective oligomers (dimers, trimers, and oligomers with n ≥ 4) to the sum of monomer and all oligomer peak areas at the absorption wavelength of 220 nm. Assuming that the molar extinction coefficients of the individual protein oligomer fractions are multiples of the monomer extinction coefficient, the calculated oligomer ratios correspond to the mass fractions (ω) of the individual oligomers. Nitration degrees (NDs), defined as the concentration of nitrotyrosine (NTyr) divided by the sum of the concentrations of NTyr and Tyr, were obtained for BSA monomers and dimers, using the respective peak areas of the monomer and dimer signals at wavelengths of 280 nm and 357 nm. For calculation of the total protein ND, the sum of the peak areas of all protein signals at wavelengths of 280 nm and 357 nm was used. Note that corresponding to the definition of the ND, the same number of nitrated Tyr residues in a BSA monomer and dimer will lead to a factor of 2 difference in the individual NDs, because a BSA dimer contains twice the number of Tyr residues compared to the monomer. Further information on the calculation of NDs can be found in Liu et al.28 The values and errors of the calculated NDs and oligomer mass fractions represent the arithmetic mean values and standard deviations of duplicate experiments.29 The commercially available BSA also contains dimers and trimers of the protein as well as pre-nitrated monomers and dimers (∼NDs 0.9%). Therefore, the reported values of oligomer mass fractions and NDs were corrected for these background signals.3. Results and discussion
3.1. Protein oligomerization
Fig. 1 and 2 show the effects of varying NO2 and O3 concentrations on protein oligomerization for homogeneous bulk solution and coated-wall flow-tube experiments, respectively. Exposures were carried out at fixed NO2 concentrations with varying O3 concentrations and vice versa. The exposure time was varied from 0.5 up to 12 h. While in bulk solution experiments dimers were generally observed as the major reaction products of BSA with O3 and NO2, trimers or higher oligomers can be dominant products in the coated-wall flow-tube experiments at longer exposure times, depending on the experimental conditions.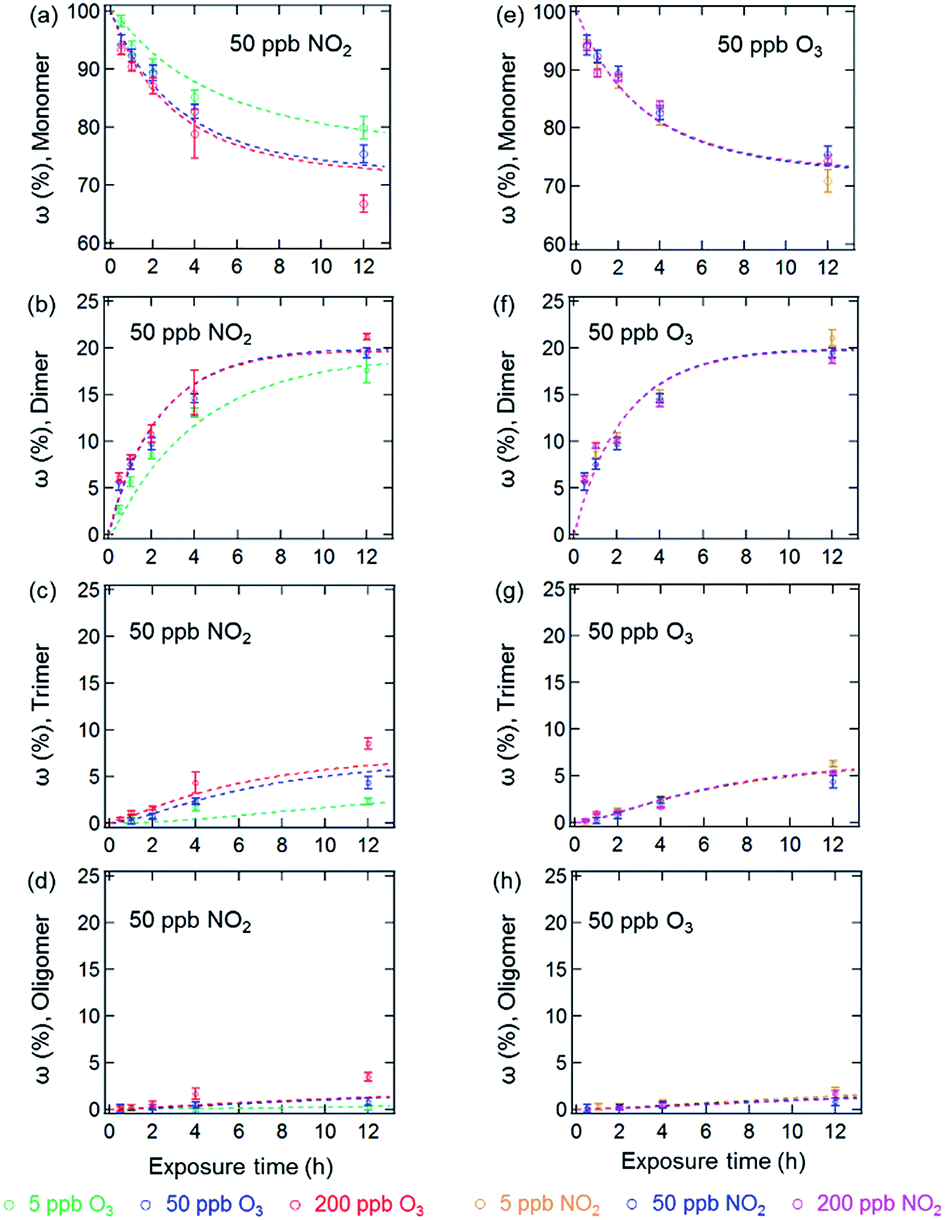 | ||
| Fig. 1 Temporal evolution of protein oligomer mass fractions (ω (%), monomer, dimer, trimer and oligomer (n ≥ 4)) in the aqueous phase reaction of BSA with O3/NO2: ((a)–(d)) at a fixed NO2 concentration of 50 ppb with varied O3 concentrations; ((e)–(h)) at a fixed O3 concentration of 50 ppb with varied NO2 concentrations. The data points and error bars represent the arithmetic mean values and standard deviations of duplicate experiments. The dashed lines are the results of the kinetic model. | ||
 | ||
| Fig. 2 Temporal evolution of protein oligomer mass fractions (ω (%), monomer, dimer, trimer and oligomer (n ≥ 4)) upon exposure of BSA films (thickness 34 nm) to various O3/NO2 concentrations: ((a)–(d)) at 45% RH; ((e)–(h)) at 96% RH. The data points and error bars represent the arithmetic mean values and standard deviations of duplicate experiments. The dashed lines are the results of the kinetic model. | ||
The results of the bulk solution experiments on protein oligomerization are illustrated in Fig. 1. Generally, the mass fractions of dimers, trimers, and higher oligomers increase with increasing reaction times, reaching up to 21 ± 1% for dimers, 9 ± 1% for trimers, and 4 ± 1% for oligomers with n ≥ 4 after 12 h of exposure. The minimum mass fraction of monomers correspondingly was found to be 66%. While varying the O3 concentrations (Fig. 1a–d, fixed 50 ppb of NO2) from 5 to 200 ppb significantly affected the temporal evolutions observed for the mass fractions of the different oligomers, changing the NO2 concentration (Fig. 1e–h, fixed 50 ppb of O3) in the same range did not result in significant changes in oligomer mass fractions. The solubility of O3 and NO2 in water is ∼10−5 mol mL−1 (derived from their Henry’s law constants: Ksol,cc,O3 ≈ Ksol,cc,NO2 ≈ 10−2 M atm−1)30 under our experimental conditions. Increasing O3 and NO2 gas concentrations between 5 to 200 ppb should result in concentrations of O3 and NO2 between 7 × 10⁻¹¹ to 3 × 10⁻⁹ M in the aqueous phase. Thus, the insignificant change of oligomer mass fractions with varied NO2 concentration should not be caused by a saturation of dissolved NO2 in the concentration range investigated (5 to 200 ppb).
Mechanistically, the reactions between O3/NO2 and protein Tyr residues involve the formation of ROIs (tyrosyl radicals) resulting from the reaction of Tyr with O3. These ROIs can then either react with NO2 to form NTyr residues or cross-link due to intermolecular DTyr formation.6,20 Ozonolysis of Tyr may also result in other oxidized products such as 3,4-dihydroxyphenylalanine (DOPA).31 However, the reaction mechanism for the formation of these oxidized products is not the focus of this study and we only consider these modified Tyr derivatives in the proposed mechanism (Table S1†) as a portion of the oxidized amino acid residues. Regardless, an inhibition of intermolecular DTyr cross-linking would be expected with increasing NO2 concentrations. However, no such behavior was observed. Furthermore, similar protein oligomer mass fractions were observed previously in the absence of NO2 for BSA exposed to O3 in bulk solution experiments with comparable levels of O3 (50 and 200 ppb).20 This observation may be due to the high number of accessible Tyr residues on the dissolved BSA molecules in solution, because after 12 h of exposure, 66% of BSA (Fig. 1a) is still present in monomeric form.
The results of the coated-wall flow-tube experiments on protein oligomerization are illustrated in Fig. 2. In these experiments, thin protein films were exposed to O3/NO2 mixtures. A film thickness of ∼34 nm, or roughly five layers of BSA, can be calculated assuming an even distribution of the BSA molecules on the inner surface of the glass tube.20 The experiments were performed at 45% and 96% RH with O3/NO2 concentrations of 50/50, 200/50, and 50/200 ppb, respectively. Generally, the reactive sites accessible for oligomerization reactions of the proteins are limited here compared to aqueous solutions, leading to smaller mass fractions of protein oligomers. Furthermore, we observed a 30–40% reduction of the overall oligomer mass fraction (dimer, trimer, and oligomer ≥4) compared to similar flow-tube experiments in the absence of NO2 for comparable RH and O3 concentrations.20 Apparently, the lower diffusivity of the proteins in this solid (45% RH) or semi-solid (96% RH) state induces a competition between DTyr and NTyr formation, also indicated by the observation of slower reaction rates for oligomerization in the bulk of the thin protein film compared to its surface.20,23
In contrast to the bulk solution experiments, which show a steady increase of the oligomer mass fractions with exposure time, dimer and trimer mass fractions in the flow tube experiments peaked at exposure times of 2–4 h, depending on RH and trace gas concentrations, while only higher oligomers steadily increased over the course of the reaction time (see Fig. 2). This result indicates that as the exposure proceeds, the formation of dimers and trimers becomes slower than their consumption converting them into higher oligomers. The characteristic residence times (lifetimes) of biological particles in the atmosphere can range from hours to weeks, depending on their sizes, aerodynamic, and hygroscopic properties.32 Our observation indicates that the initial exposure (<2–4 h) of proteins to O3 and NO2 mainly leads to the formation of protein dimers and trimers, and as the exposure proceeds, protein oligomers could be the dominant protein species, e.g., on the surface of bioaerosol particles.
3.2. Protein nitration
Fig. 3 and 4 show the effects of varying NO2 and O3 concentrations on the nitration of protein monomers and dimers in homogeneous bulk solution and coated-wall flow-tube experiments, respectively. Exposures were carried out at fixed NO2 concentrations with varying O3 concentrations and vice versa. The exposure time was varied from 0.5 up to 12 h. While in previous studies total protein nitration degrees (NDs) were investigated upon exposure to O3 and NO2,12,33 we explicitly explored and characterized the reaction kinetics of protein nitration, resolving the individual NDs of the protein monomer and its various oligomers over the course of reaction time. | ||
| Fig. 3 NDs of protein monomer and dimer (primary y-axis), and NTyr number per monomer and dimer (secondary y-axis) plotted against reaction time in the aqueous phase reaction of BSA with O3/NO2: (a) and (b) at a fixed NO2 concentration of 50 ppb with varied O3 concentrations, and (c) and (d) at a fixed O3 concentration of 50 ppb with varied NO2 concentrations. The data points and error bars represent the arithmetic mean values and standard deviations of duplicate experiments. The dashed lines are the results of the kinetic model. | ||
 | ||
| Fig. 4 NDs of protein monomer and dimer (primary y-axis), and NTyr number per monomer and dimer (secondary y-axis) plotted against exposure time upon the exposure of BSA films (thickness 34 nm) to various O3/NO2 concentrations: (a) and (b) at 45% RH, and (c) and (d) at 96% RH. The data points and error bars represent the arithmetic mean values and standard deviations of duplicate experiments. The dashed lines are the results of the kinetic model. | ||
The results of the bulk solution experiments on protein nitration are illustrated in Fig. 3. The maximum ND of protein monomers and dimers were found to be 7% and 5% after 12 h exposure to 200 ppb O3 and 50 ppb NO2, respectively. These results correspond to 1.4 NTyr residues per monomer molecule and 2 NTyr residues per dimer molecule (NTyr/monomer and NTyr/dimer are shown as secondary y-axes in Fig. 3 and 4). We found a positive relationship between the NDs and O3 concentration (Fig. 3a and b), particularly that the increase of O3 concentration by one order of magnitude from 5 to 50 ppb resulted in an increase of NDs from 4.2 ± 0.2% to 6.9 ± 0.2%, and 2.0 ± 0.3% to 4.5 ± 0.3% after 12 h exposure for the monomer and dimer, respectively. Also, for protein nitration, no significant difference was found when concentrations of NO2 were varied from 5 to 200 ppb at a fixed O3 concentration of 50 ppb, as shown in Fig. 3c and d. These results are in accordance with the observations made by Shiraiwa et al.23 on the study of the reactive uptake of NO2 by aerosolized proteins. They found that the uptake coefficient of NO2 (γNO2) increased with increasing O3 concentrations while γNO2 decreased gradually with increasing NO2 concentration. Thus, our results confirm that the protein reaction with O3 and formation of ROI is the rate-limiting step for protein nitration.21,23 Shiraiwa et al.23 have excluded NO3 or N2O5 (formed through NO2 oxidation by O3) as major contributors to protein nitration. Ghiani et al.34 reported that nitration of proteins can also occur by nitrate ions in bulk solutions without UV irradiation under acidic conditions (pH < 3 for BSA). The reaction of NO2 with water can form nitric acid and thereby nitrate ions might appear in the BSA solution. However, we found that the pH of the BSA solutions stayed relatively constant (pH 6.6 ± 0.2; pH meter model WTW multi 350i) for a reaction time of 12 h at 200 ppb NO2 and 50 ppb O3, indicating that nitration induced by nitrate ions is likely a minor or negligible pathway in this study. This hypothesis is consistent with the results in Fig. 3c and d that show only a slight increase in ND (monomer, 6.3 ± 0.3% to 6.9 ± 0.2%, and dimer, 4.0 ± 0.3% to 4.5 ± 0.3%, for 12 h reaction) for a one order of magnitude increase in the NO2 concentration from 5 to 50 ppb.
The results of the temporal increase of NDs of monomer and dimer for reactions of the thin protein films with O3 and NO2 concentrations of 50 and 200 ppb at 45% and 96% RH are illustrated in Fig. 4. Here, the NDs for monomer and dimer at 45% RH were found to be around 1% and 0.8% for 12 h exposure, corresponding to 0.2 NTyr/monomer molecule and 0.3 NTyr/dimer molecule. Note that the protein coating consisted of ∼5 layers. Therefore, the results likely indicate that on average one Tyr per BSA monomer molecule located on the surface of the protein film was efficiently nitrated, while the bulk nitration occurred at much slower rates. This highly reactive site could be the Tyr residue at position 161 (Y161), as suggested by Zhang et al.35 The maximum NDs for monomer and dimer reached up to 2.5 ± 0.1% and 2.0 ± 0.1% at 96% RH, respectively. However, both of the maximum NDs at 45% and 96% RH were much lower than those obtained for O3/NO2 exposure in aqueous solutions (200 ppb O3 and 50 ppb NO2). This discrepancy can be explained by a decrease in viscosity and an increase in diffusivity on going from an amorphous solid (45% RH) or semisolid (96% RH) protein on a coated wall to an aqueous protein solution and was able to be reproduced using a model (see below).36,37 Furthermore, the NDs of BSA in this study are comparable to those found by Yang et al.33 using the same protein, whereas the nitration efficiency of BSA in general is found to be much lower than the one observed for the major birch pollen allergen Bet v 1 in similar exposure experiments,12 indicating a strong influence of molecular structure and potentially the amino acid sequence of the reacting protein. From previous mass spectrometric analysis of the site selectivity of protein nitration by O3/NO2, it is known that only 3 out of 21 Tyr residues in BSA can be detected in the nitrated form, while in Bet v 1, 4 out of 7 Tyr residues can be nitrated.12,35 Thus, besides the types of nitrating agents (e.g. ONOO− or O3/NO2) and reaction conditions (in aqueous solution or heterogeneous exposure), the nitration efficiency also depends on the fraction of reactive Tyr residues in the investigated protein.
3.3. Kinetics and mechanism of protein nitration and oligomerization by O3/NO2
The model results for the reactions of proteins with O3/NO2 under the various exposure conditions are shown as the dashed lines in Fig. 1–4. A chemical mechanism involving 19 reactions (see Table S1† for details) was applied in two kinetic models, i.e., a box model for bulk solution experiments and a kinetic multilayer model for aerosol surface and bulk chemistry (KM-SUB)26 for flow tube experiments to fit the experimental data. The most relevant reactions for this mechanism are illustrated in Fig. 5. The first step in the mechanism is the reaction of a Tyr residue with O3 forming tyrosyl radicals as long-lived reactive oxygen intermediates (ROIs). In the second step of the process, the ROIs can react with each other to form dimers, or with NO2 to form nitrated monomers. Note that for simplification, each molecule only contains one reactive tyrosine residue, while nitrated and oxidized monomers, dimers and trimers are unable to take part in further reactions in the kinetic model. A dimer can react further with O3 to form a dimeric ROI, which may react with NO2 to form a nitrated protein dimer, with monomeric ROI to form a protein trimer or with another dimeric ROI to form a protein tetramer. | ||
| Fig. 5 Schematic overview of the most relevant reactions for protein nitration and oligomerization upon exposure to ozone and nitrogen dioxide. The reactions correspond to protein surface Tyr nitration and oligomerization in the mechanism presented in Table S1.† The molecular structure of the protein (BSA, PDB accession number 3V03) was created using RCSB PDB protein workshop (4.2.0) software. | ||
The following assumptions were made to enable modelling of the reaction system for bulk solution and coated-wall flow-tube experiments using the sets of physicochemical parameters shown in Table S1 (ESI†): BSA molecules have reactive amino acid residues on their surface (AA1) and in their bulk (AA2), both of them reactive towards O3. While ROIs formed in the protein bulk can only react with NO2 to form NTyr, they are unable to form intermolecular DTyr due to steric hindrance.38 These assumptions were also applied to dimers and trimers. Besides Tyr, O3 can also oxidize other amino acid residues, i.e., cysteine (Cys), tryptophan (Trp), methionine (Met) and histidine (His).31 Among them, only Cys is able to cross-link proteins directly upon O3 exposure, yielding intermolecular disulfide bridges, as one free Cys is available in BSA.39 This reversible cross-linking mechanism has been shown to be only a minor contributor to protein oligomerization upon O3/NO2 exposure previously.20 The kinetic parameters were obtained using a global optimization method combining a uniformly-sampled Monte Carlo search with a genetic algorithm (MCGA method).40,41 The genetic algorithm was terminated when the correlation between experimental data and model output reached an optimum. Concentrations of O3 and NO2 in the aqueous phase can be estimated using the published Henry’s law constant of Ksol,cc,O3 ≈ Ksol,cc,NO2 ≈ 10−2 M atm−1, which were used as fixed values in the model.30
The temporal evolution of NDs and oligomer mass fractions in aqueous solution is well reproduced by the model (Fig. 1 and 3). For the heterogeneous reactions studied in the coated-wall flow-tube experiments at 45% RH and 96% RH, some substantial deviations between modelled and measured data can be observed, and the coefficient of determination (R2 value) is approximately a factor of two lower than for the aqueous data. For example, the oligomer mass fractions ω at 45% RH in Fig. 2a–d are qualitatively captured fairly well, while the model fails to reproduce their evolution at higher RH, especially for the dimer and trimer (Fig. 2f and g). The observed reduction of dimers in flow tube experiments could be reproduced by the model including the reactions on the surface, where the rates are four orders of magnitude higher than that of bulk reactions. Despite simple model assumptions when describing the complex reaction system that was studied, the model reproduces the experimental data reasonably well with an overall R2 value of 0.88 for Fig. 1–4. Most of the optimized parameters obtained for the flow tube experiments were close to or the same as those for aqueous solutions (for details see Table S1, ESI†). However, note that some of the rate coefficients would be expected to change as the liquid water content and viscosity varies. Water could actively take part in some of the reactions and its presence at different concentrations could lead to changes in experimental conditions, such as pH, which would influence the rate of the reactions. As the viscosity increases it is also expected that some rate coefficients would decrease as they become diffusion-limited as per the Smoluchowski diffusion equation.42,43
The second-order rate coefficients obtained as model outputs and shown in Table S1† are mostly consistent with previous studies.20,23 However, as the complex reaction mixture has been reflected in only 19 chemical reactions, the absolute numbers of the rate coefficients obtained for the individual reactions likely do not reflect reality, because further secondary chemistry of various kinds is not included explicitly. It should also be noted that different types of tyrosine residues have not been explicitly included within the model, although these can nitrate at different rates and have different surface accessibilities.35,44 Nevertheless, qualitatively, the model results suggest that protein nitration occurs at faster rates than protein oligomerization. The observed and modelled preference of nitration over oligomerization can be rationalized by comparing the mass fraction of nitrated monomer (calculated by multiplying the mass fraction of monomer with NTyr/monomer) with the total oligomer mass fraction. Nitrated monomers were observed to have two times or higher mass fractions compared to all other oligomer mass fractions combined under all experimental conditions. This result indicates that Tyr nitration outcompetes the dimerization/oligomerization process.22,45
4. Implications and conclusions
In this study we investigated the kinetics and mechanism of the nitration and oligomerization of proteins induced by O3 and NO2 under different atmospherically relevant conditions. We showed the concentration and time dependence of the formation of dimers, trimers and higher protein oligomers as well as their individual nitration degrees. The temporal evolution of the concentrations of these multiple reaction products was well reproduced by a kinetic model with 19 chemical reactions. Protein nitration was found to be kinetically favored over protein oligomerization under the experimental conditions studied in this work. On the basis of the observation that nitrated oligomers formed upon exposure to O3/NO2, we suggest further investigation on the allergenic and immunogenic effects by nitrated protein oligomers. The nitrated oligomers were also found in the physiologically-relevant peroxynitrite-induced protein nitration and oligomerization,46 for which the mechanism is similar to the one we reported here.25,47The implications of protein chemistry with O3 and NO2 under atmospherically relevant conditions are illustrated in Fig. 6. The overall nitration and oligomerization rates were both almost one order of magnitude higher in the aqueous phase than for 45% RH, indicating an increased relevance of the processes under cloud-processing conditions. Also, the yields of protein nitration and oligomerization can be strongly influenced by changes in relative humidity leading to changes of phase states. The protein dimers can yield up to 20% (by mass) for 12 h exposure in the liquid phase and the NDs of monomers and dimers can be up to 7% and 5%, respectively. This result indicates that on average, 1.4 Tyr residues in each monomeric protein molecule and 2 Tyr residues in each dimeric molecule are present in their nitrated forms. For proteins in solid or semi-solid phase states, our measurement and model results suggest that higher protein oligomers are likely to be found at lower RH, e.g., on the surface of bioaerosols, whereas the NDs of monomers and dimers remain at ∼1–2%. Using ab initio calculations, Sandhiya et al.22 also showed that increased temperature can speed up the formation of tyrosyl radicals by ozonolysis. Thus, it is expected that nitrated and dimeric protein species could be important products of exposure to O3 and NO2 under tropical or summer smog conditions. These differences in reaction kinetics should be taken into account in studies on the physiological effects of proteins exposed to anthropogenic air pollutants, as the allergenic proteins in various oligomerization and nitration states might have a different immunogenic potential.
 | ||
| Fig. 6 Atmospheric protein chemistry by ozone (O3) and nitrogen dioxide (NO2). Reaction rates are limited by the phase state of proteins and hence the diffusivity of oxidants and protein molecules, which changes with relative humidity (RH) and temperature (T). Air pollutants such as NO2 and O3 can enhance allergen release from bioaerosols (e.g., pollen) with O3 being more important in triggering the nitration, cross-linking and oxidation of allergenic proteins in bioaerosols and other protein-containing particles (e.g., Bet v 1 on urban road dust15). | ||
Both increasing levels of O3 and NO2 are able to damage pollen grains and facilitate the release of allergens in polluted environments.3,8,9 However, our results show that the tyrosine nitration and cross-linking of proteins are sensitive towards an increase in O3 concentration and rather insensitive towards changes in ambient NO2 concentrations. Therefore, effective control of the enhanced allergenicity induced by air pollutant-modified aeroallergens should point towards the decrease of ambient ozone concentrations.
Acknowledgements
F. L. and S. L. acknowledge financial support from the China Scholarship Council (CSC). C. J. K. and T. B. acknowledge support by the Max Planck Graduate Center with the Johannes Gutenberg University Mainz (MPGC). C. J. K. acknowledges financial support by the German Research Foundation (DFG; grant no. KA 4008/1-2).Notes and references
- M. I. Asher, S. Montefort, B. Björkstén, C. K. Lai, D. P. Strachan, S. K. Weiland, H. Williams and I. P. T. S. Group, Lancet, 2006, 368, 733–743 CrossRef.
- R. Pawankar, C. E. Baena-Cagnani, J. Bousquet, G. W. Canonica, A. A. Cruz, M. A. Kaliner and B. Q. Lanier, World Allergy Organ. J., 2008, 1, S4–S17 Search PubMed.
- U. Frank and D. Ernst, Front. Plant Sci., 2016, 7, 91 Search PubMed.
- K.-H. Kim, S. A. Jahan and E. Kabir, Environ. Int., 2013, 59, 41–52 CrossRef CAS PubMed.
- U. Pöschl and M. Shiraiwa, Chem. Rev., 2015, 115, 4440–4475 CrossRef PubMed.
- K. Reinmuth-Selzle, C. J. Kampf, K. Lucas, N. Lang-Yona, J. Fröhlich-Nowoisky, M. Shiraiwa, P. S. J. Lakey, S. Lai, F. Liu, A. T. Kunert, K. Ziegler, F. Shen, R. Sgarbanti, B. Weber, M. G. Weller, I. Bellinghausen, J. Saloga, A. Duschl, D. Schuppan and U. Pöschl, Environ. Sci. Technol., 2017, 51, 4119–4141 CrossRef CAS PubMed.
- D. Diaz-Sanchez, M. P. Garcia, M. Wang, M. Jyrala and A. Saxon, J. Allergy Clin. Immunol., 1999, 104, 1183–1188 CrossRef CAS PubMed.
- I. Beck, S. Jochner, S. Gilles, M. McIntyre, J. T. Buters, C. Schmidt-Weber, H. Behrendt, J. Ring, A. Menzel and C. Traidl-Hoffmann, PLoS One, 2013, 8, e80147 Search PubMed.
- Y. Ouyang, Z. Xu, E. Fan, Y. Li and L. Zhang, Int. Forum. Allergy Rhinol., 2016, 6, 95–100 CrossRef PubMed.
- C. Ackaert, S. Kofler, J. Horejs-Hoeck, N. Zulehner, C. Asam, S. von Grafenstein, J. E. Fuchs, P. Briza, K. R. Liedl and B. Bohle, PLoS one, 2014, 9, e104520 Search PubMed.
- N. Lang-Yona, T. Shuster-Meiseles, Y. Mazar, O. Yarden and Y. Rudich, Sci. Total Environ., 2016, 541, 365–371 CrossRef CAS PubMed.
- K. Reinmuth-Selzle, C. Ackaert, C. J. Kampf, M. Samonig, M. Shiraiwa, S. Kofler, H. Yang, G. Gadermaier, H. Brandstetter and C. G. Huber, J. Proteome Res., 2014, 13, 1570–1577 CrossRef CAS PubMed.
- A. D. Estillore, J. V. Trueblood and V. H. Grassian, Chem. Sci., 2016, 7, 6604–6616 RSC.
- J. Fröhlich-Nowoisky, C. J. Kampf, B. Weber, J. A. Huffman, C. Pöhlker, M. O. Andreae, N. Lang-Yona, S. M. Burrows, S. S. Gunthe, W. Elbert, H. Su, P. Hoor, E. Thines, T. Hoffmann, V. R. Després and U. Pöschl, Atmos. Res., 2016, 182, 346–376 CrossRef.
- T. Franze, M. G. Weller, R. Niessner and U. Pöschl, Environ. Sci. Technol., 2005, 39, 1673–1678 CrossRef CAS PubMed.
- J. T. Buters, A. Kasche, I. Weichenmeier, W. Schober, S. Klaus, C. Traidl-Hoffmann, A. Menzel, J. Huss-Marp, U. Krämer and H. Behrendt, Int. Arch. Allergy Immunol., 2007, 145, 122–130 CrossRef PubMed.
- F. Liu, S. Lai, K. Reinmuth-Selzle, J. F. Scheel, J. Fröhlich-Nowoisky, V. R. Després, T. Hoffmann, U. Pöschl and C. J. Kampf, Anal. Bioanal. Chem., 2016, 408, 6337–6348 CrossRef CAS PubMed.
- P. Taylor, R. Flagan, A. Miguel, R. Valenta and M. Glovsky, Clin. Exp. Allergy, 2004, 34, 1591–1596 CrossRef CAS PubMed.
- G. F. Schäppi, P. E. Taylor, I. A. Staff, C. Suphioglu and R. B. Knox, Sex. Plant Reprod., 1997, 10, 315–323 CrossRef.
- C. J. Kampf, F. Liu, K. Reinmuth-Selzle, T. Berkemeier, H. Meusel, M. Shiraiwa and U. Pöschl, Environ. Sci. Technol., 2015, 49, 10859–10866 CrossRef CAS PubMed.
- M. Shiraiwa, Y. Sosedova, A. Rouvière, H. Yang, Y. Zhang, J. P. Abbatt, M. Ammann and U. Pöschl, Nat. Chem., 2011, 3, 291–295 CrossRef CAS PubMed.
- L. Sandhiya, P. Kolandaivel and K. Senthilkumar, J. Phys. Chem. B, 2014, 118, 3479–3490 CrossRef CAS PubMed.
- M. Shiraiwa, K. Selzle, H. Yang, Y. Sosedova, M. Ammann and U. Pöschl, Environ. Sci. Technol., 2012, 46, 6672–6680 CrossRef CAS PubMed.
- M. Shiraiwa, K. Selzle and U. Pöschl, Free Radical Res., 2012, 46, 927–939 CrossRef CAS PubMed.
- S. Pfeiffer, K. Schmidt and B. Mayer, J. Biol. Chem., 2000, 275, 6346–6352 CrossRef CAS PubMed.
- M. Shiraiwa, C. Pfrang and U. Pöschl, Atmos. Chem. Phys., 2010, 10, 3673–3691 CrossRef CAS.
- G. Li, H. Su, X. Li, U. Kuhn, H. Meusel, T. Hoffmann, M. Ammann, U. Pöschl, M. Shao and Y. Cheng, Atmos. Chem. Phys., 2016, 16, 10299–10311 CAS.
- F. Liu, K. Reinmuth-Selzle, S. Lai, M. G. Weller, U. Pöschl and C. J. Kampf, J. Chromatogr. A, 2017, 1495, 76–82 CrossRef CAS PubMed.
- S. L. Ellison, M. Rosslein and A. Williams, in Quantifying uncertainty in analytical measurement, Eurachem, 2000 Search PubMed.
- R. Sander, Atmos. Chem. Phys., 2015, 15, 4399–4981 CAS.
- V. K. Sharma and N. J. Graham, Ozone: Sci. Eng., 2010, 32, 81–90 CrossRef CAS.
- V. R. Després, J. A. Huffman, S. M. Burrows, C. Hoose, A. S. Safatov, G. Buryak, J. Fröhlich-Nowoisky, W. Elbert, M. O. Andreae, U. Pöschl and R. Jaenicke, Tellus, Ser. B, 2012, 64, 1–58 CrossRef.
- H. Yang, Y. Zhang and U. Pöschl, Anal. Bioanal. Chem., 2010, 397, 879–886 CrossRef CAS PubMed.
- A. Ghiani, M. Bruschi, S. Citterio, E. Bolzacchini, L. Ferrero, G. Sangiorgi, R. Asero and M. G. Perrone, Sci. Total Environ., 2016, 573, 1589–1597 CrossRef CAS PubMed.
- Y. Zhang, H. Yang and U. Pöschl, Anal. Bioanal. Chem., 2011, 399, 459–471 CrossRef CAS PubMed.
- M. Shiraiwa, M. Ammann, T. Koop and U. Pöschl, Proc. Natl. Acad. Sci. U. S. A., 2011, 108, 11003–11008 CrossRef CAS PubMed.
- E. Mikhailov, S. Vlasenko, S. Martin, T. Koop and U. Pöschl, Atmos. Chem. Phys., 2009, 9, 9491–9522 CrossRef CAS.
- W. H. Heijnis, H. L. Dekker, L. J. de Koning, P. A. Wierenga, A. H. Westphal, C. G. de Koster, H. Gruppen and W. J. van Berkel, J. Agric. Food Chem., 2010, 59, 444–449 CrossRef PubMed.
- T. Ueki, Y. Hiragi, M. Kataoka, Y. Inoko, Y. Amemiya, Y. Izumi, H. Tagawa and Y. Muroga, Biophys. Chem., 1985, 23, 115–124 CrossRef CAS PubMed.
- T. Berkemeier, S. S. Steimer, U. K. Krieger, T. Peter, U. Pöschl, M. Ammann and M. Shiraiwa, Phys. Chem. Chem. Phys., 2016, 18, 12662–12674 RSC.
- A. M. Arangio, J. H. Slade, T. Berkemeier, U. Pöschl, D. A. Knopf and M. Shiraiwa, J. Phys. Chem. A, 2015, 119, 4533–4544 CrossRef CAS PubMed.
- W. Scheider, J. Phys. Chem., 1972, 76, 349–361 CrossRef CAS.
- L. J. Lapidus, W. A. Eaton and J. Hofrichter, Proc. Natl. Acad. Sci. U. S. A., 2000, 97, 7220–7225 CrossRef CAS.
- B. Petersen, T. N. Petersen, P. Andersen, M. Nielsen and C. Lundegaard, BMC Struct. Biol., 2009, 9, 1 CrossRef PubMed.
- J. M. Souza, G. Peluffo and R. Radi, Free Radical Biol. Med., 2008, 45, 357–366 CrossRef CAS PubMed.
- Y. J. Zhang, Y. F. Xu, X. Q. Chen, X. C. Wang and J.-Z. Wang, FEBS Lett., 2005, 579, 2421–2427 CrossRef CAS PubMed.
- R. Radi, Proc. Natl. Acad. Sci. U. S. A., 2004, 101, 4003–4008 CrossRef CAS PubMed.
Footnote |
| † Electronic supplementary information (ESI) available: Chemical mechanism and corresponding parameters used in kinetic modelling (Table S1), schematic experimental setup (Fig. S1), and SEC calibration curve (Fig. S2). See DOI: 10.1039/c7fd00005g |
| This journal is © The Royal Society of Chemistry 2017 |