 Open Access Article
Ferric carbide nanocrystals encapsulated in nitrogen-doped carbon nanotubes as an outstanding environmental catalyst†
Chen
Wang
a,
Jian
Kang
a,
Ping
Liang
a,
Huayang
Zhang
a,
Hongqi
Sun
 *b,
Moses O.
Tadé
a and
Shaobin
Wang
*a
aDepartment of Chemical Engineering and CRC for Contamination Assessment and Remediation of the Environment (CRC CARE), Curtin University, GPO Box U1987, Western Australia, Australia. E-mail: shaobin.wang@curtin.edu.au
bSchool of Engineering, Edith Cowan University, 270 Joondalup Drive, Joondalup, WA 6027, Australia. E-mail: h.sun@ecu.edu.au
First published on 10th November 2016
Abstract
Nitrogen-doped carbon nanotubes encapsulating iron carbide (Fe3C) nanocrystals (Fe3C@NCNT) were fabricated by a simple and direct pyrolysis method using melamine and ferric chloride as the C, N and Fe precursors. The surface morphology, structure and composition of the Fe3C@NCNT materials were thoroughly investigated. The nanomaterials were employed as novel catalysts for peroxymonosulfate (PMS) activation; outstanding efficiency, high stability and excellent reusability were observed in the catalytic oxidation of organics. The encapsulated Fe3C nanoparticles played a key role in the emerging synergetic effects of the carbide and the protective graphitic layers. In addition, the quaternary N and trace amounts of iron on the CNT surface acted as the active sites. Various quenching experiments were carried out to elucidate the catalytic mechanism of Fe3C@NCNT. It was found that singlet oxygen, superoxide, sulfate and hydroxyl radicals worked together to degrade phenol solutions. Due to their simple synthesis method, low-cost precursors, unique structure and excellent catalytic activity and stability, these novel iron-carbide-based composites have great potential as new strategic materials for environmental catalysis.
Environmental significanceEnvironmental contaminants caused by industrialization and urbanization, such as phenolics, are currently of great public concern because of their toxicity and resistance to natural degradation. Most homogeneous and heterogeneous catalytic processes are based on either noble, transition, or rare-earth metals or their oxides. A series of problems, such as scarcity, high cost and secondary pollution, have limited the wide applications of these catalysts. Therefore, novel carbon-based metal or metal-free catalysts that demonstrate both good catalytic performance and excellent stability are highly desirable. In this paper, nitrogen-doped carbon nanotubes with encapsulated iron carbide nanocrystals (Fe3C@NCNT) were synthesized by simple and direct pyrolysis of melamine and ferric chloride. SEM and TEM revealed peapod-like structures with Fe3C nanocrystals in the interior of the carbon nanotubes. Fe3C@NCNT-900 completely degraded phenol in only 20 min and demonstrated superior stability. It was proven that the doped N (mainly quaternary N), inner Fe3C, and trace amounts of Fe on the surface of the nanotubes were the active sites for catalytic performance. Different quenching experiments demonstrated that singlet oxygen, superoxide, sulfate and hydroxyl radicals worked together to degrade phenol solutions. This study opens a new avenue for the development of carbon-based metal catalysts and advances their application in wastewater remediation. |
Introduction
The 21st century has been called the Century of the Environment.1 Civilization and industrialization have resulted in the discharge of vast amounts of pollutants into water resources, with severe health and environmental implications.2–6 Advanced oxidation processes (AOPs) combined with other physical processes, such as adsorption, extraction and flocculation, have been effectively applied for complete removal of these organic contaminants in wastewater. Metal-based materials, such as Co and Mn oxides,7–10 are highly favorable to activate peroxymonosulfate (PMS) and produce sulfate radicals, thus facilitating emerging sulfate radical-based advanced oxidation processes (SR AOPs). However, these metal-based catalysts are subject to inevitable loss or leaching of metal ions in either homogeneous or heterogeneous reactions; thus, they cause secondary contamination.11–14 Therefore, much effort has been devoted to developing carbon-based catalysts (M–Nx/C, M = Co, Fe, Ni, etc.), metal-free carbon materials and N-doped carbon catalysts (NxC) as alternatives to metal oxide catalysts.15–17 Among these, M–Nx/C catalysts have emerged as superior candidates; their active sites are believed to arise from surface nitrogen coordinated with metals.15,18 Although they have been extensively studied, these materials still suffer from either low catalytic activity or poor stability.6,8,11,19,20 Therefore, it is very challenging to develop novel catalysts with high activity, good stability, low cost and environmental friendliness.Fe-based materials are regarded as one of the most promising heterogeneous catalysts because Fe can be easily incorporated into carbon frameworks by pyrolyzing ferric salt in an inert atmosphere and can catalyze the graphitization process at lower temperatures.21,22 In addition, metal-based catalysts coated by a protective shell or matrix have been proven to have enhanced catalytic performance and stability. Recently, novel and efficient metal/metal carbide nanoparticles encapsulated in nanostructured carbon were developed; their active sites are believed to be the graphitic carbon shells activated by the encapsulated nanoparticles.23,24 An interesting magnetic carbon-encapsulated nano Fe0/Fe3C catalyst was synthesized by Wang et al.25via in situ hydrothermal carbonization of glucose with melamine accompanied by self-reduction in N2 atmosphere. Its excellent catalytic performance was evidenced by the complete removal of 20 ppm phenol within 10 min. They found that the presence of Fe3C was conducive to the stability of the catalyst. In addition, Li et al.24 discovered a novel catalyst consisting of iron carbide nanoparticles encapsulated by graphitic layers and applied it to the oxygen reduction reaction (ORR). Bao et al.23 prepared peapod-like carbon nanotubes with encapsulated Fe nanoparticles and used the materials as ORR catalysts in acid media. Peng et al.26 synthesized nitrogen-doped carbon nanotubes with encapsulated Fe3C nanoparticles that showed good ORR nature in both acid and alkaline media. Yao et al.27 fabricated magnetic metal (M = Fe, Co, Ni) nanocrystals encapsulated in nitrogen-doped carbon nanotubes using dicyandiamide as a C/N precursor; these exhibited varying activities toward Fenton-like reactions. These findings are notable because the Fe3C/Fe particles could ‘etch’ into the CNTs in situ, and the resulting iron species encapsulated inside CNTs or graphene are particularly active for selective hydrogenation28 and the oxygen reduction reaction.29,30 These important achievements inspired us to explore a new strategy for the controlled synthesis of novel carbon-supported iron-based catalysts for PMS activation with both high catalytic activity and excellent stability.
Carbon-based materials, such as carbon nanotubes (CNTs), have been extensively studied in both fundamental research and practical applications because of their unique physico-chemical properties. Heteroatom doping with nitrogen or metals can further tune and improve the capabilities of CNTs.31 Melamine, a green and cheap chemical with 67 wt% N content, has been employed as both a carburization reagent and nitridation reagent.32,33 Nallathambi et al. reported that the performance of Fe catalyst prepared from melamine was far superior to those of bipyridine, pyrazine and purine with the same N loading.34 Single-walled NCNTs were synthesized by Duan et al. via the pyrolysis of commercial SWCNTs and melamine; these showed extraordinarily high catalytic activity for PMS activation.35 However, a simple, low-cost, safe and scalable synthesis method of CNTs for the widespread and sustainable use of carbon materials on a large scale has been difficult to achieve.28
Generally, N-doped CNTs can be prepared through post-treatment of CNTs with ammonia, urea, or pyridine. However, there are few studies of the direct synthesis of N-doped CNTs from direct thermal carbonization of nitrogen-containing polymer precursors, such as polyacrylonitrile, polyaniline, polypyrrole, and melamine resin.36,37 The in situ approach provides several advantages, such as an increase of the doping level and a uniform distribution of heteroatoms on CNTs, for improving catalytic activity. Furthermore, it has been concluded that encapsulation of metal nanocrystals into N-doped CNTs to form a hybrid structure is an effective strategy to enhance overall catalytic activity.38,39
Herein, we report a new, facile one-pot strategy for the controlled synthesis of N-doped carbon nanotubes with encapsulated Fe3C through the direct pyrolysis of a mixture of melamine and iron chloride. Fe3C and CNTs were formed in situ during pyrolysis. Their morphologies, compositions, active sites and mechanisms of catalytic degradation were systematically investigated. In addition, electron paramagnetic resonance (EPR) and classical radical quenching tests were used to probe PMS activation and the mechanism of phenol oxidation. To our best knowledge, this is the first report of well-designed Fe3C-based CNTs composites with great potential for catalytic activity and good stability for PMS reactions.
Experimental
Materials and chemicals
Melamine (>99.0%), hexahydrate ferric chloride (FeCl3·6H2O, >99.9%), potassium peroxymonosulfate (2KHSO5·3KHSO4·K2SO4, oxone), sodium azide (NaN3), p-benzoquinone (PBQ), tert-butyl alcohol (TBA) and 5,5-dimethylpyrroline-oxide (DMPO, >99.0%) were purchased from Sigma-Aldrich. Phenol (>99.0%), acetone, ethanol and hydrochloric acid (32% to 37%) were obtained from Chem-Supply. High purity nitrogen gas (99.999%) was obtained from BOC. Ultrapure water was used in all of the experiments. All chemicals used herein were of analytic grade and were used as received without any further purification.Synthesis of Fe3C@NCNT
Fe3C@NCNT catalysts were fabricated via a facile thermal process using melamine as a C/N precursor.6,26,40 In a typical procedure, 6 g melamine and 6 g FeCl3·6H2O were dissolved in 10 mL ethanol in a crucible with continuous stirring to form a clear yellow solution. The resulting solution was then placed in an oven at 80 °C in air for around 48 h to afford a tawny solid. The dried powder was transferred to a quartz tube furnace to respectively anneal at 700 °C, 800 °C, or 900 °C for 6 h under a nitrogen flow of 50 mL min−1. After cooling to room temperature, the as-obtained material was treated with 100 mL hydrochloric acid (32 to 37 wt%) with magnetic stirring for 6 h to remove any accessible iron species. The sample was then washed successively with ultrapure water and acetone and dried at 60 °C for 24 h to obtain the final material, named Fe3C@NCNT-X (X indicates the pyrolysis temperature). The obtained products were magnetic powders (ESI,† Fig. S1). A schematic of the synthesis route of the Fe3C@NCNT catalysts is illustrated in Fig. 1(a).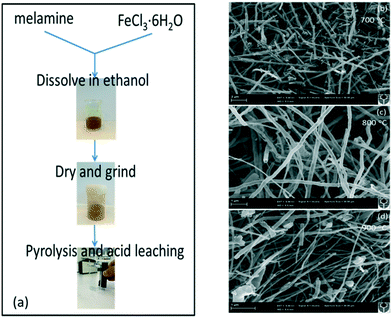 | ||
| Fig. 1 (a) Schematic of the synthesis route of Fe3C@NCNT. SEM images of the Fe3C@NCNT catalysts at (b) 700 °C, (c) 800 °C and (d) 900 °C. | ||
Characterization of materials
X-ray diffraction (XRD) patterns were acquired on a Bruker D8-Advanced X-ray instrument using Cu-Kα radiation with λ at 1.5418 Å. Scanning electron microscopy (SEM) was applied to investigate the morphologies of the catalysts using a Zeiss Neon 40 EsB FIBSEM. Nitrogen sorption isotherms were acquired on a Tristar II 3020 instrument after degassing the samples for 4 h at 100 °C. The specific surface area and pore size distribution were evaluated by the Brunauer–Emmett–Teller (BET) equation and the Barrett–Joyner–Halenda (BJH) method, respectively. The chemical compositions and states of the catalysts were determined by X-ray photoelectron spectroscopy (XPS), which was carried out on a Thermo Escalab 250 instrument with Al-Kα X-rays. A Perkin-Elmer Diamond TGA/DTA thermal analyzer was utilized to perform thermogravimetric-differential thermal analysis (TG-DTA) via heating the samples in an air flow of 100 mL min−1 at a heating rate of 10 °C min−1. Raman analysis was performed using an ISA dispersive Raman spectrometer with an argon ion laser (514 nm). The detection of iron ions after phenol degradation was performed on an Optima 8300 ICP-OES spectrometer (PerkinElmer). The samples were also subjected to ultimate analysis using an elemental analyzer (Perkin-Elmer 2400 SeriesIImodel).Catalytic oxidation of phenol solutions
The catalytic oxidation was carried out in a 250 mL conical flask with phenol solution (20 ppm, 150 mL), the catalyst (0.2 g L−1) and PMS (2.0 g L−1) in a constant-temperature (25 °C) controlled water bath for the kinetic studies. During each interval, 1 mL phenol solution was withdrawn with a syringe, filtered with a 0.45 μm Millipore film, and injected into a vial in which 0.5 mL of methanol as a quenching reagent had been previously injected. The mixed solution was analyzed using a high performance liquid chromatograph (HPLC, Varian) with a C-18 column and a UV detector set at 270 nm. After each run, the used catalyst was collected by ultrasonic washing for 5 min, washed three times with ultrapure water, filtered and dried in an oven for reuse.Mechanistic studies of the catalytic processes
An EMS-plus EPR instrument from Bruker was employed to detect the free radicals captured by 5,5-dimethyl-1-pyrroline (DMPO, >99.0%) during PMS activation, operating under the following conditions: centre field, 3515 G; sweep width, 100 G; microwave frequency, 9.87 GHz; power setting, 18.75 mW; scan number, 3. Quantitative information regarding the radicals was acquired using the SpinFit software in the Bruker Xenon Software Package.Results and discussion
Characterization of Fe3C@NCNT
The morphologies and structures of as-prepared Fe3C@NCNT-700, Fe3C@NCNT-800 and Fe3C@NCNT-900 are shown in Fig. 1b–d and Fig. S2 (ESI†). The characteristic morphologies of all the catalysts were dimensionally uniform and orderly arranged nanotubes with diameters of 200 to 300 nm for Fe3C@NCNT-700 and Fe3C@NCNT-800 but only 50 to 100 nm for Fe3C@NCNT-900.26,28 However, CNTs with nonuniform sizes with significant agglomeration were formed above 900 °C, which may be attributed to the breakdown of the CNTs and decomposition of Fe3C at higher temperatures.As revealed by transmission electron microscopy (TEM) images (Fig. 2), a large portion of pea-pod dark nanocrystals (identified as iron carbide by the XRD diffraction patterns, Fig. 3) were mainly encapsulated inside the channels or at the tips of the carbon nanotubes (sized 40 to 50 nm for Fe3C@NCNT-700 and Fe3C@NCNT-900 and 80 to 100 nm for Fe3C@NCNT-800). HRTEM images of the Fe3C nanoparticles in CNTs show that most of the surfaces of the Fe3C nanoparticles were coated with multi-layered graphene. For a typical nanoparticle, the spacing of crystalline lattices in one direction was 0.31 nm, corresponding to the (111) crystal plane of Fe3C phase. The interlayer spacing of the coating graphene layer was 0.335 nm, in accordance with the experimental results for free-standing few-layer graphene.26 Because of the protection of the graphitic layers, the Fe3C nanocrystals were inaccessible and chemically stable in hot acids, implying that geometric confinement of Fe3C@NCNT was successfully achieved.26–28,41Structure control is a continually difficult task for catalysts and materials prepared by pyrolysis. This is especially true for the synthesis and preparation of Fe3C-based catalysts by pyrolysis. As far as we know, there are few reports of Fe3C with uniform morphology and evenly dispersed nanoparticles.
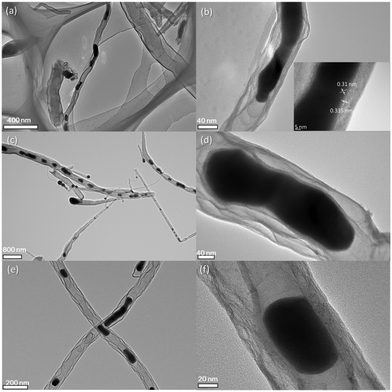 | ||
| Fig. 2 TEM images of the Fe3C@NCNT catalysts at 700 °C (a), (b), 800 °C (c), (d) and 900 °C (e), (f). | ||
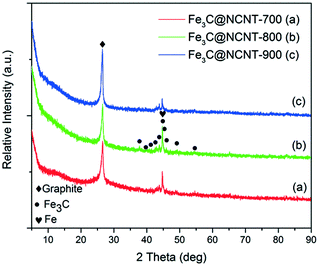
X-ray diffraction (XRD) patterns of Fe3C@NCNT obtained at different pyrolysis temperatures are shown in Fig. 3. The diffraction peaks at 26.5° and 43.4° were observed at different calcined temperatures, corresponding to the (002) and (101) planes of graphitic carbon, respectively.6 The diffraction peaks were very sharp and the intensity of the diffraction peak at 26.5° increased with pyrolysis temperature, indicating that the degree of graphitization of Fe3C@NCNT was very good and was also strongly dependent on the pyrolysis temperature. In addition to this reflection, other diffraction peaks at 37 to 50° were the typical diffraction peaks of Fe3C; these could not be found in NG6 and were the major difference between Fe3C@NCNT and NG. Diffraction peaks located at 37.8, 42.8, 43.9, 45.0, 45.8 and 49.2° were detected in Fe3C@NCNT; these can be assigned to the (021), (121), (210), (103), (211) and (113) crystalline planes of Fe3C particles, respectively.42 This confirmed that the nanoparticles encapsulated in the interior of the nanotubes observed by TEM were dominantly Fe3C when the temperature was above 700 °C. These diffraction peaks were the highest and strongest in Fe3C@NCNT-800. In addition, all the samples may contain traces of metallic iron, as it has the same characteristic peak as Fe3C at a 2θ of 44.6°.26,33 The XRD results further confirmed that the Fe3C nanoparticles were encapsulated in graphitic layers which could not be removed in hot acid solution and were well preserved after the leaching process.
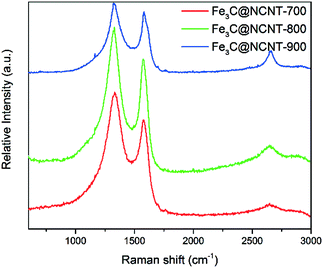
The degree of graphitization of the Fe3C@NCNT samples was further investigated by Raman spectra, and the results are shown in Fig. 4. The G band (at 1350 cm−1) shows the existence of sp2-hybridized carbon atoms, and the D band (at 1570 cm−1) provides evidence of defects such as disorders, edges and boundaries of the graphene.40ID/IG is the ratio of the integrated intensities of the D and G bands; this ratio decreased with increasing pyrolysis temperature. As can be seen from Fig. 4, the intensity ratios of the D- and G-bands (ID/IG) for Fe3C@NCNT-700, Fe3C@NCNT-800 and Fe3C@NCNT-900 were 1.20, 1.17 and 1.12, respectively, which demonstrates that the degree of graphitization increased with the pyrolysis temperature. An ordered graphitic structure can be formed easily at a higher temperature; however, if the pyrolysis temperature is too high, irregular carbon nanostructures can be formed. The reason for this is that Fe3C is temperature sensitive and metastable; at a higher temperature, it can break down into metallic Fe and free-C, which may enter the CNT framework and thus change its crystal structure.28
Fig. 5 displays the N2 adsorption–desorption isotherms and pore size distributions of the Fe3C@NCNT samples. The isotherms in Fig. 5(a) show that N2 adsorption increased with pyrolysis temperature; this is due to the higher surface areas and larger pore volumes at higher temperatures. All the samples exhibited typical IV isotherms with H3-type hysteresis loops. The hysteresis loops in P/P0 = 0.4 to 0.9 were indicative of the mesoporous structures of the Fe3C@NCNT composites.43
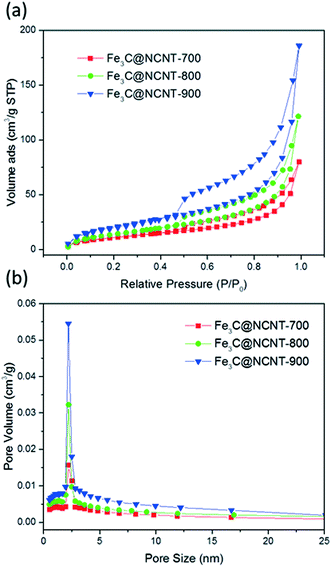 | ||
| Fig. 5 (a) Nitrogen sorption isotherms of the samples and (b) pore size distributions calculated from N2 desorption isotherms for Fe3C@NCNT-700, Fe3C@NCNT-800 and Fe3C@NCNT-900. | ||
The specific surface areas of Fe3C@NCNT-700, Fe3C@NCNT-800 and Fe3C@NCNT-900 were determined to be 40.1, 52.4 and 72.4 m2 g−1, respectively. Table 1 shows that the BET surface area and pore volume increased with increasing pyrolysis temperature; also, the pore size increased initially but then decreased, reaching its peak at 800 °C. The BET area increased; this indicates that high pyrolysis temperatures can break the CNTs into smaller pieces, thus resulting in the exposure of some Fe3C nanoparticles, which may further increase the number of active sites and enhance the catalytic performance.
| BET surface area, m2 g−1 | Pore volume, cm3 g−1 | Average pore size, nm | |
|---|---|---|---|
| Fe3C@NVNT-700 | 40.1 | 0.096 | 6.1 |
| Fe3C@NVNT-800 | 52.4 | 0.15 | 6.7 |
| Fe3C@NVNT-900 | 72.4 | 0.23 | 6.5 |
Fig. 5(b) shows that all of the Fe3C@NCNT composites presented a single mode of pore size. The pore sizes of Fe3C@NCNT-700, Fe3C@NCNT-800 and Fe3C@NCNT-900 were centred at 6.1, 6.7 and 6.5 nm, which demonstrated that the pyrolysis temperature exerted little effect on the pore size.44
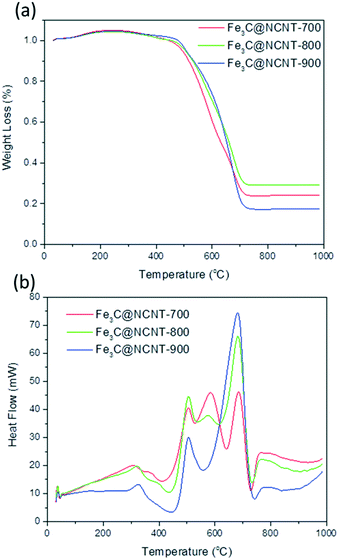
Fig. 6 shows the representative TGA and DTA curves of Fe3C@NCNT nanocomposites measured in air atmosphere from 25 to 1000 °C with a heating rate of 10 °C min−1. The combustion temperature was found to be in the order Fe3C@NCNT-700 < Fe3C@NCNT-800 < Fe3C@NCNT-900.
The TGA plots of Fe3C@NCNT composites showed a slight weight increase below 250 °C followed by a mild weight loss from 250 °C to 450 °C, which can be assigned to the removal and destruction of the labile oxygenated functional groups on the carbon surface, such as –OH and C![[double bond, length as m-dash]](https://www.rsc.org/images/entities/char_e001.gif) O in the forms of H2O, CO and CO2.45 Then, the weight decreased dramatically in the range from 450 °C to 700 °C, which was ascribed to the oxidation and decomposition of the CNTs and the oxidation and transformation of Fe3C into Fe2O3 between 360 °C and 550 °C. When the temperature reached 700 °C, the weight of the samples remained unchanged, and almost no weight loss occurred beyond this temperature. Stable weight percentages of 24.25%, 29.30% and 17.54% (represents the weight of residual iron oxide yielding iron contents of 16.98%, 20.51% and 12.27% by calculation) were achieved for Fe3C@NCNT-700, Fe3C@NCNT-800 and Fe3C@NCNT-900, respectively.46 It is known that the weight loss rate of CNTs filled with ferromagnetic species always decreases with increasing temperature because of the destruction of the tube walls that provide protection to the inner filled metal, which results in the formation of metal oxides. It is deduced that a point of inflection would exist in the TGA curve. However, the curves of the Fe3C@NCNT nanocomposites were relatively smooth, proving that the iron and iron carbide encapsulated inside the nanotubes were oxidized by air simultaneously with the tube walls.47
O in the forms of H2O, CO and CO2.45 Then, the weight decreased dramatically in the range from 450 °C to 700 °C, which was ascribed to the oxidation and decomposition of the CNTs and the oxidation and transformation of Fe3C into Fe2O3 between 360 °C and 550 °C. When the temperature reached 700 °C, the weight of the samples remained unchanged, and almost no weight loss occurred beyond this temperature. Stable weight percentages of 24.25%, 29.30% and 17.54% (represents the weight of residual iron oxide yielding iron contents of 16.98%, 20.51% and 12.27% by calculation) were achieved for Fe3C@NCNT-700, Fe3C@NCNT-800 and Fe3C@NCNT-900, respectively.46 It is known that the weight loss rate of CNTs filled with ferromagnetic species always decreases with increasing temperature because of the destruction of the tube walls that provide protection to the inner filled metal, which results in the formation of metal oxides. It is deduced that a point of inflection would exist in the TGA curve. However, the curves of the Fe3C@NCNT nanocomposites were relatively smooth, proving that the iron and iron carbide encapsulated inside the nanotubes were oxidized by air simultaneously with the tube walls.47
X-ray photoelectron spectra (XPS) studies were carried out to further investigate the nature of the surfaces of the Fe3C@NCNT composites. Fig. 7(a) reveals that the Fe3C@NCNT catalysts were composed of C, O, N, and Fe, and no impurity was observed. Although Fe was detected by ICP (Table S1†), TEM and XRD, the XPS spectra revealed low surface iron contents (<0.2%) on all the Fe3C@NCNT composites, implying complete leaching of surface iron species during the acid treatment. This further proves that the Fe3C nanoparticles were entirely encapsulated by carbon layers in the catalysts and can thus survive the catalytic process. However, at a high temperature, carbon nanotubes may partially break up and crack (as shown by SEM); thus, the interior Fe3C or Fe0 may run out of the tubes. As a result, the iron content as analyzed by XPS in Fe3C@NCNT-900 was the highest among all the catalysts.
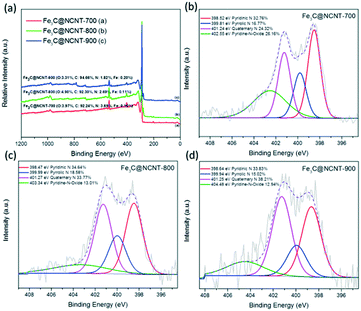 | ||
| Fig. 7 (a) XPS spectra of Fe3C@NCNT composites at different temperatures and HR XPS N 1s at (b) 700 °C, (c) 800 °C and (d) 900 °C. | ||
The total amount of surface N in the different catalysts was detected to be 3.69 at%, 2.69 at%, and 1.82 at% for Fe3C@NCNT-700, Fe3C@NCNT-800 and Fe3C@NCNT-900, respectively. Meanwhile, the total amount of N detected by elemental analysis is shown in Table S2.† The decrease in total N content with increasing pyrolysis temperature may be ascribed to the decomposition of unstable nitrogen species at a high temperature. The N 1s spectra were deconvoluted into four peaks, assigned to pyridinic N (398.5 to 398.8 eV), pyrrolic N (399.9 to 400.2 eV), quaternary N (401.4 to 401.6 eV) and pyridine-N-oxide (402 to 405 eV),48 as shown in Fig. 7(b)–(d). The content of quaternary N initially increased dramatically from 700 °C to 800 °C but then increased moderately from 800 °C to 900 °C. The content of pyridinic N demonstrated an inverse trend; it increased initially but then decreased with increasing pyrolysis temperature due to the loss of unstable N at higher temperatures. Pyridinic N is generally regarded to be connected with catalytic activity because it reduces the energy barrier for adsorbing reactants on adjacent carbon atoms and it accelerates first-electron transfer, which is limited by rate.49,50 However, recent research has suggested that quaternary N in the graphene structure can cause non-uniform distribution of electrons, especially when two quaternary N atoms are doped into the same hexagon, leading to a dramatic improvement in the catalytic activity of the carbon surface.28,51
Catalytic performance and active site analysis
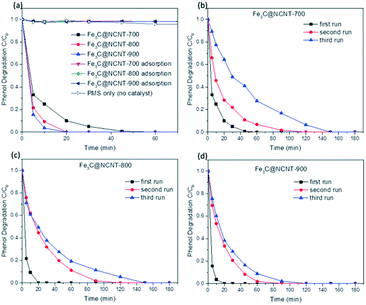
Control experiments were carried out to evaluate the adsorption, PMS self-oxidation and catalytic performance of Fe3C@NCNT composites. The phenol removal results under different conditions are shown in Fig. 8(a). In the presence of PMS without catalyst, a negligible change (less than 6%) in phenol concentration was observed after 180 min, indicating that significant phenol oxidation could not be induced by PMS itself. A similar trend was found in adsorption reactions with the Fe3C@NCNT catalysts. Less than 2% phenol was removed in 180 min, suggesting that phenol adsorption on the Fe3C@NCNT composites was also negligible.As shown in Fig. 8(a), Fe3C@NCNT-700, Fe3C@NCNT-800 and Fe3C@NCNT-900 can degrade 100% phenol in 45, 20 and 20 min, respectively. This efficiency is better than that of rGO,11 N-doped graphene6,52 and N-doped CNTs14,35 and is exceptionally better than some metal-based carbon materials,8,44,45 indicating that Fe3C provides the active sites to accelerate this reaction. Fe3C@NCNT-900 exhibited the best performance among all the Fe3C@NCNT catalysts, implying that Fe3C@NCNT-900, with wide CNTs that are open at both ends, was more accessible to enhance the phenol catalytic degradation reactions because the phenol molecules and Fe3C were in full contact in a relatively restricted area.28
It is known that the stability of a catalyst is of great importance to its practical applications.45 The stabilities and recyclabilities of the Fe3C@NCNT catalysts were evaluated by successive tests of phenol degradation under the same reaction conditions. For Fe3C@NCNT-700, 100% phenol was degraded within 45, 120, and 150 min for the first, second and third runs, respectively. For Fe3C@NCNT-800, phenol removal was completed in 20, 120, and 150 min, respectively; Fe3C@NCNT-900 required 20, 90, and 120 min, respectively. XRD patterns of Fe3C@NCNT after the first run are shown in Fig. S3.† As can be seen, compared with the fresh sample, diffraction peaks of Fe2O3 appeared, suggesting that some Fe0 was oxidized to Fe(III). Moreover, the peak intensity of Fe3C decreased slightly for the recycled catalyst from the 1st run, suggesting that in addition to the oxidized Fe0, some Fe3C was consumed during the catalytic reaction.25 Moreover, the intermediates formed from the oxidation processes may also block the active sites. Therefore, the results after the first, second and third runs were not as satisfactory as those of the fresh samples. The stability results were exceptionally better than those of N-doped graphene6,52,53 and N-doped CNT,14,35 implying that the inner stability of Fe3C after the first run may play a role in the enhanced stability of the catalyst. The stability of Fe3@NCNT-900 was relatively better because the carbon nanotubes and iron carbide were in close integration; the active sites decreased relatively little after three successive reactions, and the Fe3C in the third run was still sufficient to activate the surrounding graphitic layers, consequently activating the outer surface of the carbon layer.25
In the heterogeneous catalytic oxidation of phenol, reaction parameters such as catalyst loading and reaction temperature can affect the phenol degradation rate. The effect of catalyst loading on the phenol degradation efficiency is shown in Fig. 9(a). The catalyst concentration exerted a significant influence on the phenol degradation efficiency, which was dramatically enhanced with an increase in the catalyst concentration. When the catalyst concentration was 0.1 g L−1, 98% and 99% phenol were degraded in 180 min on Fe3C@NCNT-700 and Fe3C@NCNT-800, respectively, and 100% phenol was degraded in 120 min on Fe3C@NCNT-900. When the catalyst concentration was increased to 0.5 g L−1, phenol was completely removed after 30, 5 and 5 min on Fe3C@NCNT-700, Fe3C@NCNT-800 and Fe3C@NCNT-900, respectively. The improvement in efficiency was attributed to the increase in the active sites of the reaction in the phenol solution, which generated more active radicals.
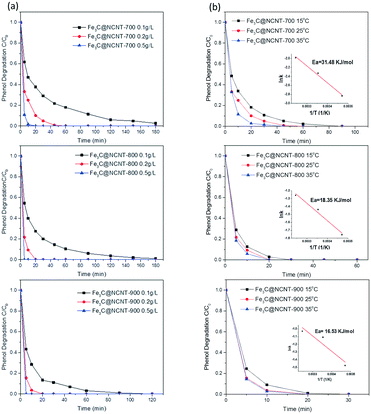 | ||
| Fig. 9 Effects of (a) catalyst loading and (b) reaction temperature on phenol degradation for different Fe3C@NCNT catalysts. Reaction conditions: phenol 20 ppm, PMS 2 g L−1. | ||
Fig. 9(b) shows the phenol degradation performance of the Fe3C@NCNT catalysts at different reaction temperatures. It can be seen that the reaction temperature moderately affected the oxidation efficiency and degradation rate for Fe3C@NCNT-700. However, for Fe3C@NCNT-800 and Fe3C@NCNT-900, the effect was relatively small. Specifically, at 15 °C, phenol degradation reached 100% in 90 min for Fe3C@NCNT-700, while the times decreased to 60 and 45 min when the reaction temperature was increased to 25 °C and 35 °C, respectively. The kinetics of phenol degradation was evaluated by the first-order kinetic model, as listed below:
| ln(C/C0) = −kt | (1) |
The reaction rate constants (k) of phenol oxidation at 25 °C on Fe3C@NCNT-700, Fe3C@NCNT-800 and Fe3C@NCNT-900 were then calculated to be 0.097, 0.237 and 0.330 min−1, respectively.
Based on first-order kinetics, the rate constants at varying temperatures were obtained, and the relationship was found to follow the Arrhenius equation. The activation energy was thus obtained as 31.5 kJ mol−1 for Fe3C@NCNT-700. For Fe3C@NCNT-800 and Fe3C@NCNT-900, the degradation time decreased from 30 min to 20 min when the temperature increased from 15 to 35 °C. Also, the activation energies were 18.3 and 16.5 kJ mol−1, respectively; these are much lower than the activation energies of N-doped graphene6 and N-doped CNT.35
The mechanism of phenol degradation on Fe3C@NCNT composites
The mechanisms of catalytic degradation of phenol on metal-based catalysts and carbon-based catalysts have recently been well investigated. Previous studies proved that these catalysts can activate PMS to produce sulfate and hydroxyl radicals.7,12,35,52,54 As shown in Fig. S4,† Fe3C@NCNT composites were able to effectively activate PMS to generate both ˙OH and SO4˙−. Different radical quenching reactions were also performed to probe the radicals produced in the Fe3C@NCNT composites and the contribution of the reactive species to phenol degradation. The reactions referring to the electron transfer processes facilitated by Fe3C@NCNT are shown below.| HSO5− + e− → ˙OH + SO42− | (2) |
| HSO5− + e− → ˙OH + SO4˙− | (3) |
| HSO5− + e− → H+ + SO5˙− | (4) |
| ˙OH + SO42− → SO4˙− + OH− | (5) |
| SO4˙− + OH− → SO42− + ˙OH | (6) |
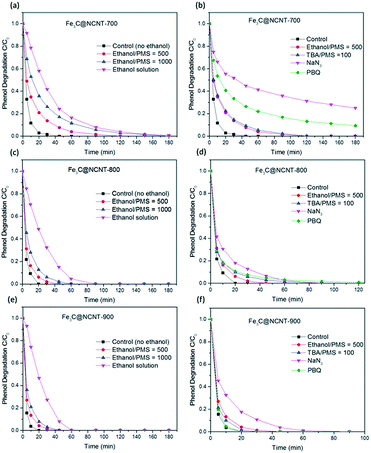
Owing to its rapid reaction with both ˙OH and SO4˙− radicals, ethanol was employed as an effective scavenger for both ˙OH and SO4˙− radicals in the catalytic phenol degradation reactions. In most AOPs, radicals are critical to the organic degradation process. Therefore, if the quenching agent of ethanol is present in solution, the degradation will be significantly reduced or prevented.35 Control experiments were conducted to compare the catalytic performance with the addition of ethanol on Fe3C@NCNT-700, Fe3C@NCNT-800 and Fe3C@NCNT-900. As shown in Fig. 10(a), (c) and (e), all of the three catalysts maintained excellent phenol degradation performance, even with a high concentration of quenching reagent. Specifically, when ethanol was added at a molar ratio of 500![[thin space (1/6-em)]](https://www.rsc.org/images/entities/char_2009.gif) :
:![[thin space (1/6-em)]](https://www.rsc.org/images/entities/char_2009.gif) 1 (ethanol
1 (ethanol![[thin space (1/6-em)]](https://www.rsc.org/images/entities/char_2009.gif) :
:![[thin space (1/6-em)]](https://www.rsc.org/images/entities/char_2009.gif) PMS), 100% phenol was degraded in 120, 45 and 45 min over Fe3C@NCNT-700, Fe3C@NCNT-800 and Fe3C@NCNT-900, respectively. Even in complete ethanol solution, 100% phenol was degraded in 180, 90 and 60 min, respectively. Although degradation still occurred with the quenching agent, which indicated that radical processes existed in this reaction, the results strongly suggested that generated ˙OH and SO4˙− radicals played a relatively small role in phenol degradation, and other radicals or non-radical processes may play more significant roles. Due to the instantaneous reaction with hydroxyl radicals and the stagnated reaction with sulfate radicals, tert-butanol (TBA) was suggested to be an effective scavenger for ˙OH in the catalytic oxidation process.55 When TBA was added to the reaction solution at a molar ratio of 100
PMS), 100% phenol was degraded in 120, 45 and 45 min over Fe3C@NCNT-700, Fe3C@NCNT-800 and Fe3C@NCNT-900, respectively. Even in complete ethanol solution, 100% phenol was degraded in 180, 90 and 60 min, respectively. Although degradation still occurred with the quenching agent, which indicated that radical processes existed in this reaction, the results strongly suggested that generated ˙OH and SO4˙− radicals played a relatively small role in phenol degradation, and other radicals or non-radical processes may play more significant roles. Due to the instantaneous reaction with hydroxyl radicals and the stagnated reaction with sulfate radicals, tert-butanol (TBA) was suggested to be an effective scavenger for ˙OH in the catalytic oxidation process.55 When TBA was added to the reaction solution at a molar ratio of 100![[thin space (1/6-em)]](https://www.rsc.org/images/entities/char_2009.gif) :
:![[thin space (1/6-em)]](https://www.rsc.org/images/entities/char_2009.gif) 1 (TBA
1 (TBA![[thin space (1/6-em)]](https://www.rsc.org/images/entities/char_2009.gif) :
:![[thin space (1/6-em)]](https://www.rsc.org/images/entities/char_2009.gif) PMS), 100% phenol was degraded in 120, 90 and 30 min on Fe3C@NCNT-700, Fe3C@NCNT-800 and Fe3C@NCNT-900. The degradation efficiency was not significantly reduced or prevented by the addition of ethanol or TBA; thus, we can conclude that both ˙OH and SO4˙− radicals were not the dominant reactive species for these catalytic oxidation processes but that SO4˙− made a larger contribution than ˙OH to phenol degradation.
PMS), 100% phenol was degraded in 120, 90 and 30 min on Fe3C@NCNT-700, Fe3C@NCNT-800 and Fe3C@NCNT-900. The degradation efficiency was not significantly reduced or prevented by the addition of ethanol or TBA; thus, we can conclude that both ˙OH and SO4˙− radicals were not the dominant reactive species for these catalytic oxidation processes but that SO4˙− made a larger contribution than ˙OH to phenol degradation.
Previous studies have demonstrated that singlet oxygen (1O2) is also generated from the catalytic oxidation process. Sodium azide (NaN3) is an effective quenching agent for 1O2; however, it also reacts rapidly with ˙OH.56–58 However, ˙OH was proved to be inactive for phenol decomposition in the above ethanol quenching experiment. In this process, 3 mM NaN3 was added to the catalytic reaction solution. Although some of the NaN3 was consumed by PMS, the remaining NaN3 was sufficient to quench free radicals. It was found that the phenol degradation efficiency dramatically decreased with the addition of NaN3; only 75% phenol was degraded in 180 min on Fe3C@NCNT-700, and 100% phenol was degraded in almost 90 min on both Fe3C@NCNT-800 and Fe3C@NCNT-900. These results suggest that 1O2 is the major reactive species in phenol degradation.
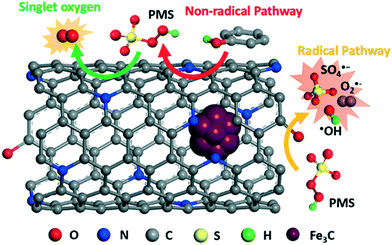
The contribution of ˙O2− in phenol degradation was determined using p-benzoquinone (PBQ), an effective quenching agent for ˙O2−.59,60 When 3 mM PBQ was placed in the catalytic phenol solution, it was observed that 90.6% phenol was degraded in 180 min over Fe3C@NCNT-700, 100% phenol was degraded in almost 180 min over Fe3C@NCNT-800 and 100% phenol was degraded in 20 min over Fe3C@NCNT-900. The phenol degradation efficiency was suppressed greatly by the addition of PBQ for Fe3C@NCNT-700 and Fe3C@NCNT-800, but did not change for Fe3C@NCNT-900, revealing that ˙O2− was responsible for phenol decomposition for the former two catalysts. This may be because of the breakup of CNTs at high temperature, leading to the exposure of some Fe3C nanoparticles and thus reducing the generation of ˙O2−. A proposed mechanism of PMS activation on Fe3C@NCNT is illustrated in Scheme 1.
Overall, in the above four scavenging tests, 1O2 and ˙O2− were recognized as the dominant reactive oxygen species generated in phenol catalytic degradation on Fe3C@NCNT-700 and Fe3C@NCNT-800; 1O2 exhibited a larger contribution. However, for Fe3C@NCNT-900, only 1O2 was recognized as the major reactive oxygen species. For all of the three catalysts, both ˙OH and SO4˙− exerted very small impacts on phenol degradation.61 Therefore, in this investigation, the possible mechanism of the superior activity and excellent stability of Fe3C@NCNT catalysts in the activation of PMS for phenol degradation can be explained by a combination of radical and nonradical processes, which were significantly promoted by quaternary and pyridinic N, and by synergetic effects between the inner Fe3C and outside carbon as well as by trace amounts of Fe on the surface.
Conclusions
In summary, nitrogen-doped carbon nanotubes with encapsulated Fe3C nanoparticles (Fe3C@NCNT) were successfully prepared through a simple and green pyrolysis process of melamine and iron chlorides. The characterization results showed that Fe3C nanocrystals were mainly encapsulated in the interior of the Fe3C@NCNT composites. The as-prepared Fe3C@NCNT catalysts exhibited both excellent catalytic performance and outstanding stability in phenol degradation. The quaternary and pyridinic N, synergetic effects between the inner Fe3C and outside carbon, and trace amounts of Fe on the surface may be the active sites to enhance catalytic degradation. Quenching experiments were used to observe the generated reactive radicals, and 1O2 and ˙O2− were proven to be the major radicals in catalytic phenol degradation. This novel synthetic approach, unique structure and proposed mechanism will stimulate the development of active and durable metal-based carbon catalysts in environmental science research.Acknowledgements
This work was partially supported by the Australian Research Council (DP130101319). The authors acknowledge the use of equipment and the scientific and technical assistance of the Curtin University Electron Microscope Facility, which is partially funded by the University, State and Commonwealth Governments. H. S. is grateful for support from the Curtin Research Fellowship and Opening Project (KL13-02) of the State Key Laboratory of Materials-Oriented Chemical Engineering, China.Notes and references
- F. Perreault, A. Fonseca de Faria and M. Elimelech, Chem. Soc. Rev., 2015, 44, 5861–5896 RSC.
- X. G. Duan, Z. M. Ao, L. Zhou, H. Q. Sun, G. X. Wang and S. B. Wang, Appl. Catal., B, 2016, 188, 98–105 CrossRef CAS.
- X. G. Duan, C. Su, L. Zhou, H. Q. Sun, A. Suvorova, T. Odedairo, Z. H. Zhu, Z. P. Shao and S. B. Wang, Appl. Catal., B, 2016, 194, 7–15 CrossRef CAS.
- J. Kang, X. G. Duan, L. Zhou, H. Q. Sun, M. O. Tade and S. B. Wang, Chem. Eng. J., 2016, 288, 399–405 CrossRef CAS.
- W. J. Tian, H. Y. Zhang, X. G. Duan, H. Q. Sun, M. O. Tade, H. M. Ang and S. B. Wang, ACS Appl. Mater. Interfaces, 2016, 8, 7184–7193 CAS.
- C. Wang, J. Kang, H. Q. Sun, H. M. Ang, M. O. Tade and S. B. Wang, Carbon, 2016, 102, 279–287 CrossRef CAS.
- Y. Wang, S. Indrawirawan, X. Duan, H. Sun, H. M. Ang, M. O. Tadé and S. Wang, Chem. Eng. J., 2015, 266, 12–20 CrossRef CAS.
- Y. Wang, H. Sun, H. M. Ang, M. O. Tadé and S. Wang, J. Colloid Interface Sci., 2014, 433, 68–75 CrossRef CAS PubMed.
- Y. Wang, H. Sun, H. M. Ang, M. O. Tadé and S. Wang, Appl. Catal., B, 2015, 164, 159–167 CrossRef CAS.
- Y. J. Yao, Y. M. Cai, G. D. Wu, F. Y. Wei, X. Y. Li, H. Chen and S. B. Wang, J. Hazard. Mater., 2015, 296, 128–137 CrossRef CAS PubMed.
- H. Sun, S. Liu, G. Zhou, H. M. Ang, M. O. Tadé and S. Wang, ACS Appl. Mater. Interfaces, 2012, 4, 5466–5471 CAS.
- X. Duan, H. Sun, J. Kang, Y. Wang, S. Indrawirawan and S. Wang, ACS Catal., 2015, 5, 4629–4636 CrossRef CAS.
- H. Sun, Y. Wang, S. Liu, L. Ge, L. Wang, Z. Zhu and S. Wang, Chem. Commun., 2013, 49, 9914–9916 RSC.
- H. Q. Sun, C. Kwan, A. Suvorova, H. M. Ang, M. O. Tade and S. B. Wang, Appl. Catal., B, 2014, 154, 134–141 CrossRef.
- M. Lefevre, E. Proietti, F. Jaouen and J. P. Dodelet, Science, 2009, 324, 71–74 CrossRef CAS PubMed.
- Z. Chen, D. Higgins, A. Yu, L. Zhang and J. Zhang, Energy Environ. Sci., 2011, 4, 3167–3192 CAS.
- Z. Y. Wu, X. X. Xu, B. C. Hu, H. W. Liang, Y. Lin, L. F. Chen and S. H. Yu, Angew. Chem., Int. Ed., 2015, 54, 8179–8183 CrossRef CAS PubMed.
- Z. W. Chen, D. Higgins, A. P. Yu, L. Zhang and J. J. Zhang, Energy Environ. Sci., 2011, 4, 3167–3192 CAS.
- X. G. Li, G. Liu and B. N. Popov, J. Power Sources, 2010, 195, 6373–6378 CrossRef CAS.
- F. Jaouen, E. Proietti, M. Lefevre, R. Chenitz, J. P. Dodelet, G. Wu, H. T. Chung, C. M. Johnston and P. Zelenay, Energy Environ. Sci., 2011, 4, 114–130 CAS.
- T. Yang and G. Q. Han, Int. J. Electrochem. Sci., 2012, 7, 10884–10893 CAS.
- H. J. Zhang, Q. Z. Jiang, L. L. Sun, X. X. Yuan, Z. P. Shao and Z. F. Ma, Int. J. Hydrogen Energy, 2010, 35, 8295–8302 CrossRef CAS.
- D. H. Deng, L. Yu, X. Q. Chen, G. X. Wang, L. Jin, X. L. Pan, J. Deng, G. Q. Sun and X. H. Bao, Angew. Chem., Int. Ed., 2013, 52, 371–375 CrossRef CAS PubMed.
- Y. Hu, J. O. Jensen, W. Zhang, L. N. Cleemann, W. Xing, N. J. Bjerrum and Q. F. Li, Angew. Chem., Int. Ed., 2014, 53, 3675–3679 CrossRef CAS PubMed.
- Y. Wang, H. Sun, X. Duan, H. M. Ang, M. O. Tadé and S. Wang, Appl. Catal., B, 2015, 172–173, 73–81 CrossRef CAS.
- G. Zhong, H. Wang, H. Yu and F. Peng, J. Power Sources, 2015, 286, 495–503 CrossRef CAS.
- Y. J. Yao, H. Chen, C. Lian, F. Y. Wei, D. W. Zhang, G. D. Wu, B. J. Chen and S. B. Wang, J. Hazard. Mater., 2016, 314, 129–139 CrossRef CAS PubMed.
- J. J. Shi, Y. Y. Wang, W. C. Du and Z. Y. Hou, Carbon, 2016, 99, 330–337 CrossRef CAS.
- M. Li, Y. P. Xiong, X. T. Liu, C. Han, Y. F. Zhang, X. J. Bo and L. P. Guo, J. Mater. Chem. A, 2015, 3, 9658–9667 CAS.
- W. X. Yang, X. J. Liu, X. Y. Yue, J. B. Jia and S. J. Guo, J. Am. Chem. Soc., 2015, 137, 1436–1439 CrossRef CAS PubMed.
- W. Wei, H. W. Liang, K. Parvez, X. D. Zhuang, X. L. Feng and K. Mullen, Angew. Chem., Int. Ed., 2014, 53, 1570–1574 CrossRef CAS PubMed.
- S. Trasobares, O. Stephan, C. Colliex, W. K. Hsu, H. W. Kroto and D. R. M. Walton, J. Chem. Phys., 2002, 116, 8966–8972 CrossRef CAS.
- A. B. Wu, D. M. Liu, L. Z. Tong, L. X. Yu and H. Yang, CrystEngComm, 2011, 13, 876–882 RSC.
- V. Nallathambi, N. Leonard, R. Kothandaraman and S. C. Barton, Electrochem. Solid-State Lett., 2011, 14, B55–B58 CrossRef CAS.
- X. Duan, H. Sun, Y. Wang, J. Kang and S. Wang, ACS Catal., 2015, 5, 553–559 CrossRef CAS.
- A. K. Schaper, H. Q. Hou, A. Greiner and F. Phillipp, J. Catal., 2004, 222, 250–254 CrossRef CAS.
- J. Y. Liang, C. C. Wang and S. Y. Lu, J. Mater. Chem. A, 2015, 3, 24453–24462 CAS.
- S. M. Zhang, H. Y. Zhang, Q. Liu and S. L. Chen, J. Mater. Chem. A, 2013, 1, 3302–3308 CAS.
- H. Kim and W. Sigmund, Carbon, 2005, 43, 1743–1748 CrossRef CAS.
- B. Zhang, J. Song, G. Yang and B. Han, Chem. Sci., 2014, 5, 4656–4660 RSC.
- Y. Yao, H. Chen, J. Qin, G. Wu, C. Lian, J. Zhang and S. Wang, Water Res., 2016, 101, 281–291 CrossRef CAS PubMed.
- M. Zhao and H. H. Song, Mater. Chem. Phys., 2010, 124, 861–864 CrossRef CAS.
- Y. Z. Wang, Y. Liu, W. Liu, H. Y. Chen, G. X. Zhang and J. H. Wang, Mater. Lett., 2015, 154, 64–67 CrossRef CAS.
- Y. Wang, H. Sun, H. M. Ang, M. O. Tadé and S. Wang, ACS Appl. Mater. Interfaces, 2014, 6, 19914–19923 CAS.
- Y. Wang, H. Sun, H. M. Ang, M. O. Tadé and S. Wang, Chem. Eng. J., 2014, 245, 1–9 CrossRef CAS.
- J. Zhang, R. Wang, E. Z. Liu, X. F. Gao, Z. H. Sun, F. S. Xiao, F. Girgsdies and D. S. Su, Angew. Chem., Int. Ed., 2012, 51, 7581–7585 CrossRef CAS PubMed.
- Y. Liu, X. Z. Wang, Y. F. Dong, Z. Y. Wang, Z. B. Zhao and J. S. Qiu, J. Mater. Chem. A, 2014, 2, 16832–16835 CAS.
- S. Kundu, W. Xia, W. Busser, M. Becker, D. A. Schmidt, M. Havenith and M. Muhler, Phys. Chem. Chem. Phys., 2010, 12, 4351–4359 RSC.
- O. Soares, R. P. Rocha, A. G. Goncalves, J. L. Figueiredo, J. J. M. Orfao and M. F. R. Pereira, Carbon, 2015, 91, 114–121 CrossRef CAS.
- G. Wu, K. L. More, P. Xu, H. L. Wang, M. Ferrandon, A. J. Kropf, D. J. Myers, S. G. Ma, C. M. Johnston and P. Zelenay, Chem. Commun., 2013, 49, 3291–3293 RSC.
- M. L. Xiao, J. B. Zhu, L. G. Feng, C. P. Liu and W. Xing, Adv. Mater., 2015, 27, 2521–2527 CrossRef CAS PubMed.
- X. Duan, Z. Ao, H. Sun, S. Indrawirawan, Y. Wang, J. Kang, F. Liang, Z. H. Zhu and S. Wang, ACS Appl. Mater. Interfaces, 2015, 7, 4169–4178 CAS.
- X. Duan, K. O'Donnell, H. Sun, Y. Wang and S. Wang, Small, 2015, 11, 3036–3044 CrossRef CAS PubMed.
- B. Jiang, D. Dai, Y. Yao, T. Xu, R. Li, R. Xie, L. Chen and W. Chen, Chem. Commun., 2016, 52, 9566–9569 RSC.
- H. Zhao, Y. M. Dong, P. P. Jiang, G. L. Wang, J. J. Zhang, K. Li and C. Y. Feng, New J. Chem., 2014, 38, 1743–1750 RSC.
- A. Jawad, X. Y. Lu, Z. Q. Chen and G. C. Yin, J. Phys. Chem. A, 2014, 118, 10028–10035 CrossRef CAS PubMed.
- J. Catalan, C. Diaz and L. Barrio, Chem. Phys., 2004, 300, 33–39 CrossRef CAS.
- R. A. Lundeen, C. H. Chu, M. Sander and K. McNeill, Environ. Sci. Technol., 2016, 50, 8586–8595 CrossRef CAS PubMed.
- M. Q. Yang, Y. H. Zhang, N. Zhang, Z. R. Tang and Y. J. Xu, Sci. Rep., 2013, 3, 3314 Search PubMed.
- Y. Zhou, J. Jiang, Y. Gao, J. Ma, S. Y. Pang, J. Li, X. T. Lu and L. P. Yuan, Environ. Sci. Technol., 2015, 49, 12941–12950 CrossRef CAS PubMed.
- Y. X. Wang, Y. B. Xie, H. Q. Sun, J. D. Xiao, H. B. Cao and S. B. Wang, ACS Appl. Mater. Interfaces, 2016, 8, 9710–9720 CAS.
Footnote |
| † Electronic supplementary information (ESI) available: Photos of magnetic separation, SEM images of Fe3C@NCNT catalysts, XRD of used catalysts, and EPR spectra. See DOI: 10.1039/c6en00397d |
| This journal is © The Royal Society of Chemistry 2017 |

