 Open Access Article
Creative Commons Attribution 3.0 Unported Licence
Can BECCS deliver sustainable and resource efficient negative emissions?
Mathilde
Fajardy
ab and
Niall
Mac Dowell
 *ab
*ab
aCentre for Environmental Policy, Imperial College London, Exhibition Road, London, SW7 1NA, UK. E-mail: niall@imperial.ac.uk; Tel: +44 (0)20 7594 9298
bCentre for Process Systems Engineering, Imperial College London, Exhibition Road, London, SW7 2AZ, UK
First published on 6th April 2017
Abstract
Negative emissions technologies (NETs) in general and bioenergy with CO2 capture and storage (BECCS) in particular are commonly regarded as vital yet controversial to meeting our climate goals. In this contribution we present a whole-systems analysis of the BECCS value chain associated with cultivation, harvesting, transport and conversion in dedicated biomass power stations in conjunction with CCS, of a range of biomass resources – both dedicated energy crops (miscanthus, switchgrass, short rotation coppice willow), and agricultural residues (wheat straw). We explicitly consider the implications of sourcing the biomass from different regions, climates and land types. The water, carbon and energy footprints of each value chain were calculated, and their impact on the overall system water, carbon and power efficiencies was evaluated. An extensive literature review was performed and a statistical analysis of the available data is presented. In order to describe the dynamic greenhouse gas balance of such a system, a yearly accounting of the emissions was performed over the lifetime of a BECCS facility, and the carbon “breakeven time” and lifetime net CO2 removal from the atmosphere were determined. The effects of direct and indirect land use change were included, and were found to be a key determinant of the viability of a BECCS project. Overall we conclude that, depending on the conditions of its deployment, BECCS could lead to both carbon positive and negative results. The total quantity of CO2 removed from the atmosphere over the project lifetime and the carbon breakeven time were observed to be highly case specific. This has profound implications for the policy frameworks required to incentivise and regulate the widespread deployment of BECCS technology. The results of a sensitivity analysis on the model combined with the investigation of alternate supply chain scenarios elucidated key levers to improve the sustainability of BECCS: (1) measuring and limiting the impacts of direct and indirect land use change, (2) using carbon neutral power and organic fertilizer, (3) minimising biomass transport, and prioritising sea over road transport, (4) maximising the use of carbon negative fuels, and (5) exploiting alternative biomass processing options, e.g., natural drying or torrefaction. A key conclusion is that, regardless of the biomass and region studied, the sustainability of BECCS relies heavily on intelligent management of the supply chain.
Broader contextNegative emissions technologies, in general, and bioenergy with carbon capture and storage (BECCS), in particular, are fundamental to achieving the 1.5 °C goal as articulated by the 2015 Paris COP agreement. However, as a technology BECCS remains dogged by controversy arising from the competition for arable land and fresh water, in addition to questions concerning its ability to actually remove CO2 from the atmosphere. In this contribution, we present a whole-systems assessment of BECCS, explicitly accounting for the cultivation, harvesting, transport and conversion of biomass and the subsequent sequestration of the arising CO2. Owing to CO2 emissions associated with the initial land use change and these subsequent emissions, BECCS projects incur an initial and ongoing carbon debt. Thus, the viability of BECCS as a negative emissions technology option depends entirely on the choices made throughout the supply chain. Moreover, owing to the uncertainty primarily associated with land use change, “one size fits all” regulation may be particularly challenging. In particular, the carbon breakeven time and the lifetime net CO2 removal from the atmosphere tend to be case-specific. Key policy challenges will likely include (a) how carbon negative should the BECCS project be in order to warrant support and (b) how should a BECCS plant which has not yet started to remove CO2 from the atmosphere be supported? |
1 Introduction
1.1 BECCS and negative emissions
Bioenergy with carbon capture and storage is the combination of two well-known technologies for climate change mitigation. Carbon capture and sequestration (CCS) as a means to mitigate CO2 emissions arising from the power and industrial sectors has been widely investigated in the literature,1–3 and the use of biomass as an energy source is ubiquitous throughout human history. Their combination was first identified as a negative emission technology (NET) by Williams et al. for the production of hydrogen,4 and by Herzog for power generation5 in 1996. However, the combination of bio-energy and carbon capture and storage was not referred to as “BECS” or “BECCS” until 2003 when Kraxner et al. first coined the term.6 A core element of the utility of BECCS is its potential to remove CO2 from the atmosphere,6–14 and in so doing permit the offsetting, or mitigation, of otherwise hard to reach point sources such as transport or sources which are remote from the CO2 transport and storage infrastructure.15 In the context of meeting ambitious climate change mitigation scenarios, BECCS plays an increasingly important role in the outputs of integrated assessment models (IAMs),16,17 both as an offset technology and as a means to address any overshoot in emissions.However, despite its potential advantages, BECCS is not without controversy. Land competition for food production,18 as well as CO2 emissions associated with biomass cultivation, harvesting and processing19 cast doubt on the general ability of a BECCS facility to actually result in a net removal of CO2 from the atmosphere. It is recognised20 that a detailed assessment of the water, land and carbon intensity of the biomass supply chain and conversion technology is vital to quantitatively addressing the uncertainty in this area, identifying key points for improvement and thus facilitating the large scale deployment of BECCS.
1.2 BECCS technical challenges
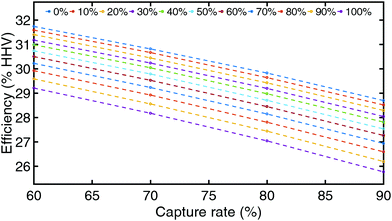
One category of challenges BECCS faces relates to conversion and CO2 capture technologies. In a post-combustion capture system, steam is taken out of the steam cycle to regenerate the solvent. This imposes a first energy penalty on the system, on the order of 20% with conventional technologies at 90% capture, or 9% in efficiency points21 with conventional solvents (i.e., alkanolamines). Using state-of-the-art solvents could bring the heat requirement to values as low as 2.3 GJ tCO2−1,22,23 or even 2 GJ tCO2−1 in the case of biphasic solvents.24 Bui et al. investigated the impact of solvent heat duty on the system efficiency and carbon intensity, and showed that using advanced solvents combined with heat recovery from the boiler exhaust gases could reduce the efficiency penalty associated with solvent regeneration to zero.25This efficiency penalty is further increased by the use of a potentially lower quality fuel – biomass – in complement or supplement to coal. While the average higher heating value (HHV) of bituminous coal is approximately 27 MJ tMW−1 at 11% moisture and 64% carbon content,26 raw biomass with a higher moisture content – up to 50% with woody biomass27 – and a lower carbon content – around 48% dry mass – tends to exhibit an HHV around 18–20 MJ tDM−1.28–33 In addition to the efficiency loss at the boiler, the physical properties of biomass will increase the costs associated with fuel storage, handling and size reduction. In the case of high moisture biomass, drying will automatically represent a substantial energy cost. Furthermore, as shown in Williams et al.,34 biomass grindability is significantly lower than that of coal, resulting in a grinding energy cost up to four to five times higher on a mass basis. On an HHV basis, grinding energy cost can be up to seven times higher for biomass relative to coal, with an energy requirement of 20 kW h MW hHHV−1 in the case of wood pellets, against 3 kW h MW hHHV−1 in the case of coal. In addition to a reduction in efficiency associated with increased fuel processing costs, another concern is associated with transitioning from dedicated coal to dedicated biomass combustion and the resulting impact on the boiler technology. Experimental studies35 and recent reports from Drax power station, which converted two 660 MW units to dedicated biomass in 2014,36 demonstrate that large scale biomass firing is feasible with no major change, provided a modern boiler technology is used. Utility-scale biomass-fired power plants are inherently more costly than their coal-fired counterparts, primarily as a result of the more costly fuel handling and storage infrastructure. In addition to the capital cost, the ongoing operating cost associated with providing a nitrogen-rich atmosphere for the biomass is also an important consideration. Moreover, an improved understanding of the impact of ash formation and slagging behaviour on boiler efficiency and maintenance37,38 costs is also necessary.
However, Mac Dowell and Fajardy showed that BECCS facilities that are less efficient at converting biomass to electricity could remove more CO2 at a lower cost than their more efficient counterparts.39 This paradoxical observation has important implications for the way in which CDR technologies will be integrated with the broader energy system.
1.3 BECCS and the water concern
Agriculture and power generation are highly water intense, accounting for 70%40 and 15%41 of the world's total water consumption. Thus the sustainability of BECCS warrants close scrutiny.42 According to the Food and Agriculture Organization,40 1.2 billion people already live in absolute water scarcity, and this number could be further increased by the additional 1.6 billion who are currently facing water shortage. As agriculture is responsible for up to 90% of water consumption in the Asia-Pacific region,43 the combination of population growth and climate change has the potential to further exacerbate this situation.44,45 The shift towards the sustainable use of water in farming relies heavily on region-specific guidelines regarding crop irrigation need. One of the main principle methodologies in common use is the blue, green and grey water footprint model developed by Hoesktra et al.46 Based partly on the crop evapotranspiration model developed by Allen et al.,47 this methodology enables the quantification of the water requirements of a given crop, based on the climate conditions (green water), ground and surface water local availability (blue water) and pollution (grey water).48 This methodology has been used to reliably determine the water footprint of a range of agricultural products,49,50 including cellulosic biomass51 and biofuels.52 The water footprint of bioelectricity was also investigated,53 but did not include the power plant water requirement. Further, several studies have focused on quantifying water use in the power generation sector.41,54,55 Wu et al. developed a modeling framework to evaluate the blue water footprint as a function of cooling technologies, power plant type, and fuel, and included solid biomass as one of its case studies. Biomass upstream water requirement was however assumed to be met by rainfall, and biomass grey water footprint was not considered.54 In order to evaluate the BECCS overall water cost, both evaluations – biomass production and water requirement for power generation – need to be integrated within the same framework.1.4 Biomass production energy cost
Before being combusted, biomass needs to be grown, harvested, processed (dried, densified for transport, etc.) and transported to the power plant. This results in a substantial energy cost, which will further decrease the net power generation efficiency of a given BECCS project, on a whole-systems basis. Many studies adopt a life cycle assessment (LCA) approach to determine biomass embodied energy (EE) – direct and indirect energy use to produce a ton of biomass – or biomass energy ratio (ER) – EE over the fuel heating value. Bioenergy production has extended its potential feedstock from conventional cereal and oil crops, to cellulosic biomass, with both dedicated production and agriculture residue collection such as wheat straw.56–59 Among dedicated energy crops, perennial grasses and short rotation coppice have been extensively investigated. Both perennial grasses, miscanthus60–78 and switchgrass9,30,57,61,66,67,79–92 have been studied and compared at the farming, processing or conversion level. Woody biomass such as short rotation willow has also been widely investigated for temperate climates.15,58,67,69,93–99 Studies based on transparent model with clearly outlined system boundaries, such as the Farm Energy Analysis tool (FEAT67), the Biomass Emissions and Counterfactual (BEAC99) and the Greenhouse Gases, Regulated Emissions, and Energy Use in Transportation (GREET54) Model do exist. However, some studies only focus on a portion of the supply chain – adopting either a farm gate67,69,96 or a power plant gate57,65,100 perspective – and only a few include irrigation76,87 and drying.57,65,94 Both processes could represent significant contributions in the biomass supply energy cost, and were included in this analysis. The extensive literature on the subject results in a high variability in EE and ER values for a wide range of biomass. A detailed and transparent model of the entire BECCS value chain, including biomass conversion, with clear boundaries and assumptions, is required for the reliable evaluation of BECCS.1.5 Accounting for direct and indirect GHG emissions
In addition to a high energy cost, the biomass supply chain may result in a substantial amount of direct and indirect GHG emissions. This represents the main challenge to BECCS' ability to deliver net CO2 removal. A first issue often raised involves biomass sourcing and transportation related emissions. There are several biogeophysical and geopolitical constraints to consider: all geological storage sites do not coincide with available land for biomass production, or locations of thermal power plants. The deployment of BECCS at the scale envisioned by IAM solutions will likely require a multi-national biomass supply chain, with stakeholders based in different regions acting to provide a reliable supply of sustainably sourced biomass. In 2015, over 70% of UK Drax power plant biomass supply was imported from North America, incurring a carbon cost of 36 gCO2 MJ−1 of electricity produced.36 The UK Bioenergy Strategy published in 2012101 provides a precise GHG emissions accounting methodology, which includes the direct and indirect emissions resulting from land conversion, i.e., converting a certain type of land – cropland, grassland, forest – to a biomass crop. This is referred to as direct land use change, and as defined by Fargione et al.,102 encompasses the direct emissions released during the initial plant combustion and eventual decomposition of roots and leaves, the carbon converted into charcoal, and the carbon incorporated into merchantable forestry products (considered to have a half-life of 30 years). Land conversion factors are a strong function of the land type converted, and are reported to be in the range 0–70 kgCO2 ha−1 for marginal land,102 350–120 tCO2 ha−1 for forest102,103 or even up to 3450 tCO2 ha−1 for wetland.102 However, some studies42,104,105 argue that this accounting method cannot be complete without taking into account the indirect effects of altering a land economic function (e.g., agriculture, grazing) by converting part of it for biomass production. Models evaluating those effects do exist, but their level of specificity limits their applicability to a case-to-case basis.103,106–108 Plevin et al. evaluated indirect emission factors to range from 10 to 340 gCO2-eq MJ−1 of liquid biofuel, with a strong sensitivity to socio-economic activity and time horizon within a specific region.This dependence on time also raises the question of dynamic accounting of carbon emissions. Some studies indicate that on a transient basis, the “carbon debt” initiated by land conversion to biomass production cannot offset CO2 savings from displacing coal, or only over a period of time that is greater than the power plant lifetime.109,110 This is referred to as “carbon payback time”, or carbon breakeven time, and can be understood as the amount of time required for a system to reach carbon neutrality. In those studies however, biofuels pay back this initial carbon debt by offsetting fossil fuel related emissions, and carbon breakeven time thus has to be calculated relatively to a given fossil fuel. In the BECCS case, because it physically captures carbon from the atmosphere, we define it as the time required for a BECCS power plant to pay back this initial debt by biomass combustion and carbon storage.
The aforementioned uncertainties result in BECCS' net CO2 removal which varies greatly on both a spatial and temporal basis. As a result, input data uncertainty needs to be captured in BECCS CO2 balance for the assessment to be meaningful.
The purpose of this contribution is to present a spatially and temporally explicit, whole-systems assessment of the BECCS supply chain, accounting for the cultivation, harvesting, processing, transport, and conversion of biomass and the subsequent sequestration of the arising CO2. We evaluate each distinct BECCS system on the basis of energy, carbon, water, and land-use intensity, using the net removal of CO2 from the atmosphere as a determining key performance indicator. The rest of the paper is structured as follows. Section 2 provides an overview of the approach adopted in this analysis, in particular presenting a detailed analysis of the uncertainty associated with the published data required to characterise the biomass supply chain. Section 3 quantifies and qualifies the different contributions to the water, energy and land intensities of the integrated BECCS system, and the resulting impact on the overall system thermo- and hydrodynamic efficiencies, in addition to the carbon intensity and carbon efficiency. Finally, Section 4 focuses on the dynamic accounting of GHG emissions over the system lifetime, on its sensitivities, and concludes with some perspectives on the implications for the potential of BECCS to result in the net removal of CO2 from the atmosphere.
2 Model overview
In order to meet the objectives of the study, four sub-models were developed and integrated: biomass cultivation, processing, transport to a UK-based power plant, and conversion in a 500 MW thermal power plant combined with CCS. For each sub-model, energy, GHG (CO2 and N2O) and water balances were carried out. Biomass can be supplied to the power plant in various forms, such as bales, chips, pellets or briquettes.111 Each biomass conditioning process involves different processing stages and moisture requirements, resulting in a different supply chain energy cost. As the optimal moisture content for biomass combustion is around 10–15 wt%,112,113 drying of biomass is generally required. Biomass pelleting also requires a feedstock at around 10 wt% moisture.65 For this analysis, a pellet supply chain including biomass production, processing (chopping, drying, grinding, pelleting), pellet transport and further treatment (pellet grinding) at the power plant was chosen as a base case. A comparison with alternative supply chains is left for future work. In order to compare different feedstock, four representative types of biomass were selected: miscanthus and switchgrass, short rotation coppice (SRC) willow, and wheat straw. Thus, this range allows us to evaluate perennial grasses, woody biomass, and agricultural residues. To capture the spatial dependence of this model (biomass productivity, climate, road and sea transport distance to the UK), five regions of the world, associated with distinct climates, were considered: sub-tropical south-west Brazil, continental temperate central China, temperate western Europe, semi-arid northern India and subtropical southern USA. Finally four land types were considered (cropland, grassland, forest, marginal cropland) to capture effects of direct and indirect land use changes.The evaluation of the thermo- and hydrodynamic efficiencies and carbon intensity of a 500 MW BECCS power plant was carried out in the conversion model. Different cooling technologies (once-through, wet cooling tower), CO2 capture rates (60–90%) and co-firing proportions (0–100%) were considered in the model. Biomass physical properties and supply chain footprints previously evaluated were included in the model to evaluate how BECCS performed with each feedstock. BECCS efficiency to convert biologically stored CO2 into geologically stored CO2 was also determined. Finally, in order to capture BECCS CO2 removal time efficiency, this model included an evaluation of the cumulative emissions and carbon breakeven time of a hectare of land used in such a system over 50 years. The different interactions between these sub-models are outlined in Fig. 1.
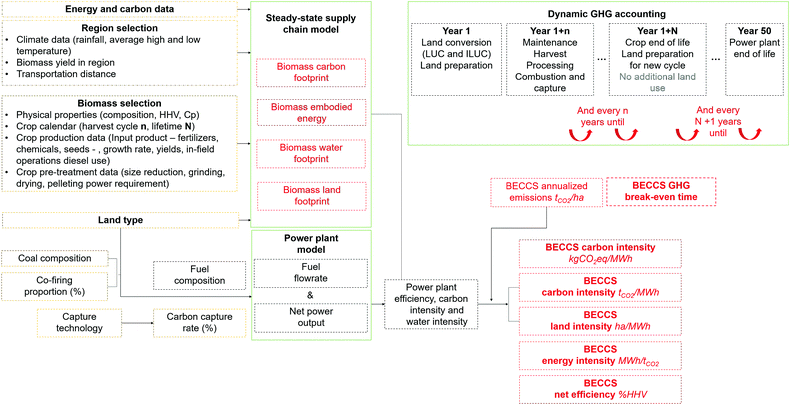 | ||
| Fig. 1 Biomass water, carbon, energy and land footprints were calculated using energy and carbon data, region specific data, biomass data and land data. The power plant calculations were carried out in IECM.26 BECCS hydro, energy and carbon efficiencies were calculated by combining the supply chain and the power plant model. The temporal carbon efficiency of BECCS was evaluated with a dynamic GHG balance over 50 years. | ||
2.1 Data collection and curation
As is evident from the foregoing description, this model requires a significant amount of input data. Thus, a key activity was the collection and statistical analysis of these data. The model input parameters are of several types:• Energy data: all indirect energy data – chemicals, seeds and fuels embodied energy – and direct energy data – fuel LHV, energy for irrigation, transport fuel efficiency and drying system characteristics.
• Carbon data: all indirect emission data – carbon footprint of chemicals, seeds and fuels – and direct emission data – fuel and transport emission factors, N2O model emission factors, gas global warming potential and land conversion factors.
• Crop data: the physical properties of each biomass type – composition, Cp, HHV – as well as farming data – yields over lifetime and in different regions, moisture content, lifetime and harvest rotation cycle, crop coefficients and calendar, chemical input rates, fuel efficiencies and processing energy requirements of in-field operations.
• Climate data: precipitations, altitude, longitude, sunshine hours, wind speed, average low and high temperatures and relative humidity for each region.
• Land type for direct and indirect land use change evaluation.
Some input parameters have a great impact on all aspects of the supply chain. Yield for example is a key parameter. As all supply chain inputs during the growth stage are on a per hectare basis (land use effects, chemicals input, in-field operations), biomass productivity (or yield) in dry tons per hectare will directly impact the extent of these contributions per dry ton or GJ of biomass delivered at the power plant. Another example is biomass moisture content. It directly impacts not only drying energy requirements, but also all of the processing and transport stages whose energy requirements depend on the incoming wet biomass mass flow, and are finally converted into MJ per dry ton.
The values for these parameters are reported over a wide range in the literature. Miscanthus in Europe for example has been widely investigated, and productivity as low as 4 tDM ha−1![[thin space (1/6-em)]](https://www.rsc.org/images/entities/char_2009.gif) 75 and as high as 60 tDM ha−1
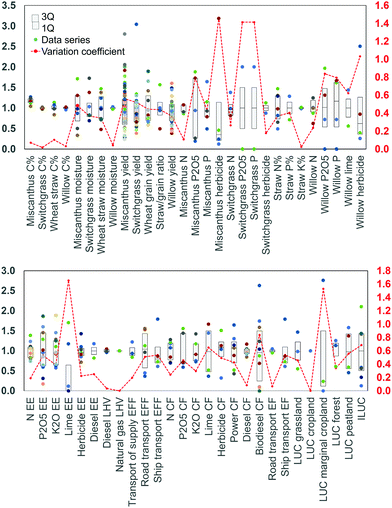
75 and as high as 60 tDM ha−1![[thin space (1/6-em)]](https://www.rsc.org/images/entities/char_2009.gif) 77 have been reported. To capture this uncertainty in the model, a database gathering the 150 input parameters, and their value according to different sources, was developed. 50 input parameters were selected on the basis of their impact on the model, number of sources and scatter. Normalized data series length and scatter of these parameters are presented in Fig. 2.
77 have been reported. To capture this uncertainty in the model, a database gathering the 150 input parameters, and their value according to different sources, was developed. 50 input parameters were selected on the basis of their impact on the model, number of sources and scatter. Normalized data series length and scatter of these parameters are presented in Fig. 2.
As can be observed in Fig. 2, it is important to acknowledge the level of variability in some of the input data, e.g. the embodied energy and carbon footprint of chemicals, land conversion emission factors, and yield values. This uncertainty associated with key input parameters can clearly lead to a wide range of model outcomes. In order to evaluate the uncertainty in these outcomes, the model was evaluated with the lower bound and upper bound of the selected parameters. If the data series contained more than five sources, and in order to avoid unlikely data (very extreme yield value for example), the lower bounds and upper bounds chosen were the 95% confidence interval bounds. To use the example of miscanthus productivity in Europe, the range 15.6–22.1 was used instead of the 4–60 found in the literature. For parameters with less than five sources, minimum and maximum values were taken as the uncertainty bounds. Tables 17–19 in Appendix C gather the average value and range of uncertainty of each input parameter of the model.
2.2 System boundaries for agriculture residues
For agricultural residues, it is assumed that straw is a by-product of wheat production. Whilst there are a variety of approaches to attribute the energy use and GHG emissions associated with the production of a crop, to agricultural residues,114–116 we have decided to assume that land conversion and farming contributions were not attributed to the residue. Straw LCA starts at its collection from the field and ends at the power plant boiler. However, as straw would have normally been left on the field to provide the crop with nutrients, additional fertilizers need to be applied to compensate for its removal. This has been included in the analysis following the work of Parajuli et al., where it was assumed that 30%, 100% and 100% of straw nitrogen, phosphorus and potassium content, respectively, was available to the field.56 Given the composition of wheat straw, extra NPK fertilizer input was then determined and included in the model.From this perspective, water consumption during wheat growth was not included in the evaluation of the water intensity of a wheat straw-based BECCS facility. However, wheat water footprint is presented in this analysis to compare the water footprint of energy dedicated crops with that of conventional crops such as wheat.
2.3 The question of marginal land
One of the input parameters of the model is land type. In order to include the potential effect of direct and indirect land use changes, a number of different land types were considered: grassland, cropland, marginal cropland, forests and wetland or peatland. In the debate on bioenergy land competition with food,117 the potential mobilisation of marginal land for bioenergy production has been investigated.68 Land classification usually differentiates forests, cropland, grassland, protected land, inland water and shores, urban land, and miscellaneous.118 Marginal lands are defined by low productivity lands unsuitable for agriculture. However, many studies have studied the potential of biomass production on marginal land,119–121 resulting in different conclusions as to biomass resilience to land type. In this analysis, biomass yield and land type were considered as independent variables. Considering the embedded range of uncertainties in yield values considered for each biomass, with data obtained on both suitable land crops122 and marginal lands,121 it was considered that this range already captured yield potential variability with land type.3 The water–energy–carbon nexus of BECCS
A water, energy and GHG balance was carried out on each selected biomass supplied from each selected region. As no data were found on willow growth in regions other than North America and Europe, the study of willow was limited to these regions.3.1 BECCS water intensity
| Country/region | City | Climate |
|---|---|---|
| Brazil | Sao-Paulo | Subtropical summer rainfalls |
| China | Zhengzhou | Subcontinental temperate |
| Europe (Netherlands) | Eindhoven | Oceanic temperate |
| India | Amritsar | Semi-arid |
| The USA | Orlando (Florida) | Subtropical summer rainfalls |
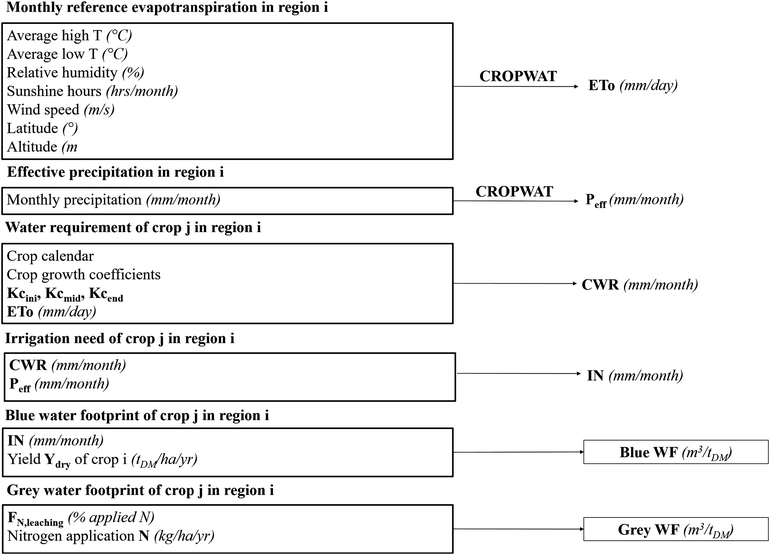
Precipitation was then collected from the FAO-clim database,123 based on weather stations located in the aforementioned cities. Data were retrieved for a period of ten years. In the FAO guidelines to compute crop evapotranspiration,47 water run-off has to be considered in the determination of the available water from rainfall. The FAO developed tool CROPWAT 8.0124 enables the calculation of effective precipitation in a given region, based on empirical linear correlations established on a specific soil type. CROPWAT default soil composition was used since soil type was not considered as an input parameter in the analysis. A 10 year average of monthly precipitation data was implemented in CROPWAT 8.0 to get the monthly effective precipitation in mm ha−1. The green water was then determined for a given crop in m3 tDM−1 of biomass using the crop annual dry mass yield in tDM ha−1.
 | (1) |
 | (2) |
 | (3) |
 | (4) |
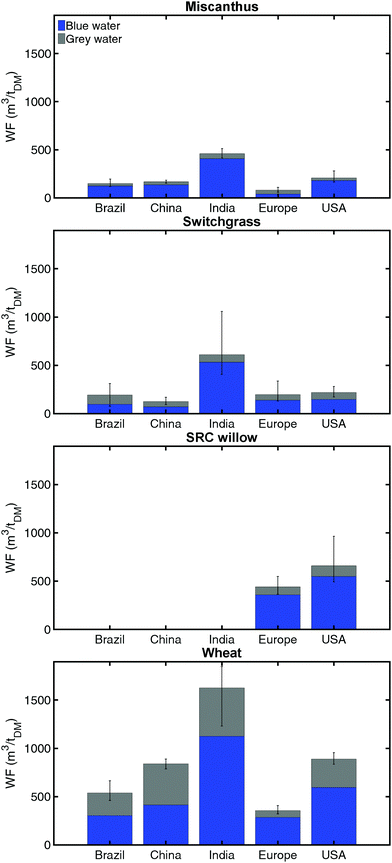
Given that the grey and blue water footprints represent the marginal amount of water required in addition to the green water (supplied by rainfall), these water footprints are presented in Fig. 3. Water requirements per hectare of energy dedicated crops were found to be higher on average than that of wheat: 834 mm ha−1 for miscanthus against 532 mm ha−1 for wheat. This is consistent with the BECCS water footprint analysis presented by Smith et al.,42 and can be explained in the difference in crop calendars and coefficients. However, as pointed out by Smith et al., this tendency changes when water footprints are expressed on a mass basis, due to the higher yield of energy dedicated crops as compared to that of conventional crops. Because of their low fertilizer input (impacts the grey water footprint) and relatively high yield, herbaceous biomass like miscanthus and switchgrass are thus found to be more sustainable water wise than conventional crops.
Among the energy dedicated crops, the water footprint of SRC willow was found to be slightly higher than that of switchgrass and miscanthus, which is mainly due to willow lower yield per hectare. However, the feasibility of irrigating and fertilizing SRC willow by waste water has been investigated in Sweden,125,126 which could considerably lower both grey and blue water footprints.
Energy dedicated crops are also characterized by a wider uncertainty range, relative to conventional crops. The difference lies in the greater uncertainty in input data (fertilizer use and yield) for the latter crops, derived from local experiments or simulations, as opposed to wheat data extracted from national or regional scale database on actual fertilizer use127 and yield.128 Switchgrass crop coefficients for example were not available in the literature, and, as suggested by Yimam et al.,129 coefficients of Sudan grasses,47 the closest species in terms of growth, were used.
The evaluation of the water footprint of agriculture products has been carried out in different studies,49 and with a growing interest in biomass production, studies now also focus on modeling or measuring water footprints of conventional and less-conventional biomass crops.51,90,129 Studies however can differ in input data (climate conditions, yield, fertilizer use, fertilizer leaching), boundaries (crop theoretical requirement, green and blue water footprints, grey footprint), and complexity of the model (water stress correction, soil water capacity and type). Keeping in mind these differences, Table 2 compares model results with those in the literature. Overall results were found to be consistent with the sample of values selected from the literature.
| Crop, regionsource | Boundaries | Literature data | Model |
|---|---|---|---|
| a Model lower bound–upper bound (average) results for Europe, Netherlands. b Model lower bound–upper bound (average) results for USA, Florida. c Model average result for Europe, Netherlands. d Model average result for USA, Florida. | |||
| Miscanthus, Netherlands51 | CWR (m3 tDM−1) | 334 | 175–248 (205)a |
| Miscanthus, Florida90 | GnWF + BWF (m3 tMW−1) | 330–495 (413) | 289–373 (321)b |
| Switchgrass, Oklahoma129 | CWR (mm year−1) | 521–786 (654) | 414c–693d |
| Willow69 | CWR (mm year−1) | 100–1790 (698) | 628c–1034d |
| Wheat50 | GnWF (m3 tMW−1) | 1277 | 728c–1712d |
| Wheat50 | BWF (m3 tMW−1) | 342 | 255c–530d |
| Wheat50 | GyWF (m3 tMW−1) | 207 | 62c—262d |
 | (5) |
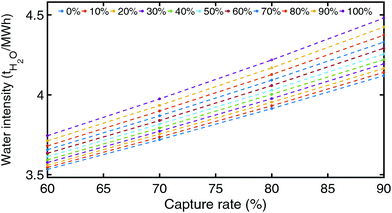
In a second instance, it is interesting to see how the water intensity of a coal + CCS system changes as coal is substituted by biomass, and CCS capture rate increases. Fig. 4 shows the system water intensity evolution as a function of co-firing proportion and capture rate.
It is observed in Fig. 4 that co-firing and capture rate increases the water intensity, as such a system is likely to be less efficient, hence to burn more fuel per MW h of power generated, and therefore need more cooling water.
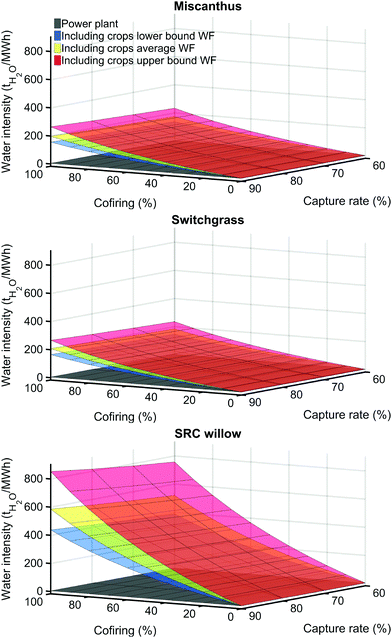
Given that the overall aim of this study is to evaluate BECCS performance across the entire supply chain, BECCS water intensity can also be calculated including the biomass water footprint WFWM on a wet biomass basis:
 | (6) |
It can be observed that the water footprint of the biomass supply chain far outweighs that of the actual power plant. At 90% co-firing and 100% biomass firing, the water intensity can be up to 150 times higher when including biomass production water cost in the case of willow. This highlights the importance of performing a whole-systems assessment of any given BECCS option in order to ensure its sustainability, and of including water footprint in this assessment.
3.2 BECCS energy intensity
• Farming indirect energy use which includes the embodied energy in different input (chemicals, seeds, fuel, power, fuel) used for crop establishment and maintenance,
• Farming direct energy (energy density) use which includes the use of fuel for product transportation and infield operations,
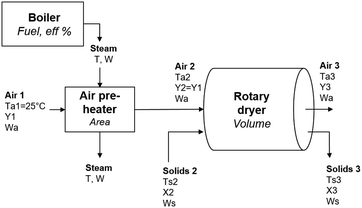
• Indirect (embodied energy) and direct energy use (energy density) of fuel or power input in biomass processing (size reduction, grinding, drying in rotary dryer, pelleting), transport and further pellet grinding at the power plant.
In order to compare the different contributions, each energy input was calculated per dry ton of pellet delivered to the power plant. This distinction between the embodied energy GJ tDM−1 harvested and delivered is important since it accounts for dry and wet mass loss along the supply chain. The methodology of embodied energy evaluation is presented in Fig. 23 in Appendix B, with equations detailed in Appendix A. Similarly to the water footprint, comparing the embodied energy results with literature results is only possible when the boundaries and assumptions (yield, moisture, transportation distance, etc.) of the models are known. For a proper comparison, the model was evaluated under the closest conditions to those of the source. The analysis presented in Table 4 indicates that our results are in good agreement with the literature ones.
| Crop, regionsource | Units | Results | Model |
|---|---|---|---|
| a Model lower bound–upper bound (average) results for Europe, production only no irrigation. b Model lower bound–upper bound (average) results for Europe, production only no irrigation, 4k transport. c Model lower bound–upper bound (average) results for Europe, production (bale), 100k transport, chopping and milling for combustion. d Model lower bound–upper bound (average) results for Europe, production (bale) no irrigation, 100k transport, drying and pelleting. e Model lower bound–upper bound (average) results for the US, production (bale or chopped). f Model lower bound–upper bound (average) results for the US, production (bale) no irrigation. g Model lower bound–upper bound (average) results for Europe, production and 50k transport. h Model lower bound–upper bound (Europe–US) results, production, drying (50%), pelleting and transport. i Drying 45% to 15%. j Model lower bound–upper bound (average) results for the US, collection (bale), 90k transport grinding, combustion. k Model lower bound–upper bound (average) results for Europe, collection (bale), 40k transport grinding, combustion. | |||
| Miscanthus, average67 | GJ tDM−1 | 0.52 | 0.31–1.02 (0.57)a |
| Miscanthus, Poland69 | GJ tDM−1 | 0.77 | 0.32–1.03 (0.58)b |
| Miscanthus, Germany76 | GJ tDM−1 | 1.25 | 0.86–2.00 (1.29)c |
| Miscanthus, Ireland65 | GJ GJHHV−1 | 0.28 | 0.08–0.14 (0.10)d |
| Switchgrass, US87 | GJ tDM−1 | 1.5–1.9 | 0.7–1.8 (1.1)e |
| Switchgrass, US79 | GJ tDM−1 | 0.2 | 0.4–1.4 (0.8)f |
| Switchgrass, US67 | GJ tDM−1 | 1.1 | 0.4–1.4 (0.8)f |
| Willow, Sweden131 | GJ tDM−1 | 0.86 | 1.5–2.6 (1.8)g |
| Willow, average67 | GJ tDM−1 | 1.5 | 0.5–1.5 (0.9)a |
| Willow, Belgium132 | GJ (ha year)−1 | 3–16 | 6–12 (9)a |
| Wood pellets, Australia and Russia94 | GJ tDM−1 | 1.13–7.5 | 3.7–8.0 (5.2)h |
| Willow, Poland69 | GJ tDM−1 | 0.16 | 0.58–1.67 (1.01)b |
| Wood pellets57 | MJ tH2O | 4455 | 4563i |
| Wheat straw, New Zealand133 | GJ GJe−1 | 0.24 | 0.16–0.30 (0.22)j |
| Wheat straw, UK97 | GJ GJe−1 | 0.44 | 0.16–0.29 (0.22)k |
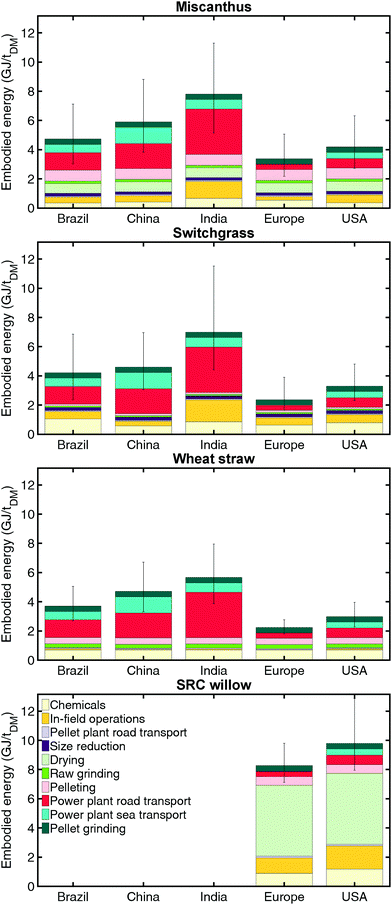
Fig. 6 shows the different energy contributions along the chain in GJ tDM−1 pellets, with the overall uncertainty range.
As long-distance transportation was considered in some cases (Brazil, China, India and USA to the UK) it is observed that transport accounts for a substantial share of biomass embodied energy, up to 66% in the case of wheat straw imported from India. Road transport, in particular, is what drives the transport cost. With a diesel fuel efficiency of about 1.65 MJ (tons km)−1 in road transport, and a heavy fuel oil (HFO) efficiency of 0.05 MJ (tons km)−1, 1 km of road shipping costs about 30 km of sea shipping. Therefore, transporting national biomass a distance of 400 km by road requires as much energy as shipping biomass over 13![[thin space (1/6-em)]](https://www.rsc.org/images/entities/char_2009.gif) 000 km. Taking the road distance between the farm to the harbour and the harbour to the power plant into consideration, an equivalent journey in energy cost could be for example transporting feedstock grown within 100 km of the American east coast to Drax power plant in the UK. This shows that global supply chains should be designed so as to minimise their reliance on road transport (ocean and rail being preferred), and that the development of low carbon (or carbon negative via BTL + CCS) transport fuels will be vital in ensuring the sustainability of BECCS. Focusing on road and ocean transport highlights the importance of coastal as opposed to inland regions for bioenergy production. However, this conclusion could be nuanced when exploring the combination of rail and barge transport as an alternative to road transport. This, as well as the impact of biomass storage, is left for future work. Willow stands out as unique in this study in that its embodied energy is primarily driven by drying. This is due to the fact that willow has a high average moisture content at harvest (52%), compared to 23% for miscanthus, 12% for switchgrass and 11% for wheat straw. The moisture target at the drying stage was set to 15% in this analysis, in order to meet the moisture requirement of 10% for the pelleting process, and assuming a 5% moisture loss during grinding. This explains the absence of drying requirement for both switchgrass and wheat straw. In another supply chain scenario (bale or chips), biomass could be dried at a higher moisture content. However transportation energy cost and boiler efficiency penalty in the power plant would automatically be higher, which could potentially offset the energy saved at the drying stage. The embodied energy associated with the chemicals used also constitutes an important share contributing to above 10% of the overall embodied energy. This is due to the fact that willow is characterised by a relatively low yield for a high chemical input rate. Pellet grinding cost represents between 5 and 17% of the total production energy cost. Williams et al. showed that treatment on biomass pellets could reduce this cost by as much as a factor of four with steam-exploded pellets, and up to a factor of 25 with torrefied pellets.34 The grinding cost of torrefied pellets would therefore be over five times lower than that of coal on a mass basis, and four times lower on an energy basis. Torrefaction was not included in this analysis, but the trade-off between torrefaction energy requirement and improved power plant performance with torrefied biomass is clearly an area which warrants further study. The relative magnitude of the uncertainty associated with the total embodied energy is observed to vary significantly between regions. For example, the calculated range for India is much greater than that for Europe. This observation is primarily driven by uncertainty in yield data. Yield data were widely available in Europe, which enabled the use of a 95% confidence interval as the uncertainty range, thus excluding extreme yield values. For India, yield values obtained from experiments in arid or semi-arid climates in other regions were used,73,134,135 but these data were scarce and highly variable.
000 km. Taking the road distance between the farm to the harbour and the harbour to the power plant into consideration, an equivalent journey in energy cost could be for example transporting feedstock grown within 100 km of the American east coast to Drax power plant in the UK. This shows that global supply chains should be designed so as to minimise their reliance on road transport (ocean and rail being preferred), and that the development of low carbon (or carbon negative via BTL + CCS) transport fuels will be vital in ensuring the sustainability of BECCS. Focusing on road and ocean transport highlights the importance of coastal as opposed to inland regions for bioenergy production. However, this conclusion could be nuanced when exploring the combination of rail and barge transport as an alternative to road transport. This, as well as the impact of biomass storage, is left for future work. Willow stands out as unique in this study in that its embodied energy is primarily driven by drying. This is due to the fact that willow has a high average moisture content at harvest (52%), compared to 23% for miscanthus, 12% for switchgrass and 11% for wheat straw. The moisture target at the drying stage was set to 15% in this analysis, in order to meet the moisture requirement of 10% for the pelleting process, and assuming a 5% moisture loss during grinding. This explains the absence of drying requirement for both switchgrass and wheat straw. In another supply chain scenario (bale or chips), biomass could be dried at a higher moisture content. However transportation energy cost and boiler efficiency penalty in the power plant would automatically be higher, which could potentially offset the energy saved at the drying stage. The embodied energy associated with the chemicals used also constitutes an important share contributing to above 10% of the overall embodied energy. This is due to the fact that willow is characterised by a relatively low yield for a high chemical input rate. Pellet grinding cost represents between 5 and 17% of the total production energy cost. Williams et al. showed that treatment on biomass pellets could reduce this cost by as much as a factor of four with steam-exploded pellets, and up to a factor of 25 with torrefied pellets.34 The grinding cost of torrefied pellets would therefore be over five times lower than that of coal on a mass basis, and four times lower on an energy basis. Torrefaction was not included in this analysis, but the trade-off between torrefaction energy requirement and improved power plant performance with torrefied biomass is clearly an area which warrants further study. The relative magnitude of the uncertainty associated with the total embodied energy is observed to vary significantly between regions. For example, the calculated range for India is much greater than that for Europe. This observation is primarily driven by uncertainty in yield data. Yield data were widely available in Europe, which enabled the use of a 95% confidence interval as the uncertainty range, thus excluding extreme yield values. For India, yield values obtained from experiments in arid or semi-arid climates in other regions were used,73,134,135 but these data were scarce and highly variable.
 | (7) |
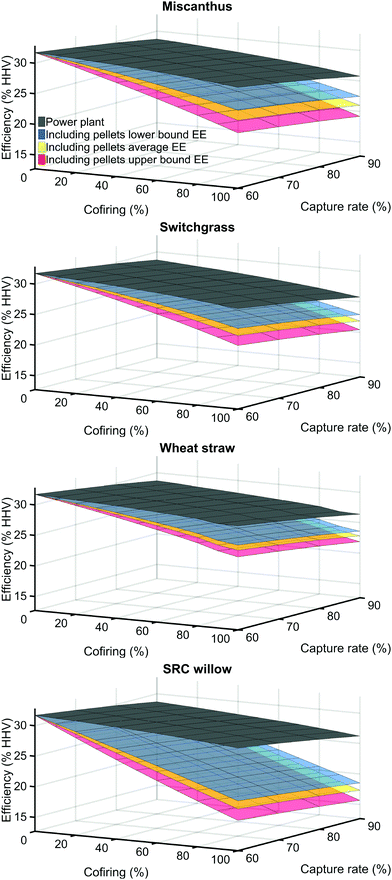
Similarly to the water intensity, it is interesting to see how this efficiency changes as we include biomass production energy use in the overall balance:
 | (8) |
The effect of including biomass supply chain is quite important, with the greatest efficiency loss (points) between 7.9% in the lower bound scenario, and 10.7% in the upper bound scenario in the case of willow, whose high supply chain embodied energy translates into a poor performance in terms of net chain efficiency. It is worth noting that if one considers BECCS as a climate mitigation technology, assuring that BECCS achieves a net negative CO2 balance at a low water cost is the main objective. In this regard, BECCS power generation performance is not as critical as the system's carbon and water intensities in the evaluation of BECCS potential for climate mitigation. However, the system efficiency and biomass supply chain energy cost will ultimately determine the marginal cost of a BECCS power plant. If we assume that BECCS plants might be expected to operate within a liberalised electricity market, a substantial marginal cost of generation would result in a decreased capacity factor for these plants, in turn limiting the amount of CO2 that would be removed from the atmosphere. This is something which will bear careful examination in the context of understanding how BECCS will operate in practice.
3.3 BECCS carbon intensity
• N2O emissions due to nitrogen-based fertilizer application,
• Negative emissions through biomass combustion and carbon capture and storage (BECCS),
• Direct and indirect land use changes.
As N2O has a global warming potential (GWP) 298 times (100 year-basis) higher than that of CO2, N2O emissions through nitrogen leaching and volatization from fertilizer application were also considered in the analysis. N2O emissions were calculated using the FEAT methodology,67 and the detailed equations are presented in Appendix A.
Biomass carbon footprint results were also compared with existing evaluations from the literature in Table 5, evaluating the model under the same conditions (transport distance, region if possible, process included, etc.). Again, Table 5 shows the great diversity in the results found in the literature, with carbon footprints found between 90 and 600 kgCO2 tDM−1. With an average relative error between the model mean values and the literature results under 30%, and considering the uncertainty range of results, the model results were considered consistent with those found in the literature.
| Crop, regionsource | Units | Results | Model |
|---|---|---|---|
| a Model lower bound–upper bound (average) results for Europe, production (bale), 100k transport, chopping and milling for combustion. b Model lower bound–upper bound (average) results for Europe, production (bale) no irrigation, 100k transport, drying and pelleting. c Model lower bound–upper bound (average) results for the US, production (bale or chopped). d Model lower bound–upper bound (average) results for the US, production only no irrigation. e Model lower bound–upper bound (average) results for US, production only no irrigation, 40k transport. f Model lower bound (av. grassland)–upper bound (av. forest) results for Europe, production, LUC, no irrigation, processing, 25–75k transport. g Model lower bound–upper bound (Europe–US) results, production, drying (50%), pelleting and transport. h Model lower bound–upper bound (average) results for Europe, collection (bale), 40k transport, grinding. | |||
| Miscanthus, Germany76 | kgCO2 tDM−1 | 111.8 | 97–237 (152)a |
| Miscanthus, Ireland65 | kgCO2 GJHHV−1 | 20.6 | 9.8-20.9 (14.5)b |
| Switchgrass, US87 | kgCO2 tDM−1 | 191–204 | 92–274 (162)c |
| Switchgrass, US79 | kgCO2 tDM−1 | 144.7–146.7 | 72–246 (139)d |
| Switchgrass, US67 | kgCO2 tDM−1 | 172 | 72–246 (139)d |
| Switchgrass, US136 | kgCO2 tDM−1 | 195–198 | 95–284 (168)e |
| Willow, UK–US99 | kgCO2 GJe−1 | 118–242 | 147–396f |
| Willow, average67 | kgCO2 tDM−1 | 89 | 87–253 (153)d |
| Wood pellets, Australia and Russia94 | kgCO2 tDM−1 | 143–594 | 166–603 (306)g |
| Wheat straw, UK97 | kgCO2 GJe−1 | 66 | 26–53 (38)h |
In order to evaluate biomass carbon negative potential, biomass carbon intensity in tCO2 tDM−1 biomass was also evaluated. For a BECCS power plant operating at a given capture rate, RCCS, biomass carbon intensity has the following expression:
 | (9) |
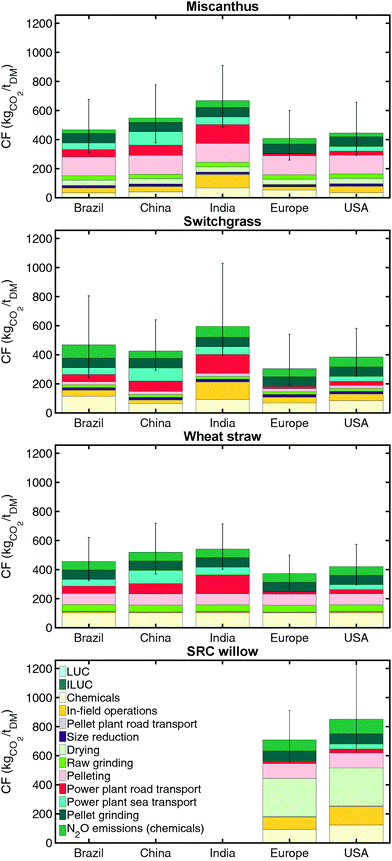
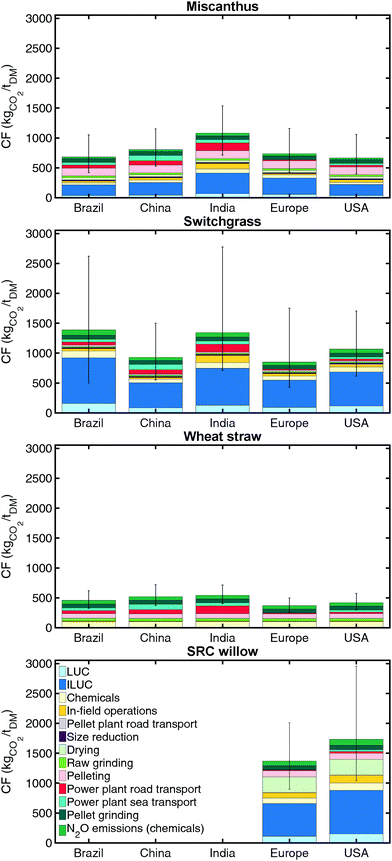
Carbon footprints of different feedstock from different regions are presented in Fig. 9.
The addition of N2O emissions, which have a large weight in the overall balance, underlines the double effect of fertilizers, both from their energy and carbon intensive production process, and from the subsequent emissions they cause after their application to the field. Biomass processing also has a higher weight in the carbon balance because of the relatively high electricity carbon intensity values chosen for this model – 470–800 kgCO2-eq MW h−1![[thin space (1/6-em)]](https://www.rsc.org/images/entities/char_2009.gif) .137,138 This input is highly dependent on the power source and region, and could be significantly improved in the context of a decarbonised electricity system – 50 kgCO2-eq MW h−1. Drying of high moisture biomass such as willow still constitutes an important contribution. Aside from management practices like natural open-field or storage drying, this cost could be reduced by substituting natural gas with biomass in rotary dryers.94,139 These options are further investigated in Section 4.
.137,138 This input is highly dependent on the power source and region, and could be significantly improved in the context of a decarbonised electricity system – 50 kgCO2-eq MW h−1. Drying of high moisture biomass such as willow still constitutes an important contribution. Aside from management practices like natural open-field or storage drying, this cost could be reduced by substituting natural gas with biomass in rotary dryers.94,139 These options are further investigated in Section 4.
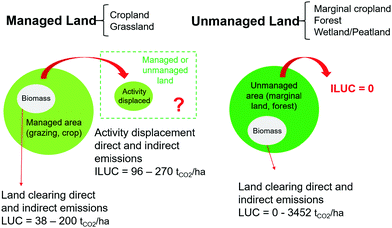
3.3.1.1 Effect of direct and indirect land use changes. As illustrated in Fig. 10, this analysis provides an evaluation of the potential impact direct and indirect land use change effects would have on the system.
To account for direct land use changes, conversion emission factors in tCO2 ha−1 for each land type were taken from the literature.102,103 For indirect land use changes however, conversion factors also depend on the initial use of the land. Land types were thus classified into two categories; managed land, i.e., already allocated to an activity, and unmanaged land. If converting part of a managed land – cropland or grassland – to biomass production, an ILUC conversion factor in tCO2 was attributed. When converting a land unallocated to any activity, ILUC was considered to be zero. ILUC conversion factors in tCO2 ha−1 are not found as such in the literature. Indirect land use changes have been thoroughly investigated in the context of biofuels in which conversion factors are expressed in tCO2 MJ−1, and are a function of the biofuel energy yield MJ (ha year)−1, time horizon (in years), fraction of land displaced (in %ha) and average emission factor resulting from the activity displaced (in tCO2 ha−1). Two different sources were used: an analysis by Plevin et al. based on corn bioethanol in the US,103 and an analysis from Overmars et al. based on bioethanol production in Europe, from three different feedstocks: wheat and sugar beet grown in Europe and sugarcane imported from Brazil and Pakistan.107 As ILUC factors are expressed in kgCO2-eq MJ−1 of biofuels in both analysis, the data provided in the studies were used to derive land ILUC factors in kgCO2-eq per hectare cultivated for bioenergy. These factors can then be used independently from biomass yield and project time horizon. When average net displacement factors (ha displaced/ha of biofuels) and emission factors (tCO2-eq ha−1) were provided,103 the land ILUC factor was obtained by multiplying these two parameters. When the data provided were less straightforward,107 the land ILUC factor was obtained by multiplying the ILUC factor by the time horizon and bioenergy yield. Plevin et al. described two additional analyses on US bioethanol from maize140 and corn,108 and these results were also included in the ILUC coefficient data set to ensure the consistency of the statistical analysis. Fig. 11 provides further details on the methodology and data used.
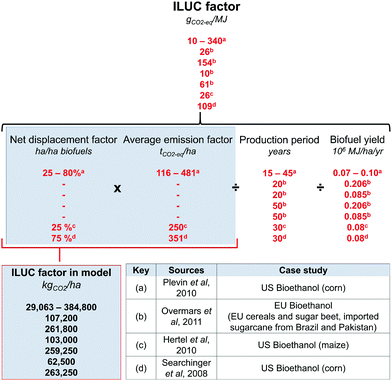 | ||
| Fig. 11 Methodology for the derivation of ILUC conversion factors in kgCO2-eq ha−1. Values derived from Plevin et al., Searchinger et al., and Hertel et al. were obtained for bioethanol production in the US,103,108,140 whereas the results from Overmars et al. are the lower and upper bounds obtained for bioethanol production in Europe, considering three different feedstocks: wheat and sugar beet grown in Europe and sugarcane imported from Brazil and Pakistan. | ||
In this analysis net displacement and emission factors were considered the same for all managed land types (grassland or cropland), biomass types and regions. This is a first estimation to give indications as to the potential impact of including land use change. Applying this analysis to a certain case study in order to provide precise insight for a given region would require the use of region specific coefficients.
For each land type, the initial carbon debt, DC, including both direct and indirect land use changes, was then known. In this analysis, the time horizon chosen was 50 years, as this was deemed to be sufficiently long to give a fair evaluation of every option. The carbon debt was expressed in kgCO2 tDM−1 when dividing by the overall amount of dry biomass delivered by a hectare of land over 50 years:
 | (10) |
3.4 BECCS net carbon intensity
Carbon intensity is defined as the power plant emissions per MW h of electricity produced. A key assumption in this analysis is that the amount of CO2 absorbed by the biomass during its growth equates the amount of CO2 released upon biomass combustion. Emissions resulting from biomass combustion are thus considered to be zero. As a result, carbon intensity is calculated based on the fuel carbon content, CF, the biomass carbon content, CB, and the co-firing proportion, Cf: | (11) |
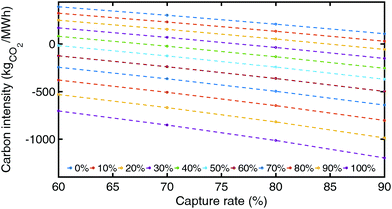
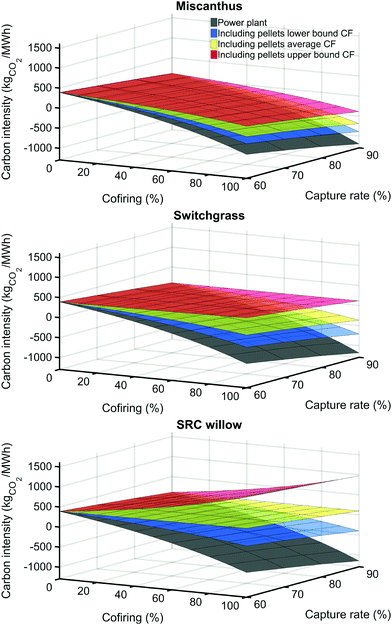
As illustrated in Fig. 13, carbon intensity decreases as coal gets displaced by biomass and carbon capture rate decreases. To the power plant carbon intensity are added biomass supply chain CO2 emissions:
 | (12) |
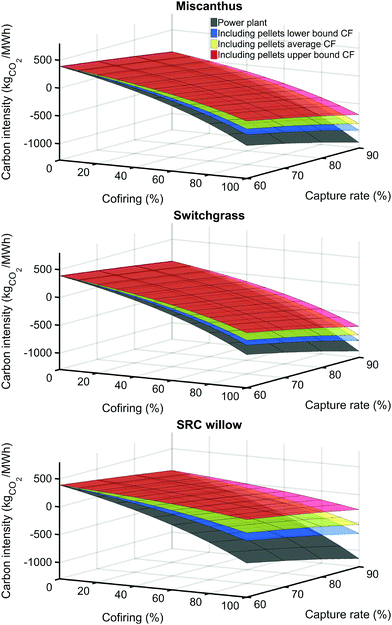
As can be observed from Fig. 14 and 15, whilst the majority of scenarios result in the net removal of CO2 from the atmosphere, no two scenarios achieve an equivalent amount of net CO2 removal. Importantly, it can be observed that some scenarios, such as those relying upon willow in Fig. 18, appear to be net carbon positive, resulting in the net emission of up to 1200 kgCO2 MW h−1. For comparison, an unabated coal-fired power plant might emit between 700 and 1000 kgCO2 MW h−1. Thus, if the wrong choices are made throughout the supply chain, BECCS could indeed be substantially more carbon intense than an unabated coal-fired power plant. This is one of the core results of this study. At 90% co-firing, a willow-based BECCS system is, in the mean scenario, carbon negative within the 20–100% co-firing range with no land use changes, carbon negative within the 30–100% co-firing range with LUC, and always carbon positive with ILUC. In practical terms, this narrows the feasible range of power plant operability – capture rate and co-firing proportion – for the system to be carbon negative, and ultimately decreases its flexibility. However, it is important to notice that BECCS systems including ILUC can still be carbon negative in the average scenario, within the 30–100% co-firing range for a miscanthus-based system, and 40–100% for a switchgrass-based system, at 90% capture rate. Limiting the effects of indirect land use changes as well as assuring high yield and low fuel, power and chemical input during biomass production will be capital for the BECCS overall balance to be negative.
3.5 BECCS net carbon efficiency
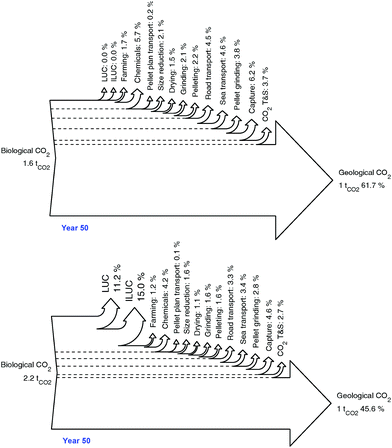
If BECCS were a perfect system, one ton of CO2 captured biologically would equate one ton of CO2 sequestered geologically. However, this is not the case, and GHG direct and indirect emissions throughout the BECCS value chain carbon, as well as biomass dry mass loss, must be considered as this “carbon leakage” will decrease the net amount of CO2 removed from the atmosphere. From this perspective, carbon intensity can also be equated to carbon efficiency: how many tons of CO2 must be sequestered biologically in order to store 1 ton of CO2 geologically? Carbon efficiency can then be interpreted in terms of carbon negativity: systems whose carbon efficiency is over 50% are carbon negative. The carbon efficiencies of a switchgrass-based system from a marginal land and a central grassland are represented by Fig. 16. For the purpose of this analysis, CO2 transport and storage was included in the BECCS value chain, assuming an energy use and subsequent GHG emissions resulting in a 6% CO2 loss.136As can be observed in Fig. 16, BECCS carbon efficiency reduces from 62% (marginal land) to 46% (grassland) when adding LUC and ILUC, with the latter accounting for over 26% of the carbon leakage. Upon adding land use changes, the facility is thus no longer carbon negative. This emphasizes the fact that though efforts throughout BECCS supply chain must be made to reduce further carbon leakages (chemicals, transport, carbon capture), a better understanding and control of land use changes will be necessary to maximise BECCS carbon efficiency.
We have demonstrated the importance of including the biomass supply chain in the evaluation of the thermo- and hydrodynamic efficiencies, and carbon intensity of the overall system. Chemicals, road transport, drying and grinding were identified as important leakages in BECCS efficiencies, though negligible when compared to land use change effects. In the next section, a dynamic accounting of the GHG emissions is performed to evaluate BECCS efficiency at removing CO2 from a time perspective.
4 BECCS dynamic GHG emission profile
We define the number of years required for the power plant cumulative emissions to reach zero as the biomass carbon breakeven time. To assess BECCS sustainability from a plant lifetime perspective and evaluate BECCS carbon breakeven time, a dynamic carbon balance was performed on the system.4.1 Single dynamic balance
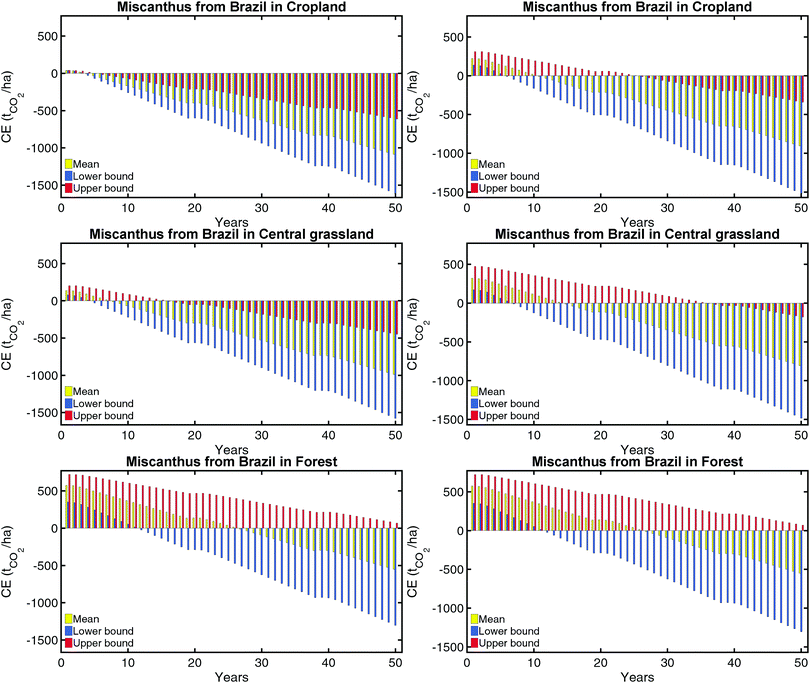
In this model, the land is cleared and the crop established at year 1, thus generating an initial carbon debt. The crop is harvested every n years, and therefore further biomass processing, transport and capture are accounted for until the end-of-life for that crop in year 1 + N which is the crop end of life. As the dynamic balance is performed from the perspective of the BECCS power plant, the balance is made over 50 years, which is considered to be an upper bound of the power plant lifetime. Fig. 17 shows CO2 cumulative emissions from a miscanthus fired BECCS power plant, from land conversion (year 1) to the power plant end of life (year 50).Miscanthus imported from Brazil breaks even after 3, 7 and 26 years, if grown on a cropland, central grassland and forest, respectively. When grown on a Brazilian forest, miscanthus is the only crop reaching carbon break even time before year 50. When including the effects of indirect land use changes for cropland and grassland in Fig. 17, carbon breakeven time increases by seven years for cropland and grassland.
4.2 Multiple dynamic balances
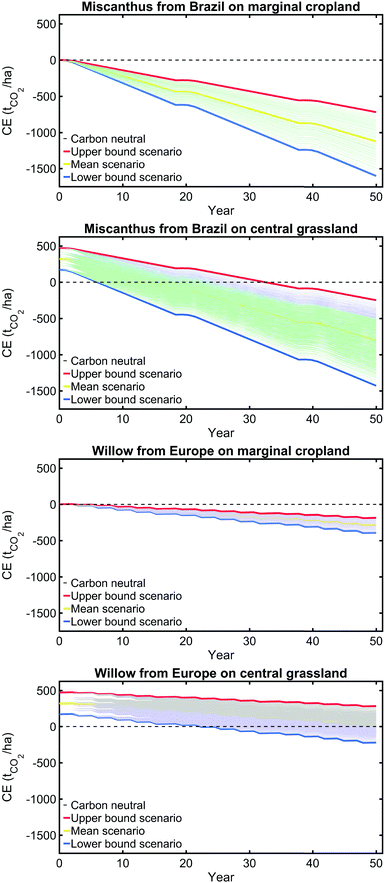
Rather than simply representing average, lower bound and upper bound scenarios, it is important to evaluate the whole scope of BECCS outcomes. Four case studies were selected for this analysis:(1) Case A: miscanthus from Brazil on marginal land (no LUC and ILUC),
(2) Case B: miscanthus from Brazil on central grassland (LUC and ILUC),
(3) Case C: willow from Europe on marginal land (no LUC and ILUC),
(4) Case D: willow from Europe on central grassland (LUC and ILUC).
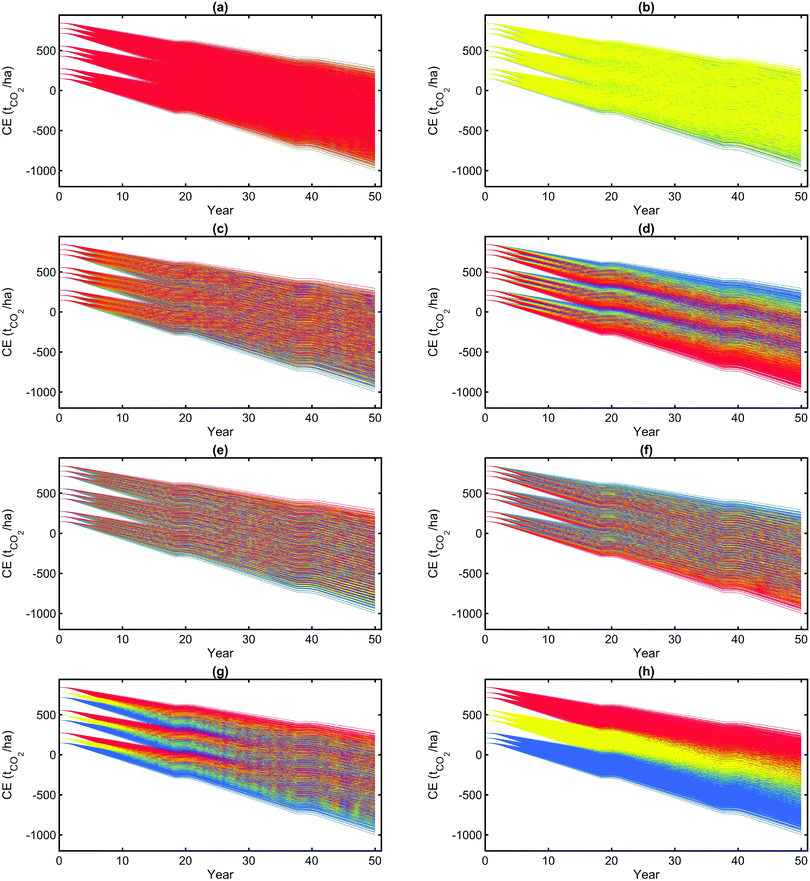
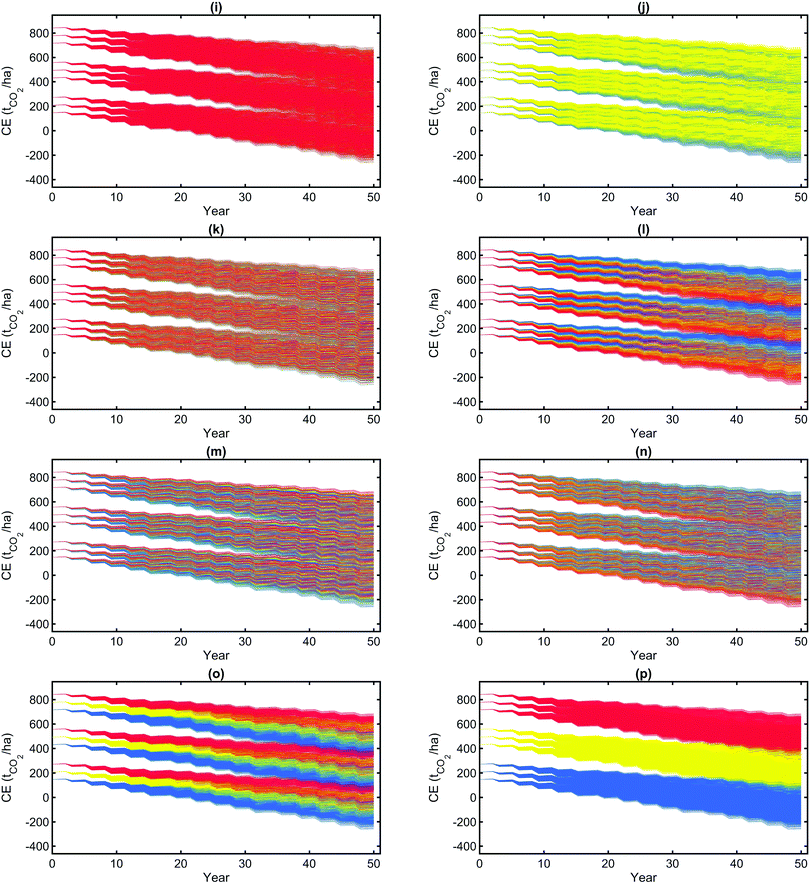
Fig. 18 represents the 729 outcomes when evaluating the model with the low, average and high values of biomass moisture content, carbon content, electricity carbon footprint, LUC conversion factor and ILUC conversion factors in those four case studies.
We can note from this analysis the diversity of possible outcomes, associated with a BECCS facility, as a function of the decisions made along the supply chain. In the case of miscanthus, which showed the lowest carbon footprint in the steady-state analysis, all scenarios are carbon negative over 50 years on a marginal land, with a carbon negative potential ranging from 0.7 to 1.6 ktCO2 ha−1 captured over 50 years. When including land use effects, the number of scenarios leading to a capture potential greater than 0.5 kt ha−1 was reduced to 648 out of 729, but no scenario led to a dynamic carbon positive balance. For the willow case study that showed higher carbon footprints on a steady-state basis, the dynamic carbon balance was always negative on a marginal land, with a carbon capture potential ranging from 190 to 390 t ha−1 over 50 years. On a central grassland however, the number of carbon negative scenarios dropped to 223. In terms of carbon breakeven time, without land use effects, the time required for BECCS to be negative varied on average between 1 year for miscanthus and 3 years for willow. This became on average 15 times longer for miscanthus and willow when including land use changes. These results are presented in Table 6.
| Outcomes | Units | A | B | C | D |
|---|---|---|---|---|---|
| Positive scenarios | 0 | 0 | 0 | 460 | |
| Negative scenarios | 729 | 729 | 729 | 269 | |
| CO2 removed | Mean (t ha−1) | −1124 | −805 | −288 | 31 |
| Min (t ha−1) | −1600 | −1429 | −392 | −222 | |
| Max (t ha−1) | −718 | −248 | −186 | 285 | |
| Breakeven time | Mean (years) | 1 | 15 | 3 | 46 |
| Min (years) | 1 | 6 | 3 | 22 | |
| Max (years) | 2 | 32 | 3 | >50 | |
4.3 Sensitivity analysis and alternative scenarios
A sensitivity analysis was carried out in order to rank the parameters in terms of level of impact on the GHG dynamic emission profile. The model was run with the lower, mean and upper values of 8 parameters: biomass carbon content, biomass moisture content, rate and footprint of chemicals, fuel emission factors and carbon footprint, electricity footprint, yield, LUC and ILUC conversion emission factors. Fig. 19 presents the dynamic emission profile of the 6561 scenarios simulated for a miscanthus-based BECCS facility, coloured differently depending on the corresponding parameter. For each parameter, the profiles corresponding to the lower bound scenario are coloured in blue (red for yield and carbon content), to the mean scenario in yellow, and to the upper bound scenarios, in red (in blue for yield and carbon content).As can be observed from both figures, ILUC is the primary determining factor, followed by LUC, yield, electricity footprint, biomass carbon content and biomass moisture content. Compared to these parameters, the fuel emission factor and carbon footprints as well as chemicals rates and carbon footprints were found to have a limited impact on these results. The same analysis was performed on a willow-based system. The results are presented in Fig. 24 in Appendix D.
It is evident that LUC and ILUC conversion factors should be carefully evaluated on a case by case basis, but so should be biomass yield, composition and electricity footprint. In practice, a crop yield is a complex function of a range of parameters, including climate, biomass properties, soil type, nutrients and water availability.141
These results also indicate ways of improving BECCS sustainability. In order to evaluate the potential for improvements in BECCS, the following alternate scenarios were investigated:
(1) Organic chemicals (no carbon footprint),
(2) Biodiesel for in-field activities (100%) and road transport (blend 20% with conventional diesel B20),
(3) Bioethanol with CCS for in-field activities (blend 25% with conventional gasoline E25) and road transport (blend 25% with conventional gasoline E25). We assume that bioethanol carbon footprint is −100 gCO2 MJ−1 of fuel used.111
(4) Carbon neutral electricity,
(5) Drying with biomass rather than natural gas.
Ranges of uncertainty of chemical footprint and fuel emission factors were relatively small compared to other parameters, which could explain their limited impact observed in the sensitivity analysis. For this reason, those parameters were included in the alternate scenarios. Table 7 summarizes the ranges of impact on BECCS cumulative capture potential over 50 years in tCO2 year−1 for each alternative scenario, as compared to the base case.
| Case study | Base case | Sc1 | Sc2 | Sc3 | Sc4 | Sc5 |
|---|---|---|---|---|---|---|
| A | −1124 | −1158 | −1192–(−1119) | −1246 | −1364 | −1158 |
| B | −805 | −839 | −873–(−800) | −927 | −1044 | −824 |
| C | −288 | −316 | −313–(−306) | −345 | −348 | −343 |
| D | 31 | 3 | 6–13 | −26 | −29 | 132 |
Due to the uncertainty around biodiesel carbon footprint, and the proportion limit to 20% in volume for biodiesel/diesel blend in road transport, bio-diesel impact was limited and even positive in some cases. With bioethanol + CCS, in-field operations become carbon sinks rather than carbon sources, thus decreasing the overall CO2 emissions of the value chain. The use of bioethanol + CCS in transport further decreases the overall carbon footprint of biomass, though carbon negative road transport could not be reached due to the limitation on bioethanol proportion in engines. Going towards low carbon transport or even carbon negative transport to improve BECCS sustainability will only be possible with dedicated bioethanol engines. However, increasing the use of organic fertilizers for farming and carbon neutral electricity for biomass processing could bring substantial sustainability improvements to the BECCS value chain. Similarly to biodiesel, drying with biomass was found to have both a positive and a negative impact. When land use changes are included in the case of willow, biomass carbon footprint is found to be higher than that of natural gas, hence the negative effect (decrease) on the capture potential, rather than a positive effect (increase). Most importantly, a carbon positive case study, such as willow on central grassland, could turn carbon negative by switching to carbon neutral electricity for biomass processing and carbon negative bioethanol for farming and transport. This demonstrates the importance of intelligent management – organic chemicals, carbon neutral electricity, low carbon or carbon negative fuels for transport and drying – to ensure bioenergy sustainability. This supports the assertion raised in Dale et al. that bioenergy can be sustainable when carefully managed.142
4.4 Implications for resource mobilisation
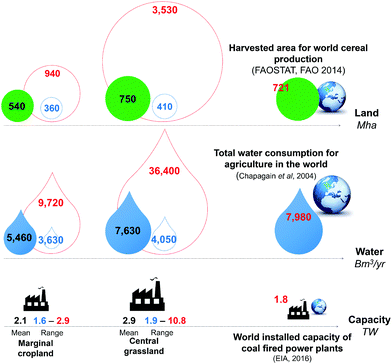
In a given case study, the outcomes of BECCS sustainability analysis were observed to be very variable. In practical terms, this means that resource mobilisation to meet a mitigation target could vary widely from project to project. In order to stay within the 2 °C scenarios, studies showed that the required level of deployment for BECCS was of the order of 3.3 GtC year−1 by 2100.42 We evaluated the biomass, land, water, energy and nutrient requirements of BECCS given this annual carbon removal target. Smith et al. carried out a similar meta analysis in order to compare switchgrass-based BECCS and afforestation, given a removal target of 1 GtC year−1.83 The difference from our analysis is that biomass supply chain results were obtained from various sources in the literature136 and did not include direct and indirect land use changes. We performed the calculations on switchgrass and miscanthus from US and Brazil marginal lands (no direct and indirect land use changes), based on the same target and system boundaries in order to check the consistency of our results with the literature.42,83 The study by Smith et al. was not location and biomass specific, but most of the results were obtained for miscanthus.42 Results for switchgrass in Smith et al. were adapted to the 3.3 GtC year−1 target.83 BECCS scenarios resulting in very variable dynamic emission profiles translated into different resource requirements in terms of land, water and energy given a fixed mitigation target. As can be seen in Table 8, removing 3.3 Gt of carbon per year from the atmosphere using BECCS would require the annual mobilisation of 9 and 13 GtDM of processed switchgrass, 60 to 371 Mt of nutrients (N and P2O5), 1250 to 2490M ha of marginal land in the US, and 7800 to 15![[thin space (1/6-em)]](https://www.rsc.org/images/entities/char_2009.gif) 700B m3 of water. As a means of comparison, 17 Mt of N and P2O5 nutrients are used annually in the US, 721M ha of land are harvested for cereal production in the world128 (2014), and 7980B m3 of water is withdrawn – including green water – for the world agriculture.143 This raises the question of water and land availability and whether marginal land will be sufficiently available and productive to enable biomass production at this scale, so as to avoid direct and indirect land use change effects. Using a higher yield crop such as miscanthus would lower the land and water requirements to 360–940M ha and 3600–9700B m3, respectively.
700B m3 of water. As a means of comparison, 17 Mt of N and P2O5 nutrients are used annually in the US, 721M ha of land are harvested for cereal production in the world128 (2014), and 7980B m3 of water is withdrawn – including green water – for the world agriculture.143 This raises the question of water and land availability and whether marginal land will be sufficiently available and productive to enable biomass production at this scale, so as to avoid direct and indirect land use change effects. Using a higher yield crop such as miscanthus would lower the land and water requirements to 360–940M ha and 3600–9700B m3, respectively.
Furthermore, BECCS would need to be deployed at the scale of 1.7 to 2.4 TW. For reference, at the time of writing, the total installed coal-fired thermal power capacity is 1.8 TW. Conversion of both coal and natural gas-fired power plants to dedicated biomass and biogas might well be necessary to meet these deployment targets. Furthermore, assuming a base load operation of the BECCS unit (85% load factor), this deployed capacity would represent an annual power generation of between 9700 and 14![[thin space (1/6-em)]](https://www.rsc.org/images/entities/char_2009.gif) 600 TW h, or between 44% and 68% of the global power demand in 2012.144 This result is highly dependent on the BECCS annual load factor, and while a BECCS unit should run at full capacity to remove a maximum amount of CO2 from the atmosphere, this value could potentially be dictated by the system short run marginal cost relative to that of the other power sources within the electricity market. Policies rewarding CO2 removal from the atmosphere will be crucial in increasing BECCS competitiveness relative to other technologies, and in turn will maximise the BECCS load factor. However, the BECCS supply chain energy requirement must be subtracted from the annual power generation. Within the uncertainty range, BECCS net energy balance could be both positive and negative, which needs to be considered when talking about BECCS energy supply potential.
600 TW h, or between 44% and 68% of the global power demand in 2012.144 This result is highly dependent on the BECCS annual load factor, and while a BECCS unit should run at full capacity to remove a maximum amount of CO2 from the atmosphere, this value could potentially be dictated by the system short run marginal cost relative to that of the other power sources within the electricity market. Policies rewarding CO2 removal from the atmosphere will be crucial in increasing BECCS competitiveness relative to other technologies, and in turn will maximise the BECCS load factor. However, the BECCS supply chain energy requirement must be subtracted from the annual power generation. Within the uncertainty range, BECCS net energy balance could be both positive and negative, which needs to be considered when talking about BECCS energy supply potential.
It can be observed from Table 8 that the model shows very good agreement with the literature for switchgrass.83 However, though the model land requirement for miscanthus is in good agreement with the literature,42 water requirement and energy supply are found to be very different. The difference in water requirement can be explained by the different model assumptions. In Smith et al., the contribution of bioenergy production to the BECCS water footprint is evaluated at 80 m3 tC−1 year−1, and the power plant + CCS contribution around 450 m3 tC−1 year−1. This study assumes an evapotranspiration value for bioenergy between 1176 and 1822 m3 tC−1 year−1.42 For reference, this value compares well with our model for which miscanthus evapotranspiration is 1240 m3 tC−1 and the total water footprint (evapotranspiration + grey water) 1635 m3 tC−1. The value of 80 m3 tC−1 is then obtained by subtracting the evapotranspiration of a reference grassland (the counterfactual) from bioenergy evapotranspiration.42 However, if considered in the water balance, the counterfactual – leaving the land as is – would also need to be considered in the carbon balance, which would mean accounting for the CO2 which would have been captured if the land had been left as is. As this was considered out of scope in this analysis, total evapotranspiration + grey water was selected as the biomass feedstock water footprint. Furthermore the model evaluates the power plant + CCS water contribution at 14 m3 tC−1. It is assumed that the choice of a once-through cooling system – whose water consumption factor can be 30 times higher than that of a cooling tower system – as opposed to a recirculating cooling tower is the explanation behind this difference. For reference, the model would result in a power plant water requirement of 425 m3 tC−1 with a once-through system.
![[thin space (1/6-em)]](https://www.rsc.org/images/entities/char_2009.gif) 700B m3 year−1, and 60 and 370 Gt of nutrients for a switchgrass-based system, which is in agreement with the literature. Such an installed capacity would result in a net energy output of 15 EJ year−1 on average, but could also require 1 EJ year−1 in the upper bound case. In the case of miscanthus, water requirement could be lowered to between 3600 and 9700, land requirement to 360 and 940M ha. However a miscanthus based system could lead to a net energy use of 37 EJ year−1 in the upper bound scenario
700B m3 year−1, and 60 and 370 Gt of nutrients for a switchgrass-based system, which is in agreement with the literature. Such an installed capacity would result in a net energy output of 15 EJ year−1 on average, but could also require 1 EJ year−1 in the upper bound case. In the case of miscanthus, water requirement could be lowered to between 3600 and 9700, land requirement to 360 and 940M ha. However a miscanthus based system could lead to a net energy use of 37 EJ year−1 in the upper bound scenario
| Metrics | Switchgrass US | Smith et al. (2013) | Miscanthus Brazil | Smith et al. (2016) |
|---|---|---|---|---|
| Nb plants | 3413–4852 (3887) | 3323–5758 (4104) | ||
| Biomass (GtDM year−1) | 9.2–13.1 (11.1) | 9.0–15.5 (10.5) | ||
| Water (Tm3 year−1) | 7.8–15.7 (10.4) | 5.3–24.4 (14.5) | 3.6–9.7 (5.5) | 0.072 |
| Land (M ha) | 1245–2392 (1630) | 726–3270 (1910) | 363–943 (538) | 380–700 |
| Energy (EJ year−1) | −22.4 to 1.0 (−15.1) | −15.3 to 37.0 (−0.01) | −170 | |
| Nitrogen (Mt year−1) | 61–210 (112) | 21–92 (42) | ||
| Phosphate (Mt year−1) | 0–161 (55) | 8–98 (34) | ||
| Sources | 83 | 42 | ||
As for BECCS energy supply, BECCS was found to yield 170 EJ year−1 at this deployment. However, this value does not include BECCS energy requirement which needs to be subtracted from BECCS energy supply.
The same analysis was performed on grassland instead of marginal land, to account for land use changes. Fig. 20 shows the amount of land, water, and BECCS capacity in order to meet the 3.3 GtC annual removal target, with (central grassland) and without (marginal land) land use change. Upon including land use changes (e.g., considering grassland instead of marginal land), resource mobilisation increases up to four times in the upper bound scenario.
4.5 Comparison with other negative emission technologies
The lower bound and upper bound results from the previous section were used to compare BECCS performance with other negative emission technologies, such as afforestation and Direct Air Capture and Storage (DACS). For afforestation, data were directly used from Smith et al. (2013).83 As land requirement was expressed in ha year−1, the resulting afforested surface over 50 years was considered in order to compare with BECCS land requirement. Data from the literature for land and energy requirements42,145–148 were adapted to this analysis. Table 9 summarizes these results.| Metrics | BECCS | Afforestation | DACS |
|---|---|---|---|
| Nb plants | 3323–5758 | 3320 | |
| Water (Tm3 year−1) | 3.6–15.7 | 5.3–11.6 | |
| Land (M ha) | 363–2392 | 1110–2480 | 0.04–3.3 |
| Energy (EJ year−1) | −22.4 to 37.0 | 81–274 | |
| Nitrogen (Mt year−1) | 21–210 | 0.3–2.4 | |
| Phosphate (Mt year−1) | 0–161 | 0.7–2.5 | |
| Sources | 83 | 42 and 145–148 | |
Given a CO2 annual removal target, afforestation resulted in an overall similar land and water use than that of BECCS, though its land requirement corresponded to the upper range of BECCS results. Within the uncertainty range, BECCS net energy balance could be both positive and negative, but even when positive its energy intensity was found to be lower than that of DACS. DACS land requirement was several orders of magnitude lower than that of BECCS. However, the carbon footprint of the electricity used in the process, which would have had an impact on DACS carbon efficiency, was not considered in the analysis. Using photovoltaic power could limit the carbon efficiency drop, but would on the other hand substantially increase DACS land requirement. These trade-offs will have to be considered in detail when comparing BECCS and DACS suitability for climate mitigation.
4.6 Implications for policy makers
The main conclusion of this analysis is the great variability in the possible outcomes of a BECCS project, both in terms of its cumulative net carbon removal over its lifetime, and also the time required for a given facility to start removing CO2 from the atmosphere. Determining the sustainability or otherwise of a given BECCS project as a candidate for climate change mitigation is therefore only possible on a case-to-case basis. This has substantial implications for the regulation of those systems. The efficiency with which a BECCS project would remove CO2 from the atmosphere is a first issue. Among carbon negative scenarios, it was observed that BECCS carbon intensity per hectare could vary greatly, which in turn means a great difference in the amount of resources (water, land, energy, power plants) used to remove a ton of CO2 from the atmosphere. For BECCS to be a valuable asset to the system, a minimum CO2 removal efficiency might have to be defined to differentiate inefficient from efficient systems, therefore excluding scenarios that are not worth pursuing.In terms of time horizon, depending on the conditions and due to biomass initial carbon cost to the ecosystem, BECCS does not necessarily start being a net carbon sink from year 1. If we consider that BECCS provides a service to the market – removing CO2 out of the atmosphere, therefore avoiding future costs associated with climate change adaptation, it is reasonable to suggest that this service could be remunerated. However, it is also reasonable to suggest that this remuneration does not start until the facility is actually removing CO2 from the atmosphere. Given that this breakeven time could be several years, this could well serve to complicate the delivery of BECCS projects, as the incentive for investing in BECCS might be otherwise insufficient.
Finally, in the case of a global deployment of an unintegrated BECCS value chain, this carbon crediting scheme would also need to acknowledge the diversity of stakeholders – biomass production, power generation, CO2 transport and storage, and possibly countries, involved in the BECCS value chain.
5 Conclusion
A modeling tool was developed in order to calculate the water footprint, embodied energy, and carbon footprint of a range of biomass fuels – miscanthus, switchgrass, willow, and wheat straw – grown on different land types and imported from different regions of the world. Among energy dedicated crops, herbaceous biomass (miscanthus and switchgrass) was found to be more sustainable with respect to the three metrics, mainly because of the lower yield and higher moisture content of woody biomass. Overall, the most important contributors to embodied energy were biomass transport for low moisture biomass, and transport, chemical input and processing for high moisture biomass. Drying and grinding energy costs are physically bound by biomass properties. Other biomass processing practices such as natural field drying or torrefaction for grinding will have to be investigated to reduce these inputs. As for carbon footprint, contributions were more balanced, with a significant contribution from fertilizers. The inclusion of direct and indirect land use changes however had a drastic impact, accounting for over 50% of biomass carbon footprint. It is important to note that in this analysis, representative yield values were taken from the literature. In practice yield is a complex function of various parameters including climate, soil type, nutrients and water availability and management practices. The interdependence of parameters would have to be included for more accurate results.Supply chain results were implemented in the context of a 500 MW BECCS facility to evaluate the impact of the biomass supply chain on the overall plant carbon intensity, water intensity and energy efficiency. The results showed a substantial impact on water and carbon intensities at high co-firing proportions, and to a smaller extent on efficiency. Including direct and indirect land use changes had a great impact on the power plant carbon intensity, narrowing the range of operability for the power plant to be carbon negative.
A dynamic carbon balance was carried out over a 50 year period to evaluate a BECCS power plant carbon negative potential over its lifetime in different biomass–region–land type scenarios. Depending on the conditions of the simulation, carbon breakeven time could vary from 1 (marginal cropland) to 35 years (central grassland) for miscanthus from Brazil, and from 6 to over 50 years for willow from Europe. Within the uncertainty bounds considered for the input data, the key factors impacting the results were identified to be the land conversion factors, electricity carbon footprint, biomass yield and moisture content. The investigation of alternative scenarios such as using carbon neutral electricity, organic chemicals and bioethanol + CCS gave indications as to BECCS potential margin of improvements. However, BECCS overall results were driven by land use conversion factors, which indicate the need for thorough evaluations of these effects. Bypassing this issue with biomass growth on marginal land could be a potential solution. Yet, marginal land availability and uncertain biomass productivity response might not make them long term candidates for BECCS large-scale deployment.
Given the variable outcomes of BECCS sustainability analysis, BECCS large scale deployment was found to have very different implications in terms of resource mobilisation. Based on the analysis on switchgrass and miscanthus, within a scenario excluding direct and indirect land use changes, removing 3.3 GtC year−1 with BECCS could annually require between 360 and 2400M ha of marginal lands, 3600 and 15![[thin space (1/6-em)]](https://www.rsc.org/images/entities/char_2009.gif) 700B m3 of water, 30 to 360 Gt of nutrients, and 1.7 to 2.9 TW of installed BECCS capacity. As a means of comparison, the upper bounds of these values correspond respectively to over three times the world total harvested land for cereal production, twice the world annual water use for agriculture (including evapotranspiration), 20 times the US annual nutrient use, and 1.6 times the world total coal-fired power plant capacity. This underlines the challenges associated with the large scale deployment of BECCS, especially concerning water and nutrient consumption.
700B m3 of water, 30 to 360 Gt of nutrients, and 1.7 to 2.9 TW of installed BECCS capacity. As a means of comparison, the upper bounds of these values correspond respectively to over three times the world total harvested land for cereal production, twice the world annual water use for agriculture (including evapotranspiration), 20 times the US annual nutrient use, and 1.6 times the world total coal-fired power plant capacity. This underlines the challenges associated with the large scale deployment of BECCS, especially concerning water and nutrient consumption.
Overall it was shown that over a plant lifetime and upon choosing the right conditions, BECCS can be a reliable option for the sustainable and permanent removal of CO2 from the atmosphere, even when including supply chain, direct and indirect land use change effects. The high variability in BECCS CO2 removal time and space efficiencies in the model outcomes underpinned the need for case-to-case analysis when it comes to BECCS sustainability assessment, especially for the determination of land use change factors. Policy implications of this conclusion are that regulating and attributing value to these systems will have to integrate this regional specificity.
We have identified five key principles which could improve the sustainability of BECCS. The combination of a sensitivity analysis on the model combined with the investigation of alternate supply chain scenarios elucidated the following five key levers: (1) measuring and limiting the impacts of direct and indirect land use changes, (2) using carbon neutral power and organic fertilizers, (3) prioritizing sea and rail over road transport, (4) increasing the use of carbon negative fuels, and (5) exploiting alternative biomass processing options, e.g., natural drying or torrefaction. This indicates that regardless of the biomass and region studied, BECCS sustainability heavily relies on intelligent management.
Appendices
A Supply chain model details
 | (13) |
 | (14) |
 | (15) |
 | (16) |
 | (17) |
Processing operations require energy both in the form of fuel (drying) and electrical power (size reduction, drying, grinding, pelleting). Knowing each operation energy requirement EEi in MJ tMW−1 and biomass input Yi,wet, each processing contribution to biomass embodied energy is calculated with the following formula:
 | (18) |
For drying, a model was designed based on Gebreegziabher et al.112 and Li et al.150 Biomass drying has been covered by many studies,113,151–153 but a precise thermodynamic and kinetic model is hard to obtain due to the lack of data on biomass properties, such as specific heat capacity, diffusivity, equilibrium moisture content, etc. This model uses a thermodynamic approach based on the industrial data provided by Gebreegziabher et al. and Li et al. on wood drying (Fig. 21).
Chopped or chipped biomass is dried in a rotary dryer in contact with hot air. Air is heated through a heat exchanger from room temperature to about 60 °C. Air inlet and outlet relative humidity RH1 and RH3 are known. Air moisture content Yi at any stage of the process is linked with air relative humidity through psychrometric relations, involving the saturated vapor pressure Pwsi and vapor pressure Pwi:
 | (19) |
| Pwi = RHi × Pwsi | (20) |
 | (21) |
Considering a water mass balance on the pre-heater, air inlet moisture content is equal to air outlet moisture content:
| Y2 = Y1 | (22) |
 | (23) |
| Wa(Y3 − Y2) = Ws(X2 − X3) | (24) |
| Qh = Wa(Ha2 − Ha1) | (25) |

| (26) |
 the dry air and vapor specific heat capacities, respectively, and LHw the water heat of vaporization, assumed constant in this range of temperature.
Assuming the heat exchanger uses steam generated by a boiler operating with an efficiency EFFB, the specific boiler heat requirement is calculated:
 | (27) |
• Short and long distance diesel fueled truck for farm – pellet plant and pellet plant – power plant road transport (EffD),
• Long distance heavy fuel oil (HFO) fueled bulk carriers for pellet plant – power plant sea transport (EffHFO)
The transport stage contribution to biomass embodied energy is thus calculated by the following expression:
 | (28) |
| EFN2O = EFN + EFNH3–N–NOx–N × EFN,volatalized + EFN,leaching × LP | (29) |
 | (30) |
B Overview of the water footprint and embodied energy models
Fig. 22 and 23.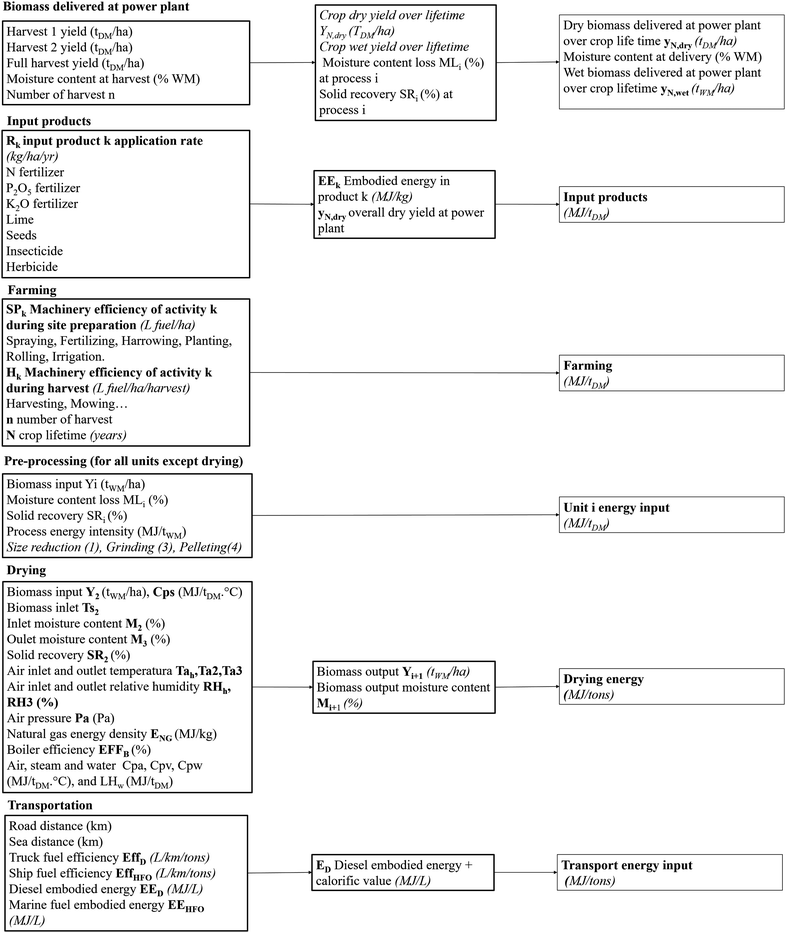 | ||
| Fig. 23 Overview of the embodied energy model. Biomass embodied energy was calculated by summing the different energy contributions along the value chain following a life cycle assessment approach. | ||
C Model input data
![[thin space (1/6-em)]](https://www.rsc.org/images/entities/char_2009.gif) 200 km sea distance)
200 km sea distance)
| Month | Average low T | Average high T | Relative humidity | Wind speed at 2 m | Sunshine hours | Average precipitation |
|---|---|---|---|---|---|---|
| Units | °C | °C | % | m s−1 | Hours | mm |
| January | 19.4 | 27.5 | 84.0 | 3.0 | 5.0 | 224.7 |
| February | 19.5 | 28.4 | 84.0 | 3.0 | 4.6 | 149.7 |
| March | 19.7 | 28.4 | 83.0 | 2.9 | 4.9 | 129.3 |
| April | 18.0 | 26.3 | 83.0 | 2.9 | 5.8 | 44.0 |
| May | 15.0 | 23.3 | 83.0 | 2.7 | 5.5 | 38.5 |
| June | 14.4 | 23.7 | 82.0 | 2.4 | 5.8 | 24.7 |
| July | 13.4 | 23.3 | 81.0 | 2.4 | 6.0 | 47.9 |
| August | 14.7 | 25.4 | 79.0 | 2.5 | 6.4 | 25.5 |
| September | 14.9 | 25.0 | 80.0 | 3.5 | 4.5 | 48.9 |
| October | 16.8 | 26.7 | 82.0 | 3.0 | 3.9 | 110.8 |
| November | 17.2 | 25.9 | 82.0 | 3.5 | 4.7 | 112.1 |
| December | 18.5 | 27.4 | 83.0 | 3.3 | 5.7 | 164.2 |
| Sources | 123 | |||||
![[thin space (1/6-em)]](https://www.rsc.org/images/entities/char_2009.gif) 044 km sea distance)
044 km sea distance)
| Month | Average low T | Average high T | Relative humidity | Wind speed at 2 m | Sunshine hours | Average precipitation |
|---|---|---|---|---|---|---|
| Units | °C | °C | % | m s−1 | Hours | mm |
| January | −4.5 | 5.3 | 75.1 | 4.8 | 2.6 | 15.6 |
| February | −1.0 | 8.8 | 79.1 | 3.5 | 2.7 | 15.3 |
| March | 3.6 | 15.6 | 80.9 | 3.5 | 3.1 | 22.2 |
| April | 9.5 | 23.0 | 81.6 | 3.8 | 2.8 | 32.5 |
| May | 12.3 | 27.9 | 83.3 | 4.5 | 2.9 | 59.0 |
| June | 18.6 | 32.0 | 84.3 | 5.5 | 2.5 | 100.4 |
| July | 21.6 | 30.6 | 79.9 | 8.0 | 2.2 | 197.3 |
| August | 20.8 | 30.4 | 79.8 | 7.4 | 2.2 | 173.4 |
| September | 14.8 | 26.6 | 77.5 | 6.7 | 2.0 | 86.0 |
| October | 8.4 | 22.3 | 73.0 | 6.8 | 2.3 | 43.9 |
| November | 1.4 | 16.2 | 72.9 | 6.0 | 2.5 | 24.6 |
| December | −2.0 | 8.5 | 73.1 | 5.7 | 2.8 | 13.7 |
| Sources | 123 | |||||
| Month | Average low T | Average high T | Relative humidity | Wind speed at 2 m | Sunshine hours | Average precipitation |
|---|---|---|---|---|---|---|
| Units | °C | °C | % | m s−1 | Hours | mm |
| January | 0.5 | 6.6 | 89.0 | 4.8 | 1.8 | 65.1 |
| February | 0.6 | 7.0 | 88.0 | 3.9 | 2.7 | 69.0 |
| March | 1.8 | 10.1 | 81.0 | 4.4 | 3.6 | 58.9 |
| April | 5.0 | 16.3 | 75.0 | 3.4 | 5.2 | 45.4 |
| May | 8.8 | 19.7 | 73.0 | 3.9 | 6.6 | 60.2 |
| June | 11.4 | 22.6 | 74.0 | 3.3 | 5.8 | 45.2 |
| July | 13.8 | 24.3 | 76.0 | 3.5 | 6.3 | 98.8 |
| August | 12.0 | 21.8 | 78.0 | 3.4 | 6.2 | 63.3 |
| September | 9.3 | 19.7 | 80.0 | 3.3 | 4.4 | 56.1 |
| October | 7.6 | 16.4 | 85.0 | 3.4 | 3.6 | 57.6 |
| November | 3.8 | 10.4 | 88.0 | 4.0 | 2.2 | 64.8 |
| December | 1.4 | 6.6 | 90.0 | 4.4 | 1.4 | 69.2 |
| Sources | 123 | |||||
![[thin space (1/6-em)]](https://www.rsc.org/images/entities/char_2009.gif) 670 km sea distance)
670 km sea distance)
| Month | Average low T | Average high T | Relative humidity | Wind speed at 2 m | Sunshine hours | Average precipitation |
|---|---|---|---|---|---|---|
| Units | °C | °C | % | m s−1 | Hours | mm |
| January | 2.5 | 18.9 | 74.0 | 1.1 | 9.0 | 35.7 |
| February | 6.6 | 22.2 | 70.0 | 1.4 | 9.0 | 38.0 |
| March | 10.8 | 27.4 | 64.0 | 1.6 | 11.0 | 19.2 |
| April | 16.2 | 35.9 | 47.0 | 2.0 | 12.0 | 13.7 |
| May | 21.1 | 40.2 | 38.0 | 1.9 | 13.0 | 24.4 |
| June | 23.7 | 39.6 | 48.0 | 1.8 | 13.0 | 110.1 |
| July | 24.9 | 35.5 | 72.0 | 1.2 | 11.0 | 135.5 |
| August | 24.6 | 34.8 | 77.0 | 0.9 | 10.0 | 119.0 |
| September | 22.0 | 34.1 | 70.0 | 1.0 | 11.0 | 54.6 |
| October | 16.6 | 32.7 | 67.0 | 0.8 | 11.0 | 10.9 |
| November | 10.1 | 27.8 | 73.0 | 0.7 | 10.0 | 5.4 |
| December | 4.4 | 21.1 | 76.0 | 0.9 | 9.0 | 9.4 |
| Sources | 123 | |||||
| Month | Average low T | Average high T | Relative humidity | Wind speed at 2 m | Sunshine hours | Average precipitation |
|---|---|---|---|---|---|---|
| Units | °C | °C | % | m s−1 | Hours | mm |
| January | 10.0 | 24.1 | 71.2 | 3.6 | 7 | 53.8 |
| February | 9.7 | 24.2 | 69.7 | 3.7 | 7 | 49.6 |
| March | 12.1 | 26.6 | 67.8 | 3.9 | 8 | 68.6 |
| April | 14.6 | 29.0 | 66.8 | 4.0 | 10 | 54.3 |
| May | 18.3 | 31.6 | 66.8 | 3.7 | 10 | 109.0 |
| June | 21.7 | 32.6 | 75.4 | 3.0 | 11 | 234.0 |
| July | 23.1 | 33.3 | 76.3 | 2.5 | 10 | 211.3 |
| August | 23.4 | 34.0 | 77.8 | 2.8 | 9 | 244.4 |
| September | 22.8 | 32.5 | 78.5 | 3.3 | 9 | 152.3 |
| October | 19.2 | 29.8 | 75.6 | 3.6 | 8 | 101.4 |
| November | 12.4 | 25.5 | 73.8 | 3.5 | 8 | 55.7 |
| December | 13.6 | 25.9 | 73.9 | 3.3 | 7 | 74.3 |
| Sources | 123 | |||||
| Parameter | Unit | Mean | Range | Sources |
|---|---|---|---|---|
| Nitrogen fertilizer EE | MJ kg−1 | 55.4 | 49.1–61.7 | 67, 76, 81 and 154–162 |
| Phosphate fertilizer EE | MJ kg−1 | 10.5 | 6.9–14.1 | 67, 76, 81 and 154–162 |
| Potash fertilizer EE | MJ kg−1 | 7.3 | 4.6–13.6 | 67, 76, 81 and 154–162 |
| Lime EE | MJ kg−1 | 1.0 | 0.12–1.71 | 67, 81, 160 and 161 |
| Herbicide EE | MJ kg−1 | 292.9 | 243.8–342.0 | 67, 81, 154, 160, 161 and 163 |
| Miscanthus rhizome EE | MJ kg−1 | 6 | 4–8 | 76 and 97 |
| Switchgrass seed EE | MJ kg−1 | 14.7 | 6–26.1 | 67, 71, 81 and 164 |
| Willow planting EE | MJ per cutting | 0.101 | 97 | |
| Diesel EE | MJ L−1 | 4.7 | 3.7–6.2 | 67, 96, 97 and 165 |
| Biodiesel EE | MJ L−1 | 14.3 | 97 | |
| Natural gas EE | MJ kg−1 | 4.7 | 97 | |
| Diesel LHV | MJ L−1 | 37.4 | 35.9–39.1 | 76, 97, 116, 144 and 166 |
| Biodiesel LHV | MJ L−1 | 34.8 | 33.7–37.3 | 97 and 167 |
| Bioethanol LHV | MJ L−1 | 21.2 | 168 | |
| Natural gas LHV | MJ kg−1 | 47.0 | 46.9–47.1 | 169 and 170 |
| Transport of supplies (diesel) | MJ kg−1 | 0.52 | 0.44–0.64 | 69 and 158 |
| Road transport diesel efficiency | L (km tMW)−1 | 0.044 | 0.028–0.06 | 65, 92, 97, 116, 170 and 171 |
| Road transport bioethanol E25 efficiency | L ethanol per L diesel | 1.12 | Own calculations | |
| Sea transport HFO efficiency | MJ (km tMW)−1 | 0.049 | 0.0302–0.0882 | Adapted from ref. 97 and 172 |
| Irrigation | MJ mm−1 | 15.8 | 1.1–26.4 | Adapted from ref. 76, 114 and 139 |
| Parameter | Unit | Mean | Range | Sources |
|---|---|---|---|---|
| Nitrogen fertilizer CF | kgCO2-eq kg−1 | 3.6 | 2.9–4.4 | 67, 76, 88, 158, 161, 173 and 174 |
| Phosphate fertilizer CF | kgCO2-eq kg−1 | 1.1 | 0.6–1.6 | 67, 76, 158, 161 and 174 |
| Potash fertilizer CF | kgCO2-eq kg−1 | 0.64 | 0.44–0.86 | 67, 76, 158, 161 and 174 |
| Lime CF | kgCO2-eq kg−1 | 1.1 | 0.6–1.6 | 67, 158, 159, 161 and 174 |
| Herbicide CF | kgCO2-eq kg−1 | 20.3 | 17.2–25 | 67, 158, 161 and 174 |
| Miscanthus rhizome CF | kgCO2-eq kg−1 | 0.01 | 67 and 76 | |
| Switchgrass seed CF | kgCO2-eq kg−1 | 14.7 | 6–26.1 | 67 and 71 |
| Willow planting CF | kgCO2-eq kg−1 | 0.01 | 97 | |
| Electricity CF | kgCO2-eq MJ−1 | 4.7 | 3.7–6.2 | 67, 76, 137, 138, 158, 161, 162 and 175 |
| Diesel EF | kgCO2-eq L−1 | 3.4 | 3.2–3.5 | 67, 76, 89, 97, 109, 111, 158, 161, 174 and 176 |
| Biodiesel EF | kgCO2-eq L−1 | 3.4 | 3.2–3.5 | 89, 97 and 106 |
| Bioethanol + CCS EF | kgCO2-eq L−1 | −2.12 | Adapted from ref. 111 | |
| Natural gas EF | kgCO2-eq L−1 | 3.4 | 3.2–3.5 | 97 |
| Transport of supplies (diesel) EF | kgCO2-eq (km tMW)−1 | 0.05 | 67 and 158 | |
| Road transport diesel EF | kgCO2-eq (km tMW)−1 | 0.077 | 0.073–0.08 | 97 and 177 |
| Road transport biodiesel 20% (B20) EF | kgCO2-eq (km tMW)−1 | 0.065 | 0.062–0.068 | 169 |
| Road transport bioethanol 25% (E25) EF | kgCO2-eq (km tMW)−1 | 0.034 | 0.028–0.040 | Own calculations |
| Sea transport HFO efficiency | kgCO2-eq (km tMW)−1 | 0.004 | 0.00247–0.00722 | 172 |
| ILUC | kgCO2-eq ha−1 | 183![[thin space (1/6-em)]](https://www.rsc.org/images/entities/char_2009.gif) 025 025 |
95![[thin space (1/6-em)]](https://www.rsc.org/images/entities/char_2009.gif) 700–270 700–270![[thin space (1/6-em)]](https://www.rsc.org/images/entities/char_2009.gif) 350 350 |
Adapted from ref. 103, 107, 108 and 140 |
| LUC grassland | kgCO2-eq ha−1 | 136![[thin space (1/6-em)]](https://www.rsc.org/images/entities/char_2009.gif) 300 300 |
75![[thin space (1/6-em)]](https://www.rsc.org/images/entities/char_2009.gif) 000–200 000–200![[thin space (1/6-em)]](https://www.rsc.org/images/entities/char_2009.gif) 000 000 |
102 and 103 |
| LUC cropland | kgCO2-eq ha−1 | 37![[thin space (1/6-em)]](https://www.rsc.org/images/entities/char_2009.gif) 500 500 |
102 | |
| LUC marginal land | kgCO2-eq ha−1 | 25 | 0–69 | 102 |
| LUC forest | kgCO2-eq ha−1 | 573![[thin space (1/6-em)]](https://www.rsc.org/images/entities/char_2009.gif) 200 200 |
350![[thin space (1/6-em)]](https://www.rsc.org/images/entities/char_2009.gif) 000–719 000–719![[thin space (1/6-em)]](https://www.rsc.org/images/entities/char_2009.gif) 500 500 |
102 and 103 |
| LUC wetland | kgCO2-eq ha−1 | 2![[thin space (1/6-em)]](https://www.rsc.org/images/entities/char_2009.gif) 186 186![[thin space (1/6-em)]](https://www.rsc.org/images/entities/char_2009.gif) 500 500 |
1![[thin space (1/6-em)]](https://www.rsc.org/images/entities/char_2009.gif) 000 000![[thin space (1/6-em)]](https://www.rsc.org/images/entities/char_2009.gif) 000–3 000–3![[thin space (1/6-em)]](https://www.rsc.org/images/entities/char_2009.gif) 452 452![[thin space (1/6-em)]](https://www.rsc.org/images/entities/char_2009.gif) 000 000 |
102 and 103 |
| EF for N addition | kgN2O–N kgN−1 | 0.01 | 67 and 178 | |
| EF for N volatization | kgN2O–N kgNH3–N+NOx–N−1 | 0.01 | 67 and 178 | |
| EF for NH3 − N + NOx − N | kgNH3–N+NOx–N kgN−1 | 0.1 | 67 and 178 | |
| EF for N leaching | kgN2O–N kgN−1 | 0.04 | 0.0075–0.075 | 65, 67 and 178 |
| Parameter | Unit | Mean | Range | Sources |
|---|---|---|---|---|
| N2O–N to N2O conversion | 1.57 | 67 and 178 | ||
| P to P2O5 conversion | 2.18 | 56 | ||
| K to K2O conversion | 1.21 | 56 | ||
| C to CO2 conversion | 3.67 | 166 | ||
| CCS plant area | ha | 15 | ||
DAC plant area for 10![[thin space (1/6-em)]](https://www.rsc.org/images/entities/char_2009.gif) 000 tCO2 day−1 000 tCO2 day−1 |
ha | 13 | ||
| DAC energy requirement | MW h tCO2−1 | 4.64 | 3.33–6.3 | Adapted from ref. 146 and 147 |
| Chopping solid recovery | %DM | 98 | ||
| Drying solid recovery | %DM | 98 | ||
| Drying target moisture | %DM | 15 | ||
| Drying energy requirement | MJ tH2O![[thin space (1/6-em)]](https://www.rsc.org/images/entities/char_2009.gif) evaporated−1 evaporated−1 |
3734 | Own calculations | |
| Boiler efficiency with natural gas for drying | % | 90 | ||
| Boiler efficiency with biomass for drying | % | 75 | ||
| Grinding solid recovery | %DM | 98 | ||
| Grinding moisture loss | % | 5 | ||
| Pelleting solid recovery | %DM | 98 | ||
| Pelleting moisture loss | % | 5 | ||
| Road transport solid recovery | %DM | 95 | ||
| Sea transport solid recovery | %DM | 95 | ||
| Parameter | Unit | Mean | Range | Sources |
|---|---|---|---|---|
| HHV | MJ kgDM−1 | 19.2 | 17.3–21.2 | 28 and 31 |
| Cp | MJ (kgDM K)−1 | 1.3 | 179 | |
| C% | %DM | 48.4 | 44.4–52.3 | 28, 31, 33 and 56 |
| H% | %DM | 5.5 | 5.0–6.1 | 28, 31, 33 and 56 |
| O% | %DM | 39.1 | 34.0–43.3 | 28, 31, 33 and 56 |
| N% | %DM | 0.61 | 0.45–0.78 | 28, 31, 33 and 56 |
| P% | %DM | 0.09 | 56 | |
| K% | %DM | 1.5 | 56 | |
| S% | %DM | 0.10 | 0.02–0.31 | 28, 31, 33 and 56 |
| Cl% | %DM | 0.32 | 0.01–0.73 | 28, 31, 33 and 56 |
| Ash% | %DM | 4.5 | 1.6–7.3 | 28, 31 and 33 |
| Moisture content at harvest% | %WM | 10.9 | 5.2–16.0 | 31, 33, 56, 180 and 181 |
| Straw/grain ratio | %DM | 1.3 | 0.64–2.03 | 180 |
| Brazil harvest grain yield | tDM ha−1 year−1 | 2.49 | 2.08–2.83 | 2009–2013128 |
| China harvest grain yield | tDM ha−1 year−1 | 4.87 | 4.74–5.05 | 2009–2013128 |
| Europe harvest grain yield | tDM ha−1 year−1 | 8.66 | 7.78–9.29 | 2009–2013128 |
| India harvest grain yield | tDM ha−1 year−1 | 3.13 | 2.84–4.02 | 2009–2013128 |
| US harvest grain yield | tDM ha−1 year−1 | 3.07 | 2.94–3.17 | 2009–2013128 |
| Lifetime | Years | 1 | ||
| Rotation of harvests | Years | 1 | ||
| Growing cycle length | Days | 180 (Brazil, China, India); 335 (Europe); 120 (US) | 143 | |
| Growing cycle starting month | 11 (Brazil); 12 (China); 10 (Europe, India); 5 (US) | 143 | ||
| Growing cycle starting day | 15 (Brazil, Europe, India, US); 1 (China) | 143 | ||
| Initial stage t1 | 20 (Brazil, China, India); 160 (Europe); 15 (US) | 143 | ||
| Development stage t2 | 80 (Brazil, China, India); 235 (Europe); 40 (US) | 143 | ||
| Mid-season stage t3 | 150 (Brazil, China, India); 310 (Europe); 90 (US) | 143 | ||
| K c,ini | 0.7 | 143 | ||
| K c,mid | 1.15 | 143 | ||
| K c,end | 0.3 | 143 | ||
| Nitrogen rate | kg ha−1 year−1 | 52.3 (Brazil); 185.5 (China); 53.6 (Europe); 139.6 (India); 80.4 (US) | 2010127,128 | |
| % N available in straw | %N | 30 | 56 | |
| % P available in straw | %P | 100 | 56 | |
| % K available in straw | %N | 100 | 56 | |
| Collection (bales) | L per ha per harvest | 4.4 | 56 | |
| Chopping (diesel) | MJ tMW−1 | 7.4 | 56 | |
| Grinding (power) | MJ tMW−1 | 100–323 | 57, 182 and 183 | |
| Pelleting (power) | MJ tMW−1 | 300–409 | 57 and 183 | |
| Pellet grinding (power) | MJ tMW−1 | 345 | 34 | |
| Parameter | Unit | Mean | Range | Sources |
|---|---|---|---|---|
| HHV | MJ kgDM−1 | 18.4 | 17.7–19.1 | 28, 31, 32, 76 and 184 |
| Cp | MJ (kgDM K)−1 | 1.4 | 179 | |
| C% | %DM | 47.8 | 45.1–50.4 | 28 and 31–33 |
| H% | %DM | 5.5 | 4.9–6.1 | 28 and 31–33 |
| O% | %DM | 42.3 | 40.2–44.3 | 28 and 31–33 |
| N% | %DM | 0.56 | 0.21–0.92 | 28 and 31–33 |
| S% | %DM | 0.22 | 0.04–0.37 | 28 and 31–33 |
| Cl% | %DM | 0.26 | 0.10–0.42 | 28 and 31–33 |
| Ash% | %DM | 3.9 | 2.5–5.4 | 28 and 31–33 |
| Moisture content at harvest% | %WM | 23 | 15–31 | 31–33, 69, 76 and 185 |
| 1st harvest yield proportion | % | 21 | 69 | |
| 2nd harvest yield proportion | % | 64 | 69 | |
| Brazil full harvest yield | tDM ha−1 year−1 | 28.9 | 23.2–34.7 | 61, 70 and 73 |
| China full harvest yield | tDM ha−1 year−1 | 24.3 | 23.1–25.4 | 73 |
| Europe full harvest yield | tDM ha−1 year−1 | 18.8 | 15.6–22.1 | 64, 70, 75–78, 97 and 184–188 |
| India full harvest yield | tDM ha−1 year−1 | 15.0 | 12.8–17.3 | 73 |
| US full harvest yield | tDM ha−1 year−1 | 28.0 | 21.2–34.4 | 61, 70 and 90 |
| Lifetime | Years | 18 | 16–21 | 65, 69 and 97 |
| Rotation of harvests | Years | 1 | 69 | |
| Growing cycle length | Days | 209 | 203–215 | 62 |
| Growing cycle starting month | 7 (N); 9 (S) | 4–9 (N) | 62 | |
| Growing cycle starting day | 1 | 62 | ||
| Initial stage t1 | 45 | 42–48 | 62 | |
| Development stage t2 | 67 | 64–70 | 62 | |
| Mid-season stage t3 | 163 | 152–174 | 62 | |
| K c,ini | 0.4 | 143 | ||
| K c,mid | 0.95 | 143 | ||
| K c,end | 0.4 | 143 | ||
| Nitrogen rate | kg ha−1 year−1 | 78 | 50–100 | 63, 67, 71, 76 and 185 |
| Phosphate rate | kg ha−1 year−1 | 63 | 50–100 | 63, 67, 71, 76 and 186 |
| Potash rate | kg ha−1 year−1 | 124 | 60–200 | 63, 67, 71, 76 and 186 |
| Lime rate | kg ha−1 year−1 | 643 | 67 and 189 | |
| Rhizome rate | kg ha−1 year−1 | 52.6 | 97 | |
| Herbicide rate | kg ha−1 year−1 | 0.88 | 0.105–2.81 | 65, 67 and 71 |
| Land preparation (diesel) | L ha−1 | 75.1 | 69 | |
| Maintenance – harvest (bales) | L per ha per harvest | 51.6 | 69 | |
| Chopping (diesel) | MJ tMW−1 | 108 | 76 | |
| Grinding (power) | MJ tMW−1 | 124 | 68–182 | 76 |
| Pelleting (power) | MJ tMW−1 | 579 | 232–925 | 76 |
| Pellet grinding (power) | MJ tMW−1 | 345 | 34 | |
| Parameter | Unit | Mean | Range | Sources |
|---|---|---|---|---|
| HHV | MJ kgDM−1 | 18.4 | 17.3–19.4 | 32 and 86 |
| Cp | MJ (kgDM K)−1 | 1.3 | 179 | |
| C% | %DM | 47.1 | 46.5–47.8 | 30 and 136 |
| H% | %DM | 5.9 | 5.4–6.3 | 30,136 |
| O% | %DM | 41.4 | 40.3–42.5 | 30 and 136 |
| N% | %DM | 0.8 | 0.51–1.1 | 30 and 136 |
| S% | %DM | 0.11 | 0.08–0.20 | 30 and 136 |
| Cl% | %DM | 0.13 | 0–0.16 | 30 and 136 |
| Ash% | %DM | 5.7 | 5.2–6.1 | 30 and 136 |
| Moisture content at harvest% | %WM | 12 | 11–14 | 67, 79, 87, 136 and 190 |
| 1st harvest yield proportion | % | 21 | 11–30 | 87 and 191 |
| 2nd harvest yield proportion | % | 69 | 67–70 | 87 and 191 |
| Brazil full harvest yield | tDM ha−1 | 28.9 | 23.2–34.7 | 67, 84 and 122 |
| China full harvest yield | tDM ha−1 year−1 | 13.0 | 10.6–15.3 | 67 and 192 |
| Europe full harvest yield | tDM ha−1 year−1 | 11.9 | 7.5–16.3 | 82 and 191 |
| India full harvest yield | tDM ha−1 year−1 | 8.7 | 5.2–12.6 | 67, 135 and 192 |
| US full harvest yield | tDM ha−1 year−1 | 9.5 | 28.1–10.9 | 67, 79, 87, 122, 135, 192 and 193 |
| Lifetime | Years | 12 | 10–15 | 79 and 86 |
| Rotation of harvests | Years | 1 | 79 and 86 | |
| Growing cycle length | Days | 128 | 90–160 | 86 and 143 |
| Growing cycle starting month | 5 (N); 9 (S) | 143 | ||
| Growing cycle starting day | 1 | 143 | ||
| Initial stage t1 | 10 | 143 | ||
| Development stage t2 | 25 | 143 | ||
| Mid-season stage t3 | 100 | 143 | ||
| K c,ini | 0.5 | 47 | ||
| K c,mid | 1.03 | 0.9–1.15 | 47 | |
| K c,end | 0.98 | 0.85–1.1 | 47 | |
| Nitrogen rate | kg ha−1 year−1 | 68.5 | 49.5–98.8 | 67, 79, 86, 87 and 193 |
| Phosphate rate | kg ha−1 year−1 | 34 | 0–67 | 67, 86 and 193 |
| Potash rate | kg ha−1 year−1 | 34 | 0–67 | 67, 86 and 193 |
| 63, 67, 71, 76 and 186 | ||||
| Lime rate | kg ha−1 year−1 | 569 | 494–643 | 67, 136 and 189 |
| Seed rate | kg ha−1 year−1 | 0.8 | 0.4–1.1 | 67, 71, 81, 87, 97, 164 and 194 |
| Herbicide rate | kg ha−1 year−1 | 0.48 | 0.42–0.54 | 67, 87 and 158 |
| Land preparation (diesel) | L ha−1 | 15.7 | 87 | |
| Maintenance – harvest (bales) | L per ha per harvest | 32.6 | 87 | |
| Chopping (diesel) | MJ tMW−1 | 135 | 76 | |
| Grinding (power) | MJ tMW−1 | 124 | 72–90 | 92 |
| Pelleting (power) | MJ tMW−1 | 46 | 92 | |
| Pellet grinding (power) | MJ tMW−1 | 345 | 34 | |
| Parameter | Unit | Mean | Range | Sources |
|---|---|---|---|---|
| HHV | MJ kgDM−1 | 19.1 | 18.4–19.8 | 28, 29, 67, 92, 96 and 97 |
| Cp | MJ (kgDM K)−1 | 1.5 | 179 | |
| C% | %DM | 48.1 | 46–49.2 | 28 and 29 |
| H% | %DM | 5.9 | 5.3–6.4 | 28 and 29 |
| O% | %DM | 42.3 | 40.0–43.0 | 28 |
| N% | %DM | 0.5 | 0.2–0.8 | 28 and 29 |
| S% | %DM | 0.05 | 0.02–0.1 | 28 and 29 |
| Cl% | %DM | 0.03 | 0.01–0.05 | 28 and 29 |
| Ash% | %DM | 2.0 | 1.1–4.0 | 28, 29 and 92 |
| Moisture content at harvest% | %WM | 52 | 50–53 | 27, 67 and 69 |
| 1st harvest yield proportion | % | 72 | 69 | |
| 2nd harvest yield proportion | % | 100 | 69 | |
| Europe full harvest yield | tDM ha−1 year−1 | 9.7 | 8.1–11.2 | 67, 69, 80, 96, 97, 100, 120, 131, 132, 175, 188 and 195–198 |
| US full harvest yield | tDM ha−1 year−1 | 7.2 | 4.7–11.0 | 122 and 183 |
| Lifetime | Years | 16 | 69 and 96 | |
| Rotation of harvests | Years | 3 | 2–4 | 69, 92 and 96 |
| Growing cycle length | Days | 150 | 199 | |
| Growing cycle starting month | 5 (N); 9 (S) | 199 | ||
| Growing cycle starting day | 15 | 199 | ||
| Initial stage t1 | 40 | 199 | ||
| Development stage t2 | 100 | 199 | ||
| Mid-season stage t3 | 130 | 199 | ||
| K c,ini | 0.65 | 199 | ||
| K c,mid | 1.6 | 199 | ||
| K c,end | 0.90.93 | 199 | ||
| Nitrogen rate | kg ha−1 year−1 | 80 | 50–100 | 67, 80, 131, 175, 196 and 198 |
| Phosphate rate | kg ha−1 year−1 | 15 | 11–30 | 67, 80, 131, 175 and 198 |
| Potash rate | kg ha−1 year−1 | 40 | 0–67 | 67, 80, 131, 175 and 198 |
| Lime rate | kg ha−1 year−1 | 643 | 67 and 189 | |
| Cuttings rate | kg ha−1 year−1 | 608 | 284–875 | 67, 97, 175 and 200 |
| Herbicide rate | kg ha−1 year−1 | 0.43 | 0.11–1.08 | 67, 80, 131, 175 and 198 |
| Land preparation (diesel) | L ha−1 | 82.8 | 69 | |
| Maintenance – harvest (chips) | L per ha per harvest | 164.2 | 69 | |
| Grinding-pelleting (power) | MJ tMW−1 | 461 | 94 | |
| Pellet grinding (power) | MJ tMW−1 | 367 | 34 | |
D Sensitivity analysis on willow-based BECCS dynamic GHG balance
Fig. 24.Acknowledgements
We thank Imperial College London for the funding of a President's PhD Scholarship, as well as the “Multi-scale Energy Systems Modelling Encompassing Renewable, Intermittent, Stored Energy and Carbon Capture and Storage” (MESMERISE-CCS) grant, funded by the Engineering and Physical Sciences Research Council (EPSRC) under grant EP/M001369/1.References
- C. Marchetti, Clim. Change, 1977, 1, 59–68 CrossRef CAS.
- N. Mac Dowell, N. Florin, A. Buchard, J. Hallett, A. Galindo, G. Jackson, C. S. Adjiman, C. K. Williams, N. Shah and P. Fennell, Energy Environ. Sci., 2010, 3, 1645 CAS.
- M. E. Boot-Handford, J. C. Abanades, E. J. Anthony, M. J. Blunt, S. Brandani, N. Mac Dowell, J. R. Fernandez, M.-C. Ferrari, R. Gross, J. P. Hallett, R. S. Haszeldine, P. Heptonstall, A. Lyngfelt, Z. Makuch, E. Mangano, R. T. J. Porter, M. Pourkashanian, G. T. Rochelle, N. Shah, J. G. Yaoa and P. S. Fennell, Energy Environ. Sci., 2014, 7(1), 130–189 CAS.
- R. H. Williams, Fuel Decarbonization for Fuel Cell Applications and Sequestration of the Separated CO2, Center for Energy and Environmental Studies, Princeton University Technical Report, 1996.
- H. J. Herzog and E. M. Drake, Annu. Rev. Energy, 1996, 21, 145–166 CrossRef.
- F. Kraxner, S. Nilsson and M. Obersteiner, Biomass Bioenergy, 2003, 24, 285–296 CrossRef CAS.
- IEA, Combining Bioenergy with CCS, 2011.
- P. Read and J. Lermit, Energy, 2005, 30, 2654–2671 CrossRef.
- A. L. Robinson, J. S. Rhodes and D. W. Keith, Environ. Sci. Technol., 2003, 37, 5081–5089 CrossRef CAS PubMed.
- S. Selosse and O. Ricci, Energy, 2014, 76, 967–975 CrossRef.
- Biomass with CO 2 Capture and Storage (Bio-CCS) The way forward for Europe, Zero Emission Platform (ZEP) technical report, 2013.
- J. S. Rhodes and D. W. Keith, Biomass Bioenergy, 2005, 29, 440–450 CrossRef.
- K. Mollersten, J. Yan and J. R. Moreira, Biomass Bioenergy, 2003, 25, 273–285 CrossRef.
- C. Gough and P. Upham, Biomass energy with carbon capture and storage (BECCS): a review, 2010 Search PubMed.
- O. Akgul, N. Mac Dowell, L. G. Papageorgiou and N. Shah, Int. J. Greenhouse Gas Control, 2014, 28, 189–202 CrossRef CAS.
- IPCC, Climate Change 2014, Mitigation of Climate Change. Contribution of Working Group III to the Fifth Assessment Report of the Intergovernmental Panel on Climate Change, 2014.
- S. Fuss, J. G. Canadell, G. P. Peters, M. Tavoni, R. M. Andrew, P. Ciais, R. B. Jackson, C. D. Jones, F. Kraxner, N. Nakicenovic, C. Le Quéré, M. R. Raupach, A. Sharifi, P. Smith and Y. Yamagata, Nat. Clim. Change, 2014, 4, 850–853 CrossRef CAS.
- T. W. R. Powell and T. M. Lenton, Energy Environ. Sci., 2012, 5, 8116 CAS.
- J. M. DeCicco, D. Y. Liu, J. Heo, R. Krishnan, A. Kurthen and L. Wang, Clim. Change, 2016, 138, 667–680 CrossRef CAS.
- J. Rogelj, M. den Elzen, N. Höhne, T. Fransen, H. Fekete, H. Winkler, R. Schaeffer, F. Sha, K. Riahi and M. Meinshausen, Nature, 2016, 534, 631–639 CrossRef CAS PubMed.
- IEAGHG, CO2Capture at Coal Based Power and Hydrogen Plants, May, 2014.
- A. Singh and K. Stéphenne, Energy Procedia, 2014, 63, 1678–1685 CrossRef CAS.
- M. Campbell, Energy Procedia, 2014, 63, 801–807 CrossRef CAS.
- Y. Zhang, B. Freeman, P. Hao and G. Rochelle, Faraday Discuss., 2016, 192, 459–477 RSC.
- M. Bui, M. Fajardy and N. Mac Dowell, Appl. Energy, 2017, 195, 289–302 CrossRef CAS.
- M. B. Berkenpas, J. J. Fry, K. Kietzke and E. S. Rubin, Integrated Environmental Control Model Getting Started, Center for Energy and Evironmental Studies, Carnagie mellon University Technical Report.
- P. J. Tharakan, T. A. Volk, L. P. Abrahamson and E. H. White, Biomass Bioenergy, 2003, 25, 571–580 CrossRef CAS.
- ISO, Solid biofuels: Fuel specifications and classes. Part 1: General requirements, 2014.
- M. J. Stolarski, M. Krzyzaniak, S. Szczukowski and J. Tworkowski, J. Res. Appl. Agric. Eng., 2013, 58, 168–171 CrossRef.
- A. Monti, Switchgrass: A Valuable Biomass Crop for Energy, Springer edn, 2012, p. 210 Search PubMed.
- H. Spliethoff and K. R. G. Hein, Fuel Process. Technol., 1998, 54, 189–205 CrossRef CAS.
- P. McKendry, Bioresour. Technol., 2002, 83, 37–46 CrossRef CAS PubMed.
- T. Heinzel, V. Siegle, H. Spliethoff and K. R. G. Hein, Fuel Process. Technol., 1998, 54, 109–125 CrossRef CAS.
- O. Williams, C. Eastwick, S. Kingman, D. Giddings, S. Lormor and E. Lester, Fuel, 2015, 158, 379–387 CrossRef CAS.
- K. Savolainen, Appl. Energy, 2003, 74, 369–381 CrossRef CAS.
- DRAX plc, Drax annual report and accounts, 2015.
- Y. Shao, J. Wang, F. Preto, J. Zhu and C. Xu, Energies, 2012, 5, 5171–5189 CrossRef CAS.
- M. Pronobis, Fuel, 2006, 85, 474–480 CrossRef CAS.
- N. Mac Dowell and M. Fajardy, Environ. Res. Lett., 2017 DOI:10.1088/1748-9326/aa67a5.
- UN Water, Waterlines, 2005, 24, 28–29 Search PubMed.
- IEA, Water for Energy: Is energy becoming a thirstier resource?, 2012 Search PubMed.
- P. Smith, S. J. Davis, F. Creutzig, S. Fuss, J. Minx, B. Gabrielle, E. Kato, R. B. Jackson, A. Cowie, E. Kriegler, D. P. van Vuuren, J. Rogelj, P. Ciais, J. Milne, J. G. Canadell, D. McCollum, G. Peters, R. Andrew, V. Krey, G. Shrestha, P. Friedlingstein, T. Gasser, A. Grubler, W. K. Heidug, M. Jonas, C. D. Jones, F. Kraxner, E. Littleton, J. Lowe, J. R. Moreira, N. Nakicenovic, M. Obersteiner, A. Patwardhan, M. Rogner, E. Rubin, A. Sharifi, A. Torvanger, Y. Yamagata, J. Edmonds and C. Yongsung, Nat. Clim. Change, 2016, 6, 42–50 CrossRef CAS.
- G. Fisher, H. T. van Velthuizen, M. M. Shah and F. O. Nachtergaele, Global agro-ecological assessment for agriculture in the twenty-first century: Methodology and Results, International Institute for Applied Systems Analysis Technical Report March, 2002.
- L. Zhuo, M. M. Mekonnen, A. Hoekstra and Y. Wada, Adv. Water Resour., 2016, 87, 29–41 CrossRef.
- Y. Wada, L. P. H. Van Beek, D. Viviroli, H. H. Drr, R. Weingartner and M. F. P. Bierkens, Water Resour. Res., 2011, 47, 1–17 CrossRef.
- A. Hoekstra, A. K. Chapagain, M. M. Aldaya and M. M. Mekonnen, Water Footprint Manual State of the Art, November, 2009 Search PubMed.
- R. G. Allen, L. Pereira, D. Raes and M. Smith, Crop evapotranspiration – Guidelines for computing crop water requirements, 1998 Search PubMed.
- M. M. Mekonnen and A. Y. Hoekstra, Environ. Sci. Technol., 2015, 49, 12860–12868 CrossRef CAS PubMed.
- M. M. Mekonnen and A. Y. Hoekstra, The green, blue and grey water footprint of crops and derived crop products, UNESCO-IHE Technical Report 47, 2010.
- M. M. Mekonnen and A. Y. Hoekstra, The green, blue and grey water footprint of crops and derived crop products. Volume 2: Appendices, UNESCO-IHE Technical Report 47, 2010.
- P. W. Gerbens-Leenes, A. Y. Hoekstra and T. van der Meer, Ecological Economics, 2009, 68, 1052–1060 CrossRef.
- M. Wu, M. Mintz, M. Wang and S. Arora, Environ. Manage., 2009, 44, 981–997 CrossRef PubMed.
- P. W. Gerbens-Leenes, A. Y. Hoekstra and T. H. van der Meer, Proc. Natl. Acad. Sci. U. S. A., 2009, 106, 10219–10223 CrossRef PubMed.
- M. Wu and M. J. Peng, Developing a Tool to Estimate Water Use in Electric Power Generation in the US, 2011 Search PubMed.
- J. Macknick, R. Newmark, G. Heath and K. C. Hallett, Environ. Res. Lett., 2012, 7, 045802 CrossRef.
- R. Parajuli, M. T. Knudsen, J. H. Schmidt and T. Dalgaard, Biomass Bioenergy, 2014, 68, 115–134 CrossRef CAS.
- H. Shahrukh, A. O. Oyedun, A. Kumar, B. Ghiasi, L. Kumar and S. Sokhansanj, Biomass Bioenergy, 2016, 90, 50–59 CrossRef CAS.
- W. Schakel, H. Meerman, A. Talaei, A. Ramirez and A. Faaij, Appl. Energy, 2014, 131, 441–467 CrossRef CAS.
- T. L. T. Nguyen, J. E. Hermansen and L. Mogensen, Appl. Energy, 2013, 104, 633–641 CrossRef CAS.
- W. Liu, J. Mi, Z. Song, J. Yan, J. Li and T. Sang, Biomass Bioenergy, 2014, 62, 47–57 CrossRef.
- I. E. Palmer, R. J. Gehl, T. G. Ranney, D. Touchell and N. George, Biomass Bioenergy, 2014, 63, 218–228 CrossRef CAS.
- F. Triana, N. Nassi o Di Nasso, G. Ragaglini, N. Roncucci and E. Bonari, GCB Bioenergy, 2014, 811–819 Search PubMed.
- M. B. Jones and M. Walsh, Miscanthus for energy and fibre, James & James (Science Publishers) Ltd, 2001, p. 192 Search PubMed.
- L. Price, M. Bullard, H. Lyons, S. Anthony and P. Nixon, Biomass Bioenergy, 2004, 26, 3–13 CrossRef.
- F. Murphy, G. Devlin and K. McDonnell, Renewable Sustainable Energy Rev., 2013, 23, 412–420 CrossRef.
- B. Gabrielle, L. Bamière, N. Caldes, S. De Cara, G. Decocq, F. Ferchaud, C. Loyce, E. Pelzer, Y. Perez, J. Wohlfahrt and G. Richard, Renewable Sustainable Energy Rev., 2014, 33, 11–25 CrossRef.
- G. G. T. Camargo, M. R. Ryan and T. L. Richard, BioScience, 2013, 63, 263–273 CrossRef.
- M. A. Mehmood, M. Ibrahim, U. Rashid, M. Nawaz, S. Ali, A. Hussain and M. Gull, Sustainable Production and Consumption, 2016, 1–19 Search PubMed.
- A. Grzybek, Modelling of biomass utilisation for energy purpose, 2010 Search PubMed.
- E. A. Heaton, J. Clifton-Brown, T. B. Voigt, M. B. Jones and S. P. Long, Mitigation and Adaptation Strategies for Global Change, 2004, 9, 433–451 CrossRef.
- M. Bullard and P. Metcalfe, Estimating the energy requirements and CO2emissions from production of the perennial grasses miscanthus, switchgrass and reed canary grass, Energy Technology Support Unit Technical Report, 2001.
- D. G. Christian, A. B. Riche and N. E. Yates, Ind. Crops Prod., 2008, 28, 320–327 CrossRef.
- S. Xue, I. Lewandowski, X. Wang and Z. Yi, Renewable Sustainable Energy Rev., 2016, 54, 932–943 CrossRef.
- C. Bohmen, PhD thesis, University of Hohenheim 2007.
- I. Lewandowski, J. C. Clifton-Brown, J. M. O. Scurlock and W. Huisman, Biomass Bioenergy, 2000, 19, 209–227 CrossRef CAS.
- I. Lewandowski, A. Kicherer and P. Vonier, Biomass Bioenergy, 1995, 8, 81–90 CrossRef CAS.
- J. Hillier, C. Whittaker, G. Dailey, M. Aylott, E. Casella, G. M. Richter, A. Riche, R. Murphy, G. Taylor and P. Smith, GCB Bioenergy, 2009, 1, 267–281 CrossRef CAS.
- J. C. Clifton-brown, J. Breuer and M. B. Jones, Global Change Biology, 2007, 13, 2296–2307 CrossRef.
- X. Lu, M. R. Withers, N. Seifkar, R. P. Field, S. R. H. Barrett and H. J. Herzog, Bioresour. Technol., 2015, 183, 1–9 CrossRef CAS PubMed.
- S. Lettens, B. Muys, R. Ceulemans, E. Moons, J. Garcia and P. Coppin, Biomass Bioenergy, 2003, 24, 179–197 CrossRef CAS.
- D. Pimentel and T. Patzek, Nat. Resour. Res., 2005, 14, 65–76 CrossRef CAS.
- N. Nassi o Di Nasso, M. V. Lasorella, N. Roncucci and E. Bonari, Ind. Crops Prod., 2015, 65, 21–26 CrossRef.
- L. J. Smith and M. S. Torn, Clim. Change, 2013, 89–103 CrossRef CAS.
- J. van Dam, A. P. C. Faaij, J. Hilbert, H. Petruzzi and W. C. Turkenburg, Renewable Sustainable Energy Rev., 2009, 13, 1710–1733 CrossRef CAS.
- J. S. Tumuluru, Front. Energy Res., 2015, 3, 1–11 Search PubMed.
- R. Samson, Switchgrass Production in Ontario: A Management Guide, Resource Efficient Agricultural Production (REAP) Canada Technical Report, 2007.
- B. Kalita, PhD thesis, University of Guelph 2012.
- C. S. Snyder, T. W. Bruulsema, T. L. Jensen and P. E. Fixen, Agric., Ecosyst. Environ., 2009, 133, 247–266 CrossRef CAS.
- J. Daystar, C. Reeb, R. Gonzalez, R. Venditti and S. S. Kelley, Fuel Process. Technol., 2015, 138, 164–174 CrossRef CAS.
- M. Wu and Y.-W. Chiu, Developping County-Level Water Footprints of Biofuel Produced from Switchgrass and Miscanthus in the US, Argonne National Laboratory Technical Report, 2014.
- A. J. Ashworth, A. M. Taylor, D. L. Reed, F. L. Allen, P. D. Keyser and D. D. Tyler, J. Cleaner Prod., 2015, 87, 227–234 CrossRef CAS.
- R. Samson and P. Duxbury, Assessment of pelletized biofuels, 2000 Search PubMed.
- M. Mobini, T. Sowlati and S. Sokhansanj, Appl. Energy, 2013, 111, 1239–1249 CrossRef.
- R. Ehrig, PhD thesis, Technical University (TU) Berlin 2014.
- P. Thornley, P. Gilbert, S. Shackley and J. Hammond, Biomass Bioenergy, 2015, 81, 35–43 CrossRef CAS.
- R. W. Matthews, Biomass Bioenergy, 2001, 21, 1–19 CrossRef.
- M. Elsayed, R. Matthews and N. Mortimer, Carbon and energy balances for a range of biofuels options, Resources Research Unit, Sheffield Hallam University Technical Report, 2003.
- J. Wickham, B. Rice, J. Finnan and R. McConnon, A review of past and current research on short rotation coppice in Ireland and abroad, COFORD and Sustainable Energy Authority of Ireland Technical Report, 2010.
- A. L. Stephenson and D. J. MacKay, Life Cycle Impacts of Biomass Electricity in 2020, Department of Energy and Climate Change Technical Report July, 2014.
- L. Gustavsson, P. Borjesson, B. Johansson and P. Svenningsson, Energy, 1995, 20, 1097–1113 CrossRef CAS.
- DECC, UK Bioenergy Strategy, DECC Technical Report April, 2012.
- J. Fargione, J. Hill, D. Tilman, S. Polasky and P. Hawthorne, Science, 2008, 319, 1235–1237 CrossRef CAS PubMed.
- R. J. Plevin, M. O'Hare, A. D. Jones, M. S. Torn and H. K. Gibbs, Environ. Sci. Technol., 2010, 44, 8015–8021 CrossRef CAS PubMed.
- T. Searchinger, Sound principles and an important inconsistency in the 2012 UK bioenergy strategy, Woodrow Wilson School of Public and International Affairs Technical Report, 2012.
- H. Haberl, D. Sprinz, M. Bonazountas, P. Cocco, Y. Desaubies, M. Henze, O. Hertel, R. K. Johnson, U. Kastrup, P. Laconte, E. Lange, P. Novak, J. Paavola, A. Reenberg, S. van den Hove, T. Vermeire, P. Wadhams and T. Searchinger, Energy Policy, 2012, 45, 18–23 CrossRef PubMed.
- European Commission, Impact Assessment, 2012.
- K. P. Overmars, E. Stehfest, J. P. M. Ros and A. G. Prins, Environ. Sci. Policy, 2011, 14, 248–257 CrossRef CAS.
- T. Searchinger, R. Heimlich, R. A. Houghton, F. Dong, A. Elobeid, J. Fabiosa, S. Tokgoz, D. Hayes and T. Yu, Science, 2008, 423, 1238–1241 CrossRef PubMed.
- M. R. Withers, R. Malina and S. R. H. Barrett, Ecological Economics, 2015, 112, 45–52 CrossRef.
- F. Cherubini, G. P. Peters, T. Berntsen, A. H. Strømman and E. Hertwich, GCB Bioenergy, 2011, 3, 413–426 CrossRef CAS.
- X. Lu and H. Herzog, Biomass to Liquid Fuels Pathways: A Techno-Economic Environmental Evaluation, 2015 Search PubMed.
- T. Gebreegziabher, A. O. Oyedun and C. W. Hui, Energy, 2013, 53, 67–73 CrossRef.
- C. J. Roos, Biomass Drying and Dewatering for Clean Heat & Power, US Department of Energy – CHP Technical Assistance Partnerships Technical Report September, 2008.
- T. Pacetti, L. Lombardi and G. Federici, J. Cleaner Prod., 2015, 101, 1–14 CrossRef.
- A. L. Borrion, M. C. McManus and G. P. Hammond, Biomass Bioenergy, 2012, 47, 9–19 CrossRef.
- T. Ramjeawon, J. Cleaner Prod., 2008, 16, 1727–1734 CrossRef CAS.
- M. C. Rulli, D. Bellomi, A. Cazzoli, G. De Carolis and P. D'Odorico, Sci. Rep., 2016, 6, 22521 CrossRef CAS PubMed.
- J. Khan and T. Powell, Office for National Statistics, London, UK, 2011, p. 5 Search PubMed.
- T. Skevas, S. M. Swinton and N. J. Hayden, Biomass Bioenergy, 2014, 67, 252–259 CrossRef.
- M. J. Aylott, E. Casella, I. Tubby, N. R. Street, P. Smith and G. Taylor, New Phytol., 2008, 178, 358–370 CrossRef PubMed.
- M. R. Schmer, K. P. Vogel, R. B. Mitchell and R. K. Perrin, Proc. Natl. Acad. Sci. U. S. A., 2008, 105, 464–469 CrossRef CAS PubMed.
- R. L. Graham, L. J. Allison and D. A. Becker, ORECCL – Summary of a National database on energy crop landbase, yields, and costs, 1997 Search PubMed.
- FAO, FAOClim-NET, http://geonetwork3.fao.org/climpag/ag roclimdb_ en.php.
- FAO, CROPWAT 8.0, http://www.fao.org/nr/water/infores _databases_cropwat.html.
- I. Dimitriou, PhD thesis, Swedish University of Agricultural Sciences, 2005.
- L. Sevel, T. Nord-Larsen, M. Ingerslev, U. Jørgensen and K. Raulund-Rasmussen, BioEnergy Res., 2014, 7, 319–328 CrossRef CAS.
- P. Heffer, Assessment of Fertilizer Use by Crop at the Global Level, International Fertilizer Industry Association (IFA) Technical Report August, 2013.
- FAO, FAOSTAT, http://www.fao.org/faostat/en/#homex.
- Y. Yimam, T. E. Ochsner and V. G. Kakani, Agricultural Water Management, 2015, 155, 40–47 CrossRef.
- IEAGHG, Water Intensity of Power Generation, 2013 Search PubMed.
- P. Börjesson, Biomass Bioenergy, 1996, 11, 305–318 CrossRef.
- S. Njakou Djomo, O. El Kasmioui, T. De Groote, L. S. Broeckx, M. S. Verlinden, G. Berhongaray, R. Fichot, D. Zona, S. Y. Dillen, J. S. King, I. A. Janssens and R. Ceulemans, Appl. Energy, 2013, 111, 862–870 CrossRef CAS.
- V. Forgie and R. Andrew, Life Cycle Assessment of Using Straw to Produce Industrial Energy in New Zealand, Landcare Research and New Zealand Centre for Ecological Economics Technical Report May, 2008.
- J. E. King, Reducing Bioenergy Cost by Monetizing Environmental Benefits of Reservoir Water Quality Improvements from Switchgrass Production, Coriolis Technical Report, 1999.
- L. Wang, Y. Qian, J. E. Brummer, J. Zheng, S. Wilhelm and W. J. Parton, Biomass Bioenergy, 2015, 75, 254–266 CrossRef CAS.
- X. Qin, T. Mohan, M. El-Halwagi, G. Cornforth and B. A. McCarl, Clean Technol. Environ. Policy, 2006, 8, 233–249 CrossRef CAS.
- Atlantic Consulting, LPG’s Carbon Footprint Relative to Other Fuels – A Scientific Review, 2009.
- S. Hinchliffe, R. V. Diemen, C. Heuberger and N. Mac Dowell, Transitions in Electricity Systems Towards 2030, The Energy Centre of the Institution of Chemical Engineers (IChemE) Technical Report October, 2015.
- VERSA, personal communication, 2016.
- T. W. Hertel, A. A. Golub, A. D. Jones, M. O'Hare, R. J. Plevin and D. M. Kammen, BioScience, 2010, 60, 223–231 CrossRef.
- C. Folberth, R. Skalský, E. Moltchanova, J. Balkovič, L. B. Azevedo, M. Obersteiner and M. van der Velde, Nat. Commun., 2016, 7, 11872 CrossRef CAS PubMed.
- B. E. Dale, J. E. Anderson, R. C. Brown, S. Csonka, V. H. Dale, G. Herwick, R. D. Jackson, N. Jordan, S. Ka, K. L. Kline, L. R. Lynd, C. Malmstrom, R. G. Ong, T. L. Richard, C. Taylor and M. Q. Wang, Environ. Sci. Technol., 2014, 48, 7200–7203 CrossRef CAS PubMed.
- A. K. Chapagain and A. Y. Hoekstra, Water footprint of nations. Volume 1: Main report, UNESCO-IHE Technical Report, 2004.
- EIA, Annual Energy Outlook 2016, 2015.
- J. Wilcox, CCS Leaders Forum, London, 2016 Search PubMed.
- M. Ranjan and H. J. Herzog, Energy Procedia, 2011, 4, 2869–2876 CrossRef CAS.
- R. Baciocchi, G. Storti and M. Mazzotti, Chem. Eng. Process., 2006, 45, 1047–1058 CrossRef CAS.
- Carbon Engineering, http://carbonengineering.com/our-technology/.
- I. Obernberger and G. Thek, The Pellet Hanbook, the production and thermal utilisation of biomass pellets, 2010, p. 600 Search PubMed.
- H. Li, Q. Chen, X. Zhang, K. N. Finney, V. N. Sharifi and J. Swithenbank, Appl. Therm. Eng., 2012, 35, 71–80 CrossRef.
- Q. X. Xu and S. S. Pang, Drying Technol., 2008, 26, 1344–1350 CrossRef.
- M. N. Haque, Drying Technol., 2007, 25, 547–555 CrossRef CAS.
- J. Selivanovs, D. Blumberga, J. Ziemele, A. Blumberga and A. Barisa, Environ. Clim. Technol., 2012, 10, 46–50 Search PubMed.
- D. A. Lewis and J. A. Tatchell, J. Sci. Food Agric., 1979, 30, 449–457 CrossRef.
- B. S. Panesar and A. P. Bhatnagar, Indian Society of Agricultural Engineers National Conference, 1981.
- R. E. Muller, in Energy in World Agriculture, ed. R. M. Peart and R. C. Brook, Elsevier, Amsterdam, vol. 5, 1992 Search PubMed.
- G. Kongshaug, IFA Technical Conference, Marrakech, 1998.
- M. Q. Wang, Development and Use of GREET 1.6 Fuel-Cycle Model for Transportation Fuels and Vehicle Technologies, 2001 Search PubMed.
- N. Mortimer, P. Cormack, M. A. Elsayed and R. E. Horne, Evaluation of the comparative energy, global warming and socio-economic costs and benefits of biodiesel, Sheffield Hallam University Technical Report, 2003.
- M. S. Graboski, National Corn Growers Association, 2002 Search PubMed.
- T. O. West and G. Marland, Agric., Ecosyst. Environ., 2002, 91, 217–232 CrossRef.
- H. Shapouri, The 2001 net energy balance of corn ethanol, U.S. Department of Agriculture (USDA) Technical Report, 2001.
- T. Nemecek and S. Erzinger, Special LCA Forum, Lausanne, 2003 Search PubMed.
- M. E.Walsh and D.Becker, BIOENERGY '96 - The Seventh National Bionergy Conference: Partnerships to Develop and Apply Biomass Technologies, Nashville, 1996.
- Energy Use and the U.S. Economy, Office of Technology Assessment, U.S. Congress, Technical Report June, 1990.
- Direct energy use in agriculture: opportunities for reducing fossil fuel inputs, DEFRA Technical Report May, 2007.
- P. S. Mehta and K. Anand, Energy Fuels, 2009, 23, 3893–3898 CrossRef CAS.
- L. Luo, E. van der Voet and G. Huppes, Renewable Sustainable Energy Rev., 2009, 13, 2003–2011 CrossRef CAS.
- Vehicle Technologies Program, Energy Efficiency and Renewable Energy, U.S. Department of Energy (DOE) Technical Report, 2011.
- M. Q. Wang, The Greenhouse Gases, Regulated Emissions, and Energy Use in Transportation (GREET) Model Version 1.5, 1999.
- J. E. A. Seabra, I. C. Macedo, H. L. Chum, C. E. Faroni and C. A. Sarto, Biofuels, Bioprod. Biorefin., 2011, 5, 519–532 CrossRef CAS.
- C. Walsh and A. Bows, Appl. Energy, 2012, 98, 128–137 CrossRef.
- G. P. Robertson, E. A. Paul, R. R. Harwood, L. E. Drinkwater, P. Wagoner, M. Sarrantonio, A. R. Mosier, D. Schimel, D. Valetine, K. Bronson, W. Parton, W. H. Schlesinger, A. R. Mosier, P. A. Matson, R. Naylor, I. Ortiz-Monasterio, R. A. Houghton, J. L. Hackler and K. T. Lawrence, Science, 2000, 289, 1922–1925 CrossRef CAS PubMed.
- R. Lal, Environ. Int., 2004, 30, 981–990 CrossRef CAS PubMed.
- M. C. Heller, G. A. Keoleian, M. K. Mann and T. A. Volk, Renewable Energy, 2004, 29, 1023–1042 CrossRef CAS.
- J. Sheehan, A. Aden, K. Paustian, J. Brenner, M. Walsh and R. Nelson, J. Ind. Ecol., 2004, 7, 117–146 CrossRef.
- Shipping, World Trade and the Reduction of C0 2, International Chamber of Shipping (ICS) Technical Report, 2013.
- C. De Klein, R. Novoa, S. Ogle, K. Smith, P. Rochette, T. Wirth, B. McConkey, A. Mosier and K. Rypdal, Lignes directrices 2006 du GIEC pour les inventaires nationnaux de gaz à effet de serre. Volume 4: Agriculture, foresterie et autres affectations des terres, 2006, pp. 1–60 Search PubMed.
- C. Dupont, R. Chiriac, G. Gauthier and F. Toche, Fuel, 2014, 115, 644–651 CrossRef CAS.
- J. Dai, B. Bean, B. Brown, W. Bruening, J. Edwards, M. Flowers, R. Karow, C. Lee, G. Morgan, M. Ottman, J. Ransom and J. Wiersma, Biomass Bioenergy, 2016, 85, 223–227 CrossRef.
- Y. Zhang, A. E. Ghaly and B. Li, Am. J. Eng. Appl. Sci., 2012, 5, 98–106 CrossRef.
- S. Sokhansanj, A. Kumar and A. F. Turhollow, Biomass Bioenergy, 2006, 30, 838–847 CrossRef.
- R. Samson, P. Girouard and Y. Chen, Evaluation of switchgrass and short-rotation forestry willow in Eastern Canada as bio-energy and agri-fibre feedstocks, Resource Efficient Agricultural Production (REAP) Canada Technical Report, 1997.
- R. Michel, N. Mischler, B. Azambre, G. Finqueneisel, J. Machnikowski, P. Rutkowski, T. Zimny and J. V. Weber, Environ. Chem. Lett., 2006, 4, 185–189 CrossRef CAS.
- N. G. Danalatos, S. V. Archontoulis and I. Mitsios, Biomass Bioenergy, 2007, 31, 145–152 CrossRef.
- D. G. Christian, P. R. Poulton, A. B. Riche and N. E. Yates, Biomass Bioenergy, 1997, 12, 21–24 CrossRef CAS.
- J. Copeland and D. Turley, National and regional supply/demand balance for agricultural straw in Great Britain, 2008 Search PubMed.
- A. Hastings, M. J. Tallis, E. Casella, R. W. Matthews, P. A. Henshall, S. Milner, P. Smith and G. Taylor, GCB Bioenergy, 2014, 6, 108–122 CrossRef CAS.
- Summary report soils test results and recommendations, Agricultural Analytical Services Laboratory, Penn State University Technical Report, 2014.
- S. B. McLaughlin, R. Samson, D. Bransby and A. Wiselogel, Evaluating physical, chemical, and energetic properties of perennial grasses as biofuels, 1996 Search PubMed.
- H. W. Elbersen, Switchgrass (Panicum virgatum L.) as an alternative energy crop in Europe - Initiation of a productivity network, Agrotechnological Research Institute (ATO-DLO) Technical Report, 2001.
- J. E. King, J. M. Hannifan and R. Nelson, An Assessment of the Feasibility of Electric Power Derived from Biomass and Waste Feedstocks, 1998 Search PubMed.
- M. Hall, Warm season grasses, Agronomy facts 29, Department of Crop and Soil Sciences, Penn State University Technical Report, 2010.
- A. Teel and S. Barnhart, Switchgrass Seeding Recommendation for the Production of Biomass Fuel in Southern Iowa, Iowa State University Technical Report, 2003.
- D. Styles and M. B. Jones, Environ. Sci. Policy, 2008, 11, 294–306 CrossRef CAS.
- L. van Bussel, The potential contribution of a short- rotation willow plantation to mitigate climate change, Wageningen University Technical Report, 2006.
- U. R. Boman and J. H. Turnbull, Biomass Bioenergy, 1997, 13, 333–343 CrossRef CAS.
- K. A. Thyö and H. Wenzel, Life Cycle Assessment of Biogas from Maize silage and from Manure, 2007 Search PubMed.
- W. Guidi, E. Piccioni and E. Bonari, Bioresour. Technol., 2008, 99, 4832–4840 CrossRef CAS PubMed.
- M. Manzone, G. Airoldi and P. Balsari, Biomass Bioenergy, 2009, 33, 1258–1264 CrossRef.
| This journal is © The Royal Society of Chemistry 2017 |

