The bridge between the materials and devices of thermoelectric power generators
Received
26th August 2016
, Accepted 17th November 2016
First published on 17th November 2016
Abstract
While considerable efforts have been made to develop and improve thermoelectric materials, research on thermoelectric modules is at a relatively early stage because of the gap between material and device technologies. In this review, we discuss the cumulative temperature dependence model to reliably predict the thermoelectric performance of module devices and individual materials for an accurate evaluation of the p–n configuration compared to the conventional model used since the 1950s. In this model, the engineering figure of merit and engineering power factor are direct indicators, and they exhibit linear correlations to efficiency and output power density, respectively. To reconcile the strategy for high material performance and the thermomechanical reliability issue in devices, a new methodology is introduced by defining the engineering thermal conductivity. Beyond thermoelectric materials, the device point of view needs to be actively addressed before thermoelectric generators can be envisioned as power sources.

Hee Seok Kim
| Dr Hee Seok Kim is a postdoctoral fellow in the department of physics and TcSUH at the University of Houston and was recently appointed as an assistant professor at the University of South Alabama. He received his PhD degree from the department of mechanical engineering at the University of Washington and his Master and Bachelor degrees in mechanical engineering from Sungkyunkwan University in Korea. His current research focuses on energy conversion devices and power/efficiency measurement systems from material to device level. He was awarded a Research Fellowship from Japan (2010) and has published over 20 peer-reviewed papers. |

Weishu Liu
| Dr Weishu Liu is an associate professor of materials science and engineering at Southern University of Science and Technology (SUSTec). He obtained his PhD degree from the University of Science and Technology Beijing in 2009. He was a post-doc at UW and BC, an associate researcher at UH, and a principal scientist at Sheetak Inc. His research interests include thermoelectric materials and their applications in waste heat harvesting, solar heat utilization, and wearable devices. He was a “China's National 1000-Youth Talent” fellow in 2016. He has published 62 journal papers with total citations of >2700 and an H-index of 29. |

Zhifeng Ren
| Zhifeng Ren, PhD, is M. D. Anderson Chair Professor in the Department of Physics and TcSUH at the University of Houston. He is experienced in materials synthesis, physics, and applications and has made seminar contributions to high temperature superconductors, carbon nanotubes, ZnO nanowires, thermoelectric materials, nano-bio materials and sensors, flexible transparent electrodes, efficient catalysts for hydrogen evolution reactions, 2D nanosheets for enhanced oil recovery, etc. He has published ∼400 journal papers and has 38 issued patents. He received the 2008 R&D 100 Award and the 2014 Edith and Peter O'Donnell Award. He is an elected APS fellow, AAAS fellow, and NAI fellow. |
Broader context
Thermoelectric devices generate electricity directly from thermal energy, and they are composed of dissimilar layers, such as electrodes, insulators, and bonding interfaces, and thermoelectric materials. Because of the differences in their physical characteristics, fabricating thermomechanically reliable devices is challenging even though various thermoelectric materials have been developed over the last decades with enhanced figures-of-merit (ZT). To use thermoelectric generators as primary energy sources, the device technology needs to be balanced with the material fabrication technology. This review summarizes and discusses a reliable prediction model for thermoelectric efficiency and output power, direct thermoelectric indicators representing practical performance, and the methodology of how to improve a material's ZT and device reliability. This will provide important guidance to estimate the realistic performance of materials and devices, which will help in the development of thermomechanically robust and thermoelectrically high-performing power generators.
|
1. Introduction
Thermoelectric technologies enable clean, sustainable power generation because of their direct conversion of heat to electricity with no global warming gas exhaust.1–3 This solid-state energy conversion technology is being applied to a wide range of applications, such as solar-thermoelectric power generators,4,5 ground6–9 or aerial10–12 vehicles, power plants,13,14 and personal power sources.15 The performance of a thermoelectric material is indicated by the dimensionless figure-of-merit, ZT, defined as:| |  | (1) |
where S, σ, κ, T, and PF are the Seebeck coefficient, electrical conductivity, thermal conductivity, absolute temperature, and power factor (=S2σ), respectively. The total thermal conductivity κ is expressed as κ = κlat + κcarr + κbipolar, where κlat, κcarr, and κbipolar are the lattice thermal conductivity, carrier thermal conductivity, and bipolar thermal conductivity, respectively. ZT indicates how efficiently a thermoelectric material can convert thermal energy to electric energy according to its operating temperature. In order to figure out a material's practical performance, direct measurements of the efficiency and output power generation are desired, but the experimental results vary depending on the measurement techniques and conditions or instruments. It is also important to correctly estimate the material's intrinsic efficiency and output power by an analytical or numerical method. Numerical methods for efficiency and output power predictions of thermoelectric materials and devices have been well developed based on a one-dimensional model with adiabatic conditions16–18 and a three-dimensional finite element analysis via commercial packages such as ANSYS19–21 or COMSOL.22–24 These numerical analyses can lead to practical predictions of efficiency and output power depending on the proper boundary and initial conditions, but the analyses are complicated and need simulation resources. In addition, this method does not have any explicit indicators for thermoelectric materials or devices, such as ZT and PF.
On the other hand, an analytical model for efficiency and output power prediction is simple and consistent. It also has less uncertainty depending on the various resources. The conventional analytical model was formulated in the 1950s based on the assumption that all physical properties are constant according to temperature, i.e., temperature independent, and the model has been commonly used. However, because of this assumption, the conventional model often overestimates or underestimates a material's efficiency, which may lead to the wrong design for thermoelectric module devices. Snyder et al.25 discussed the concept of a compatibility factor for a spatial temperature gradient when thermoelectric properties vary with temperature by matching the relationship between the heat flow and electrical current. Recently, to avoid a misunderstanding of the efficiency and output power, cumulative temperature dependence (CTD) models for thermoelectric materials26 and devices27 were developed and were based on an overall temperature dependence of the material properties at given temperature boundary conditions. The CTD models give rise to a reliable prediction of thermoelectric efficiency and output power compared with the conventional model. Additionally, the Thomson effect was ignored in the conventional model. Studies to account for the Thomson effect were reported under the condition of a constant Thomson coefficient,28–30 which is not practical in some cases, but the CTD model analytically takes into account the Thomson effect without any restrictions on the Thomson coefficient behavior. This provides practical fractions of Joule and Thomson heat returning to the hot end. It also shows direct indicators for thermoelectric efficiency with the engineering figure of merit (ZT)eng and for output power with the engineering power factor (PF)eng.
For the last decade, a reduction in thermal conductivity through nanostructure technology has been an effective route to improve ZT. This approach has shown dramatic ZT enhancement mainly due to reducing the lattice thermal conductivity κlat by intensive phonon scattering.31–36 Recently, high peak ZT values were reported in several materials, which were caused by a very low κlat, such as the peak ZT of 1.86 in Bi0.5Sb1.5Te3 with κlat = 0.3 W m−1 K−1,37 the peak ZT of 2.2 in PbTe:SrTe with κlat = 0.5 W m−1 K−1,38 the peak ZT of 2.3 in Cu2Se with κ = 0.15 W m−1 K−1,39 and the peak ZT of 2.6 in SnSe with κlat = 0.23 W m−1 K−1.40 Such low thermal conductivities lead to higher ZTs, but new challenges arise in designing thermoelectric generators at the device level. The reduced thermal conductivity allows for a higher thermal resistance in the thermoelectric material across the hot and cold side. This generates a larger temperature difference with a fixed length of the thermoelectric components or allows for a shorter length of the components corresponding to the given thermal boundary temperatures. A shorter length may lead to larger power generation when a cross-sectional area is fixed because of the reduced electrical resistance, and less consumption of materials leads to a larger specific power density, such as Watt per kg, Watt per volume, or Watt per dollar (cost). This is a superior design direction for thermoelectric devices. However, the shortened length because of the lowered thermal conductivity may cause a larger shear stress at the joining interfaces, a smaller thermal stress resistance, and a larger relative electrical or thermal contact resistance. Such thermomechanical vulnerability can cause position realignment of the thermoelectric components,41 cracks on the thermoelectric legs,42 degradation of the bonding strength between the thermoelectric component and metal electrodes,43etc., which eventually result in a deterioration of the output power performance. To avoid such vulnerability, various approaches such as a device design with tapered thermoelectric legs,44 various leg geometries,45 a linear structure with a dovetail-shaped electrode,12 an angled linear structure,46 and optimized component dimensions47,48 were investigated. However, those approaches focused on an alternative design for thermoelectric devices without considering a thermoelectric material's tuning strategy. Kim et al. demonstrated a methodology for how to balance between the thermal conductivity reduction in thermoelectric materials and the thermomechanical reliability of fully assembled thermoelectric devices.49
In this review, we summarize the analytical model for reliable prediction of thermoelectric efficiency and output power from the material to the device level based on the CTD model. In addition, the correlation of the efficiency vs. the engineering figure of merit (ZT)eng and the output power density vs. the engineering power factor (PF)eng are discussed. (ZT)eng and (PF)eng are direct thermoelectric indicators for efficiency and output power generation, respectively. We then review the methodology of how to reconcile the ZT improvement strategy by reducing the thermal conductivity and thermomechanical device reliability to create a thermoelectrically high-performance and thermomechanically stable system.
2. Cumulative temperature dependence model for homogeneous materials
The conversion efficiency of a thermoelectric generator was first derived by Altenkirch in 1909 based on the assumption of constant material properties, and this constant property model (CPM) identified the three desired material properties for good thermoelectric materials. These are a large Seebeck coefficient (S), low electrical resistivity (ρ), and low thermal conductivity (κ),50 where the electrical resistivity ρ is the reciprocal of the electrical conductivity, (ρ = σ−1). In 1957, Ioffe derived the thermoelectric efficiency formula as a function of the figure of merit ZT based on the CPM, and the formula is:51| |  | (2) |
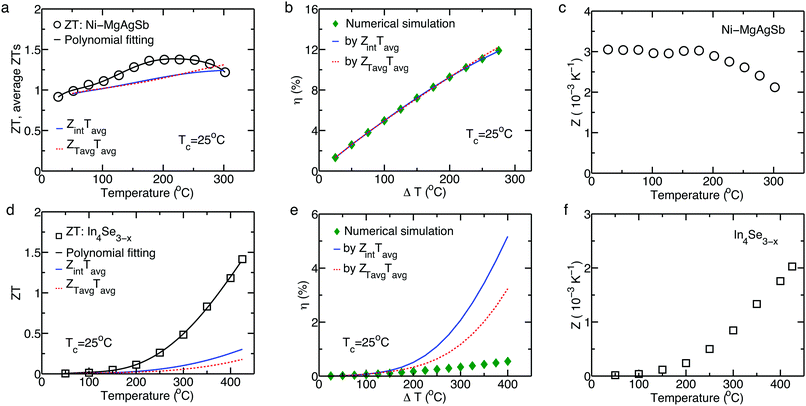
where Th, Tc, and Tavg are the hot side, cold side, and their average temperature, respectively. ηc is the Carnot efficiency, ηc = (Th − Tc)/Th. Z is defined as S2σ/κ in eqn (1). The peak ZT has been used to represent the performance of thermoelectric materials since the 1950s,1,52,53 but it only shows the performance at a specific temperature, which is not enough to represent a material's characteristics over the broad thermal boundary conditions used in a practical thermoelectric system operating environment. However, the efficiency prediction in eqn (2) based on the CPM is not reliable when Z is temperature-dependent. Because of the assumption of temperature independence in CPM, eqn (2) only correctly predicts the thermoelectric efficiency in limited materials that show a constant Z behavior or for materials with a small temperature gradient across the hot and cold side of the material.18,54,55 CPM often overestimates a material's efficiency.56,57S, ρ, and κ are temperature dependent in most thermoelectric materials, and the ZT profile is not linear with temperature.21,40,58–60 Additionally, thermoelectric materials operate at large temperature differences, so the efficiency prediction by eqn (2) is not reliable. To use eqn (2), the average Z can be obtained in two ways: (1) by integrating a temperature dependent Z with respect to temperature,  , and (2) by taking a Z value corresponding to the average temperature, ZTavg = Z(Tavg). The ZintTavg and ZTavgTavg are called the average ZTs. Fig. 1a shows the temperature-dependent ZT and average ZTs of the p-type Ni-doped MgAgSb,61 and their corresponding efficiencies from eqn (2) shown in Fig. 1b match with the numerical simulation because Z vs. T is not must different from a constant (Fig. 1c). The numerical simulations were carried out based on the finite difference method to account for the temperature dependence of S, ρ, and κ over a large temperature difference between the cold and hot sides.16,17 In Fig. 1d, however, the n-type In4Se3−x57 has larger variations in the average ZTs depending on how they were averaged because of the strong temperature dependence of Z (Fig. 1f), which results in different efficiency predictions (Fig. 1e). Even though the peak ZT of In4Se3−x is higher than that of the Ni-doped MgAgSb, the average ZTs and the predicted efficiency are much lower, which means that the peak ZT value is not the correct indicator of a material's efficiency. In addition, any average ZT cannot be a correct index because of the lack of consistency from the following reasons: (1) average ZTs vary based on the averaging technique (Fig. 1a and d), (2) ZTavg is estimated to be larger than Zint when the Z curve is in a convex upward shape (Fig. 1c) and vice versa (Fig. 1f), and (3) analytical prediction of some materials based on the average ZTs is far from the numerical analysis (Fig. 1e). For this reason, eqn (2) often misleads and gives rise to an impractically high efficiency prediction, and it is desirable to reliably predict the conversion efficiency of thermoelectric materials and module devices for a large temperature difference based on their temperature-dependent thermoelectric properties.
 |
| | Fig. 1
ZT vs. T for Ni-doped MgAgSb61 (a) and In4Se3−x57 (d), in which open symbols are measured data, and the black lines are fitted curves. The solid blue and dashed red lines are average ZTs by ZintTavg and ZTavgTavg, respectively. Efficiencies at Tc = 25 °C from a numerical simulation (solid diamonds) and CPM using integration (solid blue line) and average temperature (dashed red line) for Zavg of Ni-doped MgAgSb (b) and In4Se3−x (e). Z vs. T for Ni-doped MgAgSb (c) and In4Se3−x (f). Reproduced from ref. 26 with permission from the National Academy of Sciences. | |
2.1. Efficiency by the cumulative temperature dependence (CTD) model
The CTD model takes into account the overall effect of the temperature dependence of S, ρ, κ, and τ for a large temperature difference, where τ is the Thomson coefficient defined as TdS(T)/dT. No assumption is required to specify the type of temperature dependence of S, ρ, κ, and τ. In addition, the practical fractions of Joule and Thomson heat returning to the hot end are evaluated. The maximum efficiency by the CTD model is expressed as:26| |  | (3) |
where (ZT)eng is the engineering figure of merit, which is dependent on the temperature difference (ΔT), and is defined as:| | 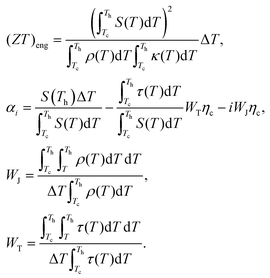 | (4) |
αi, WJ, and WT are a non-dimensional parameter and dimensionless weight factors of the Joule and Thomson heat, respectively.26 Calculating WJ and WT is essential to obtain a reliable prediction for the maximum efficiency from eqn (3). Since the cumulative effect of the temperature-dependence of ρ and τ is considered for a large temperature gradient in this model, the lumped approximation of 1/2 by the CPM,62i.e., half of the Joule and Thomson heat to the hot side, is not reasonable anymore, and the practical Joule and Thomson heat influencing the hot side should be evaluated. In the CTD model, if ρ(T) and τ(T) are assumed to be temperature independent, the weight factors become 1/2, indicating a lumped fraction of half of the Joule and Thomson heat on the hot side. This means that WJ and WT are a good general expression for the practical contribution of the Joule and Thomson heat. Moreover, eqn (3) is a generic expression that can be converted to the efficiency formula by the CPM (eqn (2)). Thus, the formula from the CTD model can be unrestrictedly applied to any case regardless of the temperature dependence of S, ρ, κ, and τ.
Fig. 2a shows the efficiency prediction for K doped PbTe1−ySey58 and SnSe40 with the temperature boundary condition that Th increases while Tc is kept at 50 °C. Fig. 2b shows how relatively accurate the efficiency calculations by the CPM and CTD models are compared with the efficiency from the numerical simulation (solid line), ηn, which is the most accurate. The calculation by CPM (eqn (2)) overestimates the efficiency for K doped PbTe1−ySey and SnSe compared with the numerical prediction, and the efficiency from the CTD model (eqn (3)) is close to the value from the numerical simulation. Fig. 2c shows the efficiencies for half-Heusler (HH: Hfx(ZrTi)1−xCoSb0.8Sn0.2)18 and skutterudite (SKU: Ce0.45Nd0.45Fe3.5Co0.5Sb12),54 and Fig. 2d shows their accuracy with respect to ηn. The calculated efficiencies for both materials from the CPM and CTD models are in good agreement with those from the numerical simulation. The small variations in HH and SKU compared to K doped PbTe1−ySey and SnSe are because of the linear-like behavior of S, ρ, and κ in HH and SKU based on temperature.
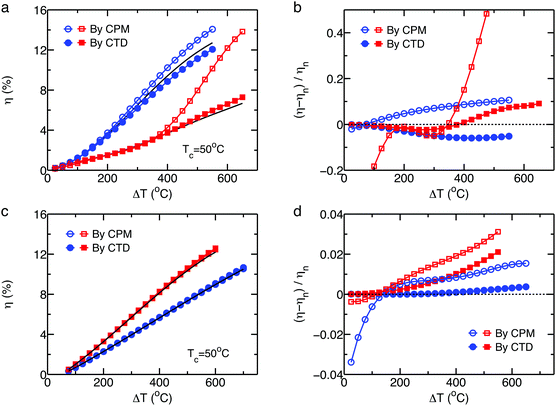 |
| | Fig. 2 (a) Predicted efficiencies as a function of ΔT and (b) relative accuracy with respect to the numerical results of K-PbTeSe (blue circles) and SnSe (red squares). (c) Predicted efficiency and (d) relative accuracy of HH (blue circles) and SKU (red squares). Reproduced from ref. 26 with permission from the National Academy of Sciences. | |
The accuracy is partially associated with the temperature dependent τ(T) representing the intensity of the Thomson heat (Fig. 3a). In order to examine the cumulative effect of the Thomson heat for a large temperature difference, the overall Thomson coefficient at a given thermal boundary condition is defined as  , which is shown in Fig. 3b, and the positive values of τΔT lead to an increased efficiency compared to that without the Thomson effect. Therefore, it is closer to the efficiency predicted by the numerical analysis. The reasons for the relative difference between the CTD model and numerical model are the linearized expression of dT/dx, and the different types of temperature dependence, i.e., a cumulative (or overall) effect in the CTD model and an instantaneous effect in the numerical model.
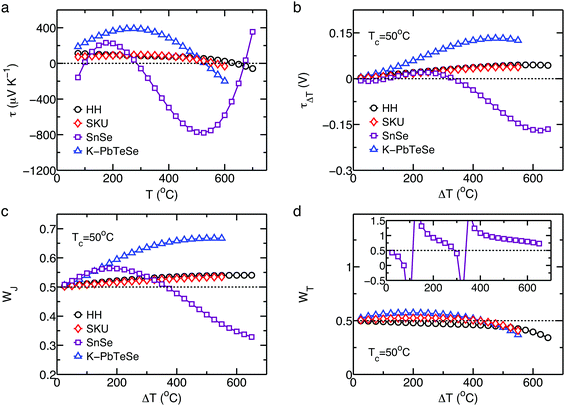 |
| | Fig. 3 (a) Calculated Thomson coefficient τ at each temperature and (b) the overall Thomson coefficient τΔT as a function of ΔT at Tc = 50 °C. ΔT-Dependent weight factor of WJ for the Joule heat (c), and WT for the Thomson heat (d), where Tc is fixed at 50 °C. Reproduced from ref. 26 with permission from the National Academy of Sciences. | |
Fig. 3c and d shows ΔT-dependent weight factors for the Joule and Thomson heats, respectively, based on the CTD model. In Fig. 3c, the WJ above 1/2 indicates that a higher fraction of the Joule heating returns to the hot side than that calculated by CPM because of the increased trend of ρ(T). In Fig. 3d, the WT below 1/2 means that the Thomson heat on the heat flux at the hot end is smaller than the simply lumped fraction from the CPM since the dS/dT decreases.18,54,58 The diverged WT (inset in Fig. 3d) means τΔT becomes zero (Fig. 3b), indicating that no overall effect of the Thomson heat at the temperature difference is considered even though the Thomson heat exists at each temperature.
2.2. Output power by the cumulative temperature dependence (CTD) model
The output power density, W m−2, at the maximum efficiency, including the Thomson effect based on the CTD model, is expressed as:26| |  | (5) |
where the external load resistance is equal to the internal resistance of a thermoelectric leg, and (PF)eng is the engineering power factor in the unit of W m−1 K−1, which is defined as:| |  | (6) |
The output power density is dependent on the thermoelectric leg's length (L) as well as the material properties. Fig. 4a and b shows the output power densities of HH and SnSe according to ΔT at Tc = 50 °C, in which a cubic-shape thermoelectric leg (2 × 2 × 2 mm3) is considered for the prediction of the output power generation. For the output power density calculation by the CPM, the conventional power factor PF is calculated from a simply averaged S and ρ at a given temperature difference. The (PF)eng based prediction of the power density for HH and SnSe has a better agreement with the numerical prediction than the conventional PF. In Fig. 4c, (PF)eng shows a similar tendency to the power density by the numerical simulation (Fig. 4a and b), indicating an intrinsic power generation performance of a thermoelectric material, which has different trends from PF (Fig. 4d). Thus, (ZT)eng and (PF)eng enable one to directly compare the level of a material's performance at any operating temperature difference without the detailed calculations for efficiency and output power generation.
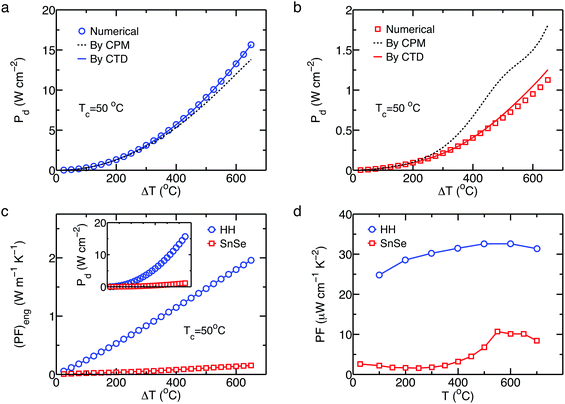 |
| | Fig. 4 Output power densities of (a) HH and (b) SnSe based on ΔT for a cubic-shape thermoelectric leg. (c) ΔT dependent (PF)eng for HH and SnSe at Tc = 50 °C showing the same tendency for the power density Pd curves (inset). (d) Temperature dependent power factor PF for HH and SnSe. | |
The units of (PF)eng from the CTD model are different from that of the conventional PF. By this definition, PF gives the power density output for a given T, where the Seebeck coefficient S in PF is measured at a certain temperature T with a very small ΔT (a few degrees) compared to T (hundreds T). So, PF represents the potential for output power at a temperature, not ΔT, i.e., there is no ΔT information (Th and Tc) in the conventional PF. The concept of (PF)eng is the total amount of potential for output power at a given ΔT (Th and Tc), which is imposed by the integral. That is why the units of (PF)eng (W m−1 K−1) are PF (W m−1 K−2) times the temperature (K) that is the units of accumulation under ΔT condition.
3. Direct thermoelectric indicators
To describe the overall performance of a material in its operating temperature range, an average ZT (ZT)avg of a material with given thermal boundary conditions has been reported.61,63–65 However, the (ZT)avg is insufficient because is varies depending on how it is averaged. Alternatively, an effective ZT (ZT)eff has been used,66–68 which is more reliable than the (ZT)avg, but it does not account for the effect of a temperature difference and only indicates an equivalent value at an averaged temperature. The previous section showed that (ZT)eng and (PF)eng represent the cumulative performance of a material for given boundary temperature conditions. Fig. 5a shows the ZT for selected p-type and n-type thermoelectric materials. ZT is not a direct indicator of the thermoelectric conversion efficiency since it does not indicate which material performs better without additional complicated calculations or experimental results at practical operating temperatures. However, Fig. 5b shows the (ZT)eng, which is a ΔT dependent indicator for efficiency at given temperature boundary conditions, for materials. In this section, the one-to-one correspondence between (ZT)eng and the conversion efficiency of a material is discussed, and it is shown that the output power density has a linear relationship with (PF)eng.
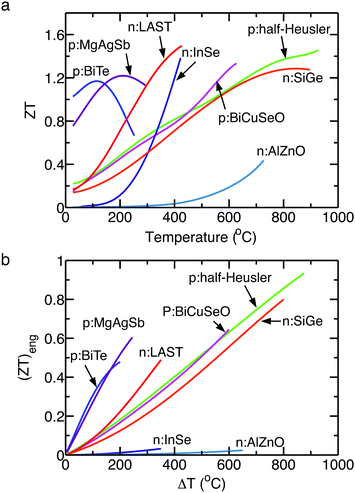 |
| | Fig. 5 (a) ZT dependence on temperature and (b) (ZT)eng dependence on the ΔT of selected n-type and p-type materials. For (ZT)eng, a cold side temperature Tc is assumed to be 50 °C for all materials. p:BiTe, unpublished data; p:MgAgSb, ref. 69; p:BiCuSeO, ref. 70; p:half-Heusler, ref. 71; n:InSe, ref. 57; n:AlZnO, ref. 72; n:LAST, ref. 73; n:SiGe, ref. 74. | |
3.1. (ZT)engvs. efficiency
The efficiencies of the state-of-the-art p-type and n-type materials at their corresponding maximum operable temperature Th,max are plotted in Fig. 6a in terms of their average ZT,  , where Tc is fixed at 50 °C for all materials. The efficiency ηn is calculated based on a finite difference analysis,16,17,49 which takes into account the temperature dependence of S, ρ, and κ as well as the Thomson effect. The p-type and n-type materials and their maximum operable temperatures are listed in Table 1. The scattered pattern in Fig. 6a shows that (ZT)avg is not a direct indicator of a material's maximum efficiency. For example, p-type Bi2Te3 has a 30% lower efficiency with a 40% higher (ZT)avg compared to BiCuSeO. Thus, (ZT)avg is not adequate to represent a material's overall performance. Instead of (ZT)avg, (ZT)eff gives rise to proper characteristics, which are
  .66Fig. 6b shows the efficiency corresponding to the (ZT)eff of the materials. The relationship of ηnvs. (ZT)eff still shows a scattered pattern, so (ZT)eff is also not effective for reliable prediction of a material's efficiency under operable temperature conditions. Fig. 6c plots the efficiencies of the materials according to their (ZT)eng. From the correlation between ηnvs. (ZT)eng, the conversion efficiency of a material can be recognized by evaluating (ZT)eng without efficiency calculations. For example, a (ZT)eng of 0.6 represents about a 10% conversion efficiency regardless of the type of material, which makes it reasonable to compare the performances of different materials. This relationship has the benefit of taking into account each accumulated property based on ΔT rather than Tavg.
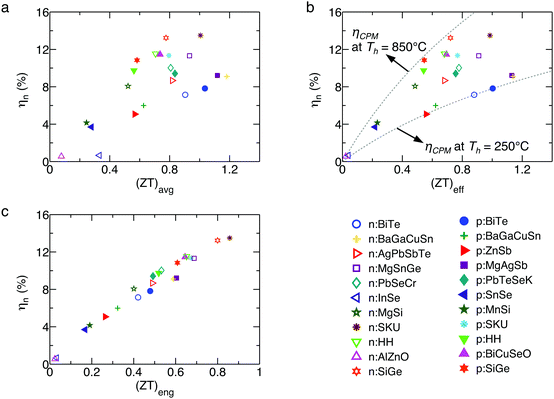 |
| | Fig. 6 The predicted efficiency of materials as a function of (a) (ZT)avg, (b) (ZT)eff, and (c) (ZT)eng with all efficiencies evaluated by a numerical simulation accounting for the temperature dependence of each property. Tc is fixed at 50 °C for all efficiencies. | |
Table 1 The maximum operable temperature for p-type and n-type materials at the hot side
| p-Type |
n-Type |
| Material |
T
h,max (°C) |
Ref. |
Material |
T
h,max (°C) |
Ref. |
|
Unpublished data.
|
| Bi0.4Sb1.6Te3 |
250 |
|
Bi2Te2.7Se0.3S0.015 |
250 |
|
| β-Zn4Sb3 |
250 |
75
|
Ba8Ga14Cu2Sn30 |
275 |
76
|
| Ba8Ga15.75Cu0.25Sn30 |
275 |
76
|
AgPbmSbTem+2 |
400 |
73
|
| MgAgSb |
295 |
69
|
In4Se3−x |
400 |
57
|
| Pb0.98Te0.75Se0.25K0.02 |
450 |
58
|
Mg2Sn0.75Ge0.25 |
450 |
77
|
| SnSe |
450 |
40
|
Pb0.995SeCr0.005 |
450 |
78
|
| MnSi1.78 |
500 |
79
|
Ba0.08La0.05Yb0.04Co4Sb12 |
550 |
80
|
| Ce0.45Nd0.45Fe3.5Co0.5Sb12 |
550 |
54
|
Mg2Si-0.5 at% Sb/1.0 at% Zn |
550 |
81
|
| Hf0.19Zr0.76Ti0.048CoSb0.8Sn0.2 |
650 |
18
|
Hf0.25Zr0.75NiSn0.99Sb0.01 |
650 |
82
|
| Bi0.875Ba0.125CuSeO |
650 |
70
|
ZnO-0.25 at% Al |
700 |
72
|
| Si80Ge20B5 |
850 |
32
|
Si80Ge20P2 |
850 |
74
|
3.2. (PF)engvs. output power density
The thermoelectric leg length was determined to satisfy a constant temperature gradient of 200 °C mm−1, e.g., 3 mm length of a material for ΔT = 600 °C. In Fig. 7a, the average power factor (PF)avg has a scattered relationship to Pd by the numerical simulation, similar to ηnvs. (ZT)avg, as shown in Fig. 6a. This shows that (PF)avg is insufficient for directly indicating the output power performance of materials. In contrast, Fig. 7b illustrates the linear correlation between Pd and (PF)eng under a constant temperature gradient. This indicates that a material's (PF)eng represents its output power density for a given temperature condition by accounting for the cumulative effect of the temperature dependent S(T) and ρ(T). Fig. 7c shows the relative Pd and the ratio of Pd from a numerical computation to PCTDd by the CTD model, which explains that the variation comes from the fact that the CTD model accounts for path independence according to temperatures while the numerical model accounts for an instantaneous temperature dependence.
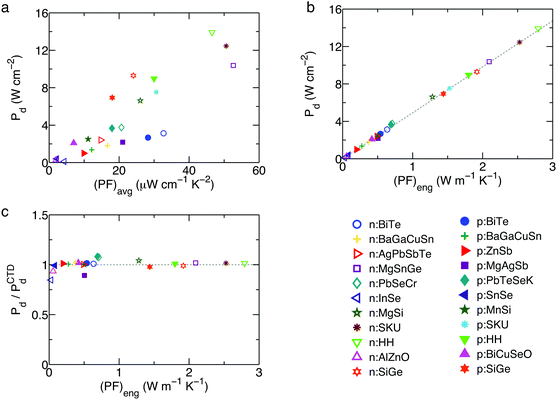 |
| | Fig. 7 The predicted output power density as a function of (PF)avg (a) and (PF)eng (b). The dashed lines in (b) represent Pdvs. (PF)eng evaluated by the CTD model. (c) Relative Pd and a ratio of Pd from a numerical simulation to Pd by the CTD model. For all Pd computation, Tc is fixed at 50 °C. | |
4. Cumulative temperature dependence model for p–n module devices
The energy conversion efficiency of a typical thermoelectric module consisting of p-type and n-type materials connected thermally in parallel and electrically in a series is a function of the maximum device figure of merit [Z]* of a p–n pair, defined as:62| |  | (7) |
which is a function of S, ρ, and κ. The subscript p and n denote p-type and n-type materials, respectively. The square brackets and superscript asterisk indicate the p–n module and the maximum property, respectively. The maximum efficiency and output power density of a thermoelectric module have been analytically calculated based on the assumption that S, ρ, and κ are temperature independent as:62| |  | (8) |
| |  | (9) |
This is reasonably accurate when the operating temperature difference ΔT is small, or when [Z]* is temperature independent over the operating temperature range, but most thermoelectric material properties are strongly temperature dependent. Hence, the conventional model by eqn (8) and (9) is not reliable for the prediction of the practical conversion efficiency of thermoelectric modules operating at large temperature differences between the hot and cold sides. As thermoelectric modules operate with a pairing of p-type and n-type materials, a balance of thermal flow and electric current for dissimilar p-type and n-type materials is also required. This section reviews the maximum efficiency of thermoelectric modules based on the CTD model, which leads to more reliable predictions than the CPM, the maximum device engineering figure of merit [ZT]eng* and the maximum device engineering power factor density [PF]eng,d* as direct indicators of a thermoelectric module at practical temperature differences. Two case studies of p–n pairings are shown: (1) chalcogenides: K0.02Pb0.98Te0.75Se0.25 (p-type)58 and Pb0.995SeCr0.005 (n-type),78 and (2) chalcogenides: SnSe (p-type)40 and PbSe (n-type).78
4.1. Maximum efficiency and output power density of p–n module by the CTD model
The maximum efficiency of a p–n module device by the CTD model and its corresponding [ZT]eng* are defined as:27| |  | (10) |
| |  | (11) |
where [α]i is the non-dimensional parameter of the p–n module.27 [η]CTD* from eqn (10) is obtained by optimizing the device engineering figure of merit [ZT]eng, in which each p-type and n-type material satisfies the geometry conditions for maximum efficiency. The maximum power density [Pd]CTD* of a p–n module is defined as:27| | 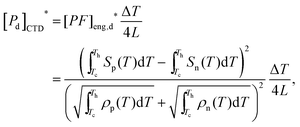 | (12) |
where L = Ln = Lp. The maximum output power is assumed to be generated when the external load resistance is equal to the internal resistance, Rp + Rn.
[η]CTD* for a p-PbTe/n-PbSe paired module is shown in Fig. 8a, and the prediction by CPM underestimates the efficiency over the whole ΔT range. The CTD model efficiency prediction is accurate over the whole temperature range compared to the simulation result. For the p-SnSe/n-PbSe combination shown in Fig. 8b, the CTD model predicts efficiency by a 3% relative difference at ΔT = 400 °C from the numerical analysis while the prediction by the CPM is a 17% overestimation. In some cases, however, the CPM analysis is more accurate than the CTD model,27 but this is because the averaged material properties are accidentally close to each equivalent property. Thus, the analysis by the CPM is not reliable.
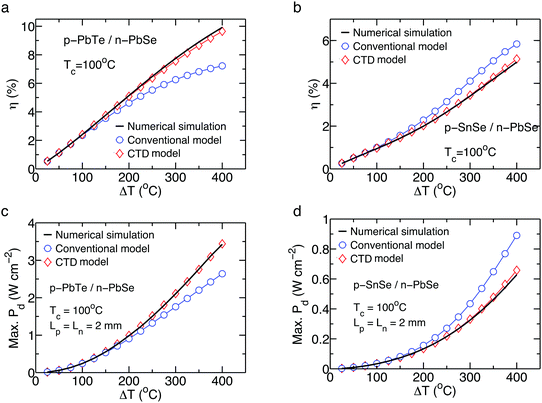 |
| | Fig. 8 The maximum efficiency as a function of ΔT for a p–n module of (a) p-PbTe/n-PbSe and (b) p-SnSe/n-PbSe. The maximum output power density as a function of ΔT for a p–n module of (c) p-PbTe/n-PbSe and (d) p-SnSe/n-PbSe. Reproduced from ref. 27 with permission from the American Institute of Physics. | |
The [Pd]CPM* prediction for p-PbTe/n-PbSe (Fig. 8c) and p-SnSe/n-PbSe (Fig. 8d) shows a large relative difference at ΔT = 400 °C compared to the simulation results. Because the prediction by the CPM is only reliable when thermoelectric properties have a weak temperature dependence, such as SKUs54,80 and HHs,18,82 the CTD model leads to a more accurate prediction through the whole ΔT range (Fig. 8c and d) compared to the numerical simulation. The differences between the CTD model and numerical analysis could result from the type of p–n pairs, type of temperature dependence of each material, integration, simulation conditions and the assumption of a linear temperature profile. The differences are also caused by the fact that the CTD model accounts for the path-independence of material properties according to the temperature while the numerical analysis incorporates the path-dependence along with the temperature.
4.2. Direct indicator of the p–n module
For the p-PbTe/n-PbSe assembly, the simply averaged (ZT)eng for the p-type and n-type materials is in good agreement with the [ZT]eng* for their corresponding p–n module within a 1% relative difference, as shown in Fig. 9b, while the averaged (ZT)eng of the p-SnSe/n-PbSe is overrated by 47% compared to the [ZT]eng* of the module at ΔT = 400 °C, as shown in Fig. 9a. The module efficiency should be carefully predicted by simply averaging the ZTs of the p-type and n-type materials, which often overestimate the module efficiency (Fig. 9a). Fig. 9c shows the module efficiency [η]CTD* for selected p–n configurations according to their corresponding [ZT]eng*, showing a linear correlation similar to ηnvs. (ZT)eng for the individual materials, as shown in Fig. 6c. From this correlation, a module with a [ZT]eng* of 0.6 expects about 10% of the module efficiency regardless of the combination of the p-type and n-type materials or the operating temperature range. Fig. 9d shows the linear correlation between [Pd]CTD* and [PF]eng,d*, indicating that the [PF]eng,d* of a p–n configuration represents the module's output power density at a given leg geometry, similar to Pdvs. (PF)eng shown in Fig. 7b. Thus, [ZT]eng* and [PF]eng,d* directly represent a device's efficiency and output power density, respectively.
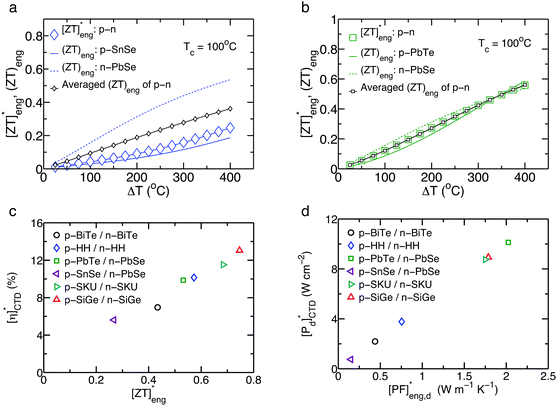 |
| | Fig. 9 Comparison of [ZT]eng* (larger symbols), (ZT)eng of individual p- (solid lines) and n-type (dashed lines) materials, and their averaged (ZT)eng (smaller symbols) in (a) p-SnSe/n-PbSe and (b) p-PbTe/n-PbSe. (c) The predicted efficiencies of the module devices by the CTD model as a function of (ZT)eng. Tc is fixed at 50 °C. Reference materials are Bi2Te3 of p-type,37 HH of p-type18 and n-type,82 p-type PbTe,58 n-type PbSe,78 p-type SnSe,40 SKU of p-type54 and n-type,80 SiGe of p-type32 and n-type,74 and n-type Bi2Te3. Reproduced from ref. 27 with permission from the American Institute of Physics. | |
5. Engineering thermal conductivity κeng: balance between the thermal conductivity reduction of thermoelectric materials and device reliability
Because reducing the lattice thermal conductivity of thermoelectric materials is an effective strategy to improve ZT,31,33,35,37–40 one may have the following questions: is there a lower limit of thermal conductivity for a thermoelectric material? What is expected when the thermal conductivity continues to decrease? This section reviews how to figure this out by defining an engineering thermal conductivity (κeng) that is the allowable minimum thermal conductivity of a thermoelectric material to ensure a module device is thermomechanically reliable and thermoelectrically high-performing.49κeng highlights the lower limit of the thermal conductivity by reconciling the reduction of thermal conductivity and device reliability in static operations, and it guides the sustainability of a thermoelectric material to transient thermal impacts. A methodology is presented to evaluate κeng for a steady state and transient operation. A case study for Bi2Te3 indicates that ZT improvement by reducing the thermal conductivity influences the device reliability, so how to improve the performance of thermoelectric materials in a reliable module device in a balanced way by considering κeng should be discussed.
5.1.
κ
eng at steady-state operation
A reliable thermoelectric device at a steady-state operation requires an appropriate L range of thermoelectric legs to avoid failure at interfaces due to thermal shear stresses from shorter L, which is associated with a κ-independent Lmin. A longer leg length gives rise to degradation of the output power generation because of the higher electrical resistance and material failure resulting from a temperature gradient larger than its maximum limit, which is associated with the κ-dependent Lmax. The optimized L for the thermoelectric legs should be Lmin < L < Lmax to satisfy both device reliability and ZT improvement by reducing the thermal conductivity. Fig. 10 illustrates how to evaluate κeng based on a Lmax and Lmin analysis. Once materials of all the components, including bonding types for a module assembly, are determined, the thermal conductivity and allowable ΔTmax of thermoelectric legs are known. When the input heat flux (qin) is given as a boundary condition, the κ-dependent Lmax is determined. The explicit form of Lmax is expressed as:49| |  | (13) |
where ![[P with combining macron]](https://www.rsc.org/images/entities/i_char_0050_0304.gif) F is the averaged power factor of a thermoelectric material.
F is the averaged power factor of a thermoelectric material.
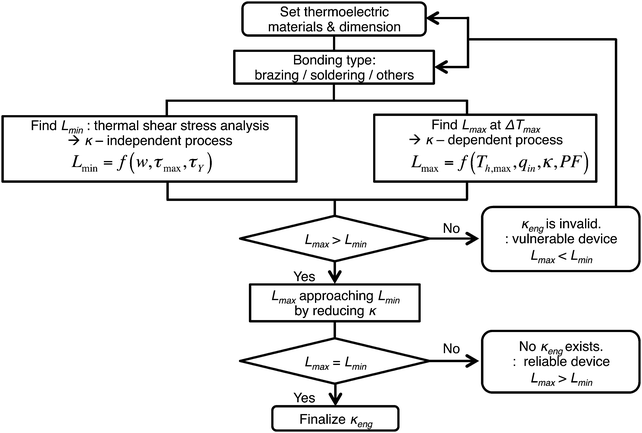 |
| | Fig. 10 Flow chart for κeng evaluation in a steady state mode. | |
L
min is determined based on the half width (w) of a thermoelectric leg, the maximum thermal shear stress (τmax), and critical criteria (τY). The maximum shear stress τmax is expressed based on the 1-pair thermoelectric assembly model (Fig. 11) by Suhir et al.83–85 as:
| |  | (14) |
τ∞ is the shear stress at the edge in an assembly of infinite
w with continuous bonding,
85 and
χr is a dimensionless reduction factor associated with the module design.
49fce is a fraction factor showing a ratio of cross-section areas of the total area to the thermoelectric legs.
k is the interfacial shearing stress.
49,85 The critical criteria
τY can be the yield strength of solder or brazing materials, bonding strength at interfaces, or any types of material failure strength. For a conservative module design, the lowest value among the possible
τY should be selected. For a reliable design, the
τmax from
eqn (14) needs to be less than the
τY,
i.e.,
τmax <
τY, and the
Lmin can be determined at
τmax =
τY. According to the
Lmax and
Lmin evaluation, if
Lmax <
Lmin, the
κeng evaluation is not available, which means that this design is always vulnerable and the material geometry and/or bonding configuration should be modified. If
Lmax >
Lmin,
Lmax can decrease by reducing the thermal conductivity of a thermoelectric material for
ZT improvement. Further reduction of
κ makes
Lmax approach
Lmin. When
Lmax becomes equal to
Lmin, the corresponding
κ is the
κeng that is analytically expressed as:
49| |  | (15) |
If
Lmax is still larger than
Lmin even though
κ approaches zero, the thermoelectric module is robust enough for reducing the
κ of a thermoelectric material with respect to the selected
τY. Thus, the
κeng indicates the lower limit of the thermal conductivity by reconciling the material's tuning strategy (
κ reduction) and device reliability.
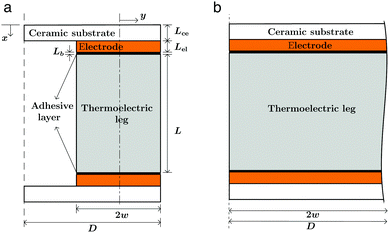 |
| | Fig. 11 (a) Schematic illustration of the model for the shear stress evaluation. w is the half width of the leg, and D is the half width of the ceramic substrate in the 1-pair assembly. (b) An infinitely long assembly with a continuous bond. Lce, Lel, and Lb are the lengths of the ceramic substrate, electrode, and solder/brazing layer, respectively. | |
5.2.
κ
eng on transient operation
In some applications, thermoelectric devices operate under thermal boundary conditions that change over time and vary from place to place, such as waste heat recovery systems in automobiles or combustion-thermoelectric generators under irregular thermal fluctuations.86 Such thermal loadings or impact at transient operations give rise to crack initiations or failure in thermoelectric materials because thermoelectric materials are mostly brittle. The failure of brittle ceramics by thermal loadings or shocks has been investigated through the thermal stress resistance parameter,87–90 but not much attention has been paid to thermoelectric materials. For this issue, a homogeneous thermoelectric leg with an infinite width shown in Fig. 12 was examined,49 and temperature-independent material properties were assumed at a constant heat transfer coefficient h with a mild thermal impact.87 The maximum allowable temperature change ΔTcr to avoid failure by a transient thermal loading is given as:90| |  | (16) |
where σu, ν, α, and E are the ultimate strength, Poisson's ratio, coefficient of thermal expansion (CTE), and Young's modulus of a thermoelectric material, respectively. The ratio of σu to E for a material usually has little variation because of their proportional relationship to each other, and α and h are the intrinsic material property and environmental factor of the heat exchangers or thermal boundaries, respectively, and the ratio of κ to L is only susceptible to the ΔTcr against the transient thermal loadings. For a thermoelectric operation, ΔTcr should exceed the ΔTmax to avoid immediate failure of a thermoelectric material. Based on eqn (16) and the condition of ΔTcr > ΔTmax, the engineering thermal conductivity κeng in a transient state when ΔTcr = ΔTmax at L = Lmin is defined as:49| |  | (17) |
which is the minimum thermal conductivity of a thermoelectric material allowing for ΔTmax without failure from transient thermal boundary conditions. In this case, the κeng at a transient operation is evaluated using only the thermoelectric material, not the whole module assembly, but this indicates a material's intrinsic reliability against a dynamic thermal loading as a pertinent material property. Thus, the κeng at the transient mode is a type of design factor against failure depending on the dynamic thermal boundary conditions.
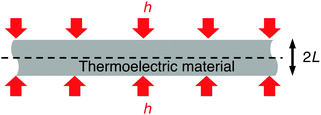 |
| | Fig. 12 Thermoelectric leg with infinite width for κeng evaluation in a transient mode. | |
5.3. Case study: Bi2Te3 based module
5.3.1.
L
min evaluation.
The ratio of τY to τ∞ and the shear stress reduction factor χr of a Bi2Te3 based module is shown in Fig. 13a as a function of L/Ltot, and the thickness of the ceramic plates, electrodes, and solder layers are 0.7, 0.5, and 0.07 mm, respectively, and fce = 2.86 (35% filling factor). The mechanical properties of each component are listed in Table 2. The τY can be the yield strength of a solder layer ranging from 22.8 to 27.8 MPa at room temperature for various solder alloys applicable to the Bi2Te3 based module assembly,91 the fracture strength of Bi2Te3, such as 34 MPa ultimate tensile strength at room temperature,92 or the bonding strength of the Ni metallization – Bi2Te3 leg configuration, which was measured up to 30 MPa at room temperature.93 For a conservative design of the module, the yield strength (lower value of τY) of the solder alloys leads to Lmin of the thermoelectric leg with a cross sectional area of 1.6 × 1.6 mm2 (w = 0.8 mm),68 and Lmin should be longer than 0.77 mm under the maximum ΔT = 150 °C at Tc = 50 °C when τY = 25.7 MPa. The critical w–Lmin relationship for the thermomechanical reliability is shown in Fig. 13b, where it is reliable when the selected w and L are placed in the upper zone of the border. If not, the interfacial structure in the module is vulnerable at the operating condition.
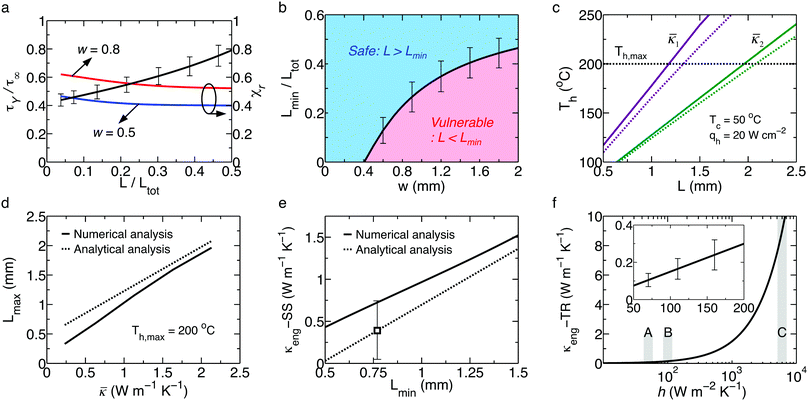 |
| | Fig. 13 (a) The τY/τ∞ and reduction factor χr of the shear stress as a function of non-dimensional length, L/Ltot. The various yield strengths of solders (23–28 MPa) are shown as error bars. (b) The w vs. L/Ltot relationship to avoid the yield criteria of the solder. (c) The hot side temperature with L according to ![[small kappa, Greek, macron]](https://www.rsc.org/images/entities/i_char_e0cb.gif) . The horizontal line indicates Th,max. The solid and dashed curves indicate the numerical and analytical analyses, respectively, where . The horizontal line indicates Th,max. The solid and dashed curves indicate the numerical and analytical analyses, respectively, where ![[small kappa, Greek, macron]](https://www.rsc.org/images/entities/i_char_e0cb.gif) 1 = 1.13 and 1 = 1.13 and ![[small kappa, Greek, macron]](https://www.rsc.org/images/entities/i_char_e0cb.gif) 2 = 2.13 W m−1 K−1. (d) The Lmax associated with 2 = 2.13 W m−1 K−1. (d) The Lmax associated with ![[small kappa, Greek, macron]](https://www.rsc.org/images/entities/i_char_e0cb.gif) at a given thermal boundary. (e) The κeng at a steady state with Lmin. (f) The κeng at a transient mode as a function of h. (A) h = 50 (forced convection by air), (B) h = 100 (natural convection by water), and (C) h = 6000 (forced convection by water) W m−2 K−1. Reproduced from ref. 49 with permission from the Wiley-VCH. at a given thermal boundary. (e) The κeng at a steady state with Lmin. (f) The κeng at a transient mode as a function of h. (A) h = 50 (forced convection by air), (B) h = 100 (natural convection by water), and (C) h = 6000 (forced convection by water) W m−2 K−1. Reproduced from ref. 49 with permission from the Wiley-VCH. | |
Table 2 Bi2Te3 based module: mechanical properties of each component as input data
| Component |
Young's modulus (GPa) |
Poisson's ratio |
CTE (×10−6 °C−1) |
Yield strength at 25 °C (MPa) |
| AlN plate94 |
320 |
0.237 |
4.2 |
— |
| Cu electrode91 |
115 |
0.31 |
17 |
— |
| Sn–Sb solder84,91 |
44.5 |
0.33 |
27 |
25.7 |
| p-Type Bi2Te344,47 |
47.9 |
0.4 |
16.8 |
112 |
5.3.2.
L
max evaluation.
To figure out the hot side temperature of the thermoelectric leg when the input heat flux qh is given, a numerical simulation by a finite difference method was carried out based on a realistic assembly model accounting for the temperature dependence of the material properties. Fig. 13c shows the L-dependent hot side temperature of the Bi0.4Sb1.6Te3 leg according to the leg's average thermal conductivity where Th,max = 200 °C. In Fig. 13d, Lmax is 1.15 mm by the numerical analysis and 1.33 mm by eqn (13). If the thermal conductivity is further reduced from ![[small kappa, Greek, macron]](https://www.rsc.org/images/entities/i_char_e0cb.gif) = 1.13 W m−1 K−1 to
= 1.13 W m−1 K−1 to ![[small kappa, Greek, macron]](https://www.rsc.org/images/entities/i_char_e0cb.gif) = 0.6 W m−1 K−1, Lmax becomes 0.68 mm and 0.95 mm by the numerical and analytical models, respectively, where qh is assumed to be 20 W cm−2, which is in a typical heat flux density range (up to 40 W cm−2) for most thermoelectric applications.95 The Lmax according to
= 0.6 W m−1 K−1, Lmax becomes 0.68 mm and 0.95 mm by the numerical and analytical models, respectively, where qh is assumed to be 20 W cm−2, which is in a typical heat flux density range (up to 40 W cm−2) for most thermoelectric applications.95 The Lmax according to ![[small kappa, Greek, macron]](https://www.rsc.org/images/entities/i_char_e0cb.gif) by the analytical model (eqn (13)) outweighs the Lmax by the numerical analysis over the whole
by the analytical model (eqn (13)) outweighs the Lmax by the numerical analysis over the whole ![[small kappa, Greek, macron]](https://www.rsc.org/images/entities/i_char_e0cb.gif) range. This is mainly because of the absence of the Thomson heat as well as the assumption of the temperature independence of S, ρ and κ in the analytical model. This leads to an underrated κeng in a steady-state mode by the analytical model as 0.4 W m−1 K−1 at Lmin = 0.77 mm while the κeng evaluated by the numerical analysis is more conservative with a larger κeng (0.7 W m−1 K−1 at Lmin = 0.77 mm) as shown in Fig. 13e. According to the Lmin of 0.77 mm, its corresponding κeng in the transient mode was 0.08, 0.15, and 9 W m−1 K−1 by eqn (17) at h = 50, 100, and 6000 W m−2 K−1, respectively (Fig. 13f).
range. This is mainly because of the absence of the Thomson heat as well as the assumption of the temperature independence of S, ρ and κ in the analytical model. This leads to an underrated κeng in a steady-state mode by the analytical model as 0.4 W m−1 K−1 at Lmin = 0.77 mm while the κeng evaluated by the numerical analysis is more conservative with a larger κeng (0.7 W m−1 K−1 at Lmin = 0.77 mm) as shown in Fig. 13e. According to the Lmin of 0.77 mm, its corresponding κeng in the transient mode was 0.08, 0.15, and 9 W m−1 K−1 by eqn (17) at h = 50, 100, and 6000 W m−2 K−1, respectively (Fig. 13f).
5.3.3.
κ
eng of Bi2Te3 materials.
The thermal conductivities of some of state-of-the-art, p-type Bi2Te3 materials have been reported as 0.5–1.7 W m−1 K−1 for ZT ∼ 1.8.31,37,96–98Fig. 14 shows the ![[small kappa, Greek, macron]](https://www.rsc.org/images/entities/i_char_e0cb.gif) for recent p-type Bi2Te3, and it is close to and/or below the κeng at steady state. This indicates that there is not much room for thermal conductivity reduction for ZT improvement. As discussed, the reduction of thermal conductivity may cause an immediate fracture of a material when it is below the transient κeng, and the failure of the interfacial structure or degradation of the output power occurs when the thermal conductivity is lower than the steady state κeng. Thus, the strategy of reducing thermal conductivity for ZT enhancement should be carefully addressed by considering the mechanical reliability issue.
for recent p-type Bi2Te3, and it is close to and/or below the κeng at steady state. This indicates that there is not much room for thermal conductivity reduction for ZT improvement. As discussed, the reduction of thermal conductivity may cause an immediate fracture of a material when it is below the transient κeng, and the failure of the interfacial structure or degradation of the output power occurs when the thermal conductivity is lower than the steady state κeng. Thus, the strategy of reducing thermal conductivity for ZT enhancement should be carefully addressed by considering the mechanical reliability issue.
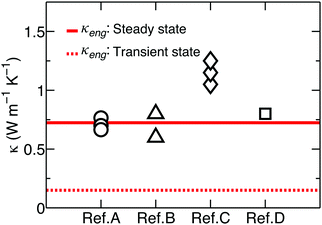 |
| | Fig. 14 The averaged thermal conductivities of the state-of-the-art, p-type Bi2Te3 compared with the κeng of the p-type Bi0.4Sb1.6Te3 for the steady state (solid line) and transient mode (dashed line). The measured property data of the reference materials are from ref. A,96 ref. B,97 ref. C,98 and ref. D.37 Reproduced from ref. 49 with permission from the Wiley-VCH. | |
In general, regarding the approach to maximize the efficiency of a thermoelectric generator by maximizing the material ZT, the strategy depends on the system environment, target applications, generator design, etc. Assuming that no forced cooling is applied on the cold side, reducing the thermal conductivity can be the first priority for the material tuning process with larger ΔT (broad operating temperature) needs for a thermoelectric generator. Once a reasonably broad thermal boundary condition can be achieved, one can further reduce the thermal conductivity for more efficient systems. If the output power generation is more of a concern than the system efficiency, it is better to increase the power factor. For example:
(a) by reducing the electric resistivity: if a target area is limited or the thermoelectric materials are lightweight, a larger number of thermoelectric legs can be imbedded into a generator system, i.e., a higher filling factor is required or allowed. Such a design demands a high aspect ratio for leg length to width to avoid mechanical failure by trading off an optimum ratio and thermomechanical reliability even though the length and width are interrelated. In this design, the total resistance of a system should be minimized by decreasing the material's electric resistivity while an open circuit voltage is proportional to the number of thermoelectric legs.
(b) by increasing the Seebeck coefficient: if there is no limit on a target area or heavy thermoelectric materials are selected, a lower filling factor is allowed. Because a fewer number of legs are imbedded, the design decreases the device resistance, but requires a larger open circuit voltage because of the lack of legs, so an increase in the Seebeck coefficient is better to maximize ZT for a higher system efficiency.
As discussed in this section, if the thermal conductivity is saturated or below the κeng like Bi2Te3, increasing the power factor is a better material tuning strategy since the power factor does not affect the thermomechanical reliability. Additionally, tuning the temperature dependence of material properties is another concern in maximizing ZT according to the CTD model.
5.4. Engineering thermal conductivity in practical design
So far, κeng is evaluated based on the ideal interface bonding with respect to the yield and/or bonding strength measured at room temperature. The yield strength of the solder material is generally temperature dependent. For example, the yield strength of Sn–Pb is reduced to 75% from room temperature to 130 °C,99 and Sn–Ag–Cu has a 67% reduction from room temperature to 160 °C.100 Such temperature dependent yield strength results in an increasing κeng in the steady-state mode since Lmin associated with a lower yield strength at higher temperatures becomes larger. Another important issue for the practical design is an actual interfacial structure. Usually, semiconducting thermoelectric materials cannot be directly bonded onto metal electrodes,63 so thin metallization layers are introduced. In addition, a diffusion barrier is often required at the interface of the high temperature side to avoid the unwanted chemical reaction that causes a high contact resistance101 and degrades the mechanical properties of the joint.102 For Bi2Te3 materials, the bonding strength of the interface varies from 10 to 30 MPa at room temperature depending on the Ni metallization methods, such as sputtering, electroplating, and hot pressing.101 The weak bonding strength requires a high aspect ratio (L ≫ w) of a leg, resulting in a larger κeng. A secondary phase formed by the chemical reaction between the leg and metal alloy exhibits different characteristics, which may also weaken the bonding strength. Barako et al. demonstrated cracking at the hot side interface of a Bi2Te3 based commercial module under a thermoelectric generator mode.103 This might be because the κeng associated with the module's bonding and/or yielding criteria is higher than the thermoelectric materials' thermal conductivity.
The device reliability of thermoelectric power generators depends on the yield or bonding strength of the interfacial structures as well as the thermal conductivity of the thermoelectric leg to ensure the mechanical stability and performance in a balanced way. Beyond the lower thermal conductivity of thermoelectric materials for higher efficiency and output power generation, the higher mechanical strength of interfacial structures and the study of mechanical characteristics in thermoelectric materials should be entailed. Besides the engineering thermal conductivity, the device reliability is also improved by the appropriate mechanical properties of each component. However, tuning the mechanical properties of a thermoelectric leg and/or interfacial structures without degrading the thermal and electrical properties is a challenge, and simultaneous achievement of a high bonding strength and low electric contact resistance at the metal/thermoelectric interface without deteriorating thermoelectric performance is key for balanced improvement of the reliability and output performance of a device.
6. Summary and outlook
We have reviewed the CTD model by examining the reliable prediction for the thermoelectric performance from material to device level and investigated direct thermoelectric indicators representing the efficiency and output power of a p–n pair module as well as homogeneous materials. Additionally, the methodology of how to balance between the material tuning strategy and device reliability through κeng was summarized. In the CTD model, (ZT)eng and (PF)eng are associated with the overall effect of thermoelectric materials on the temperature difference, and the corresponding efficiency prediction incorporates the corrected contribution of the Joule and Thomson heats. This efficiency formula is a generic expression applied without restrictions no matter whether the material properties are strongly temperature dependent or assumed to be temperature independent. Beyond the conventional ZT and PF, (ZT)eng and (PF)eng as direct performance indicators have the advantage that one can immediately expect the efficiency and output power density of a material at a given thermal boundary condition once (ZT)eng and (PF)eng are known, respectively, regardless of what the material system is and their temperature differences. In addition, the use of the efficiency vs. (ZT)eng and power density vs. (PF)eng relationships enables one to avoid misdirected thermoelectric material exploration. It is noted that reducing the thermal conductivity for ZT improvement should be carefully carried out for some thermoelectric materials as the thermal conductivity influences the device reliability. Based on the methodology, further reduction of the thermal conductivity of some materials without considering the mechanical characteristics of the interfacial structures in a module device would be a futile attempt, and it makes the device fragile.
For the last few decades, vast efforts have been devoted to developing new thermoelectric materials and improving the thermoelectric performance of the materials, but the research on design, fabrication, and demonstration of thermoelectric module devices is still in a relatively early stage compared to the material research. Such a gap in the technology between the material and device hinders the use of promising thermoelectric devices as primary power sources, especially in the intermediate and high temperature range. Beyond the performance improvement of thermoelectric materials, studies on the device point of view should be actively addressed to investigate the mechanical properties, electrode materials, thermal/electrical contact resistance, interface structures, and module packaging for a thermomechanically reliable and thermoelectrically high-performance design.
Acknowledgements
This work was partially supported by the U.S. Department of Energy under Contract No. DE-SC0010831 (It is not possible to indicate the exact parts since it is a perspective article.) and also partially by “Solid State Solar Thermal Energy Conversion Center (S3TEC)”, an Energy Frontier Research Center funded by the U.S. Department of Energy, Office of Science, Office of Basic Energy Science under award number DE-SC0001299 (It is not possible to indicate the exact parts since it is a perspective article).
References
- G. J. Snyder and E. S. Toberer, Nat. Mater., 2008, 7, 105–114 CrossRef CAS PubMed.
- M. Zebarjadi, K. Esfarjani, M. S. Dresselhaus, Z. F. Ren and G. Chen, Energy Environ. Sci., 2012, 5, 5147–5162 Search PubMed.
- L. E. Bell, Science, 2008, 321, 1457–1461 CrossRef CAS PubMed.
- D. Kraemer, B. Poudel, H.-P. Feng, J. C. Caylor, B. Yu, X. Yan, Y. Ma, X. Wang, D. Wang, A. Muto, K. McEnaney, M. Chiesa, Z. F. Ren and G. Chen, Nat. Mater., 2011, 10, 532–538 CrossRef CAS PubMed.
- L. L. Baranowski, G. J. Snyder and E. S. Toberer, Energy Environ. Sci., 2012, 5, 9055–9067 Search PubMed.
- K. M. Saqr, M. K. Mansour and M. N. Musa, Int. J. Automot. Techn., 2008, 9, 155–160 CrossRef.
- C. Yu and K. T. Chau, Energy Convers. Manage., 2009, 50, 1506–1512 CrossRef CAS.
- D. Crane, J. LaGrandeur, V. Jovovic and M. Ranalli, J. Electron. Mater., 2013, 42, 1582–1591 CrossRef CAS.
- X. Liang, X. Sun, G. Shu, K. Sun and X. Wang, Energy Convers. Manage., 2013, 66, 304–311 CrossRef.
- J. Fleming, W. Ng and S. Ghamaty, J. Aircraft, 2004, 41, 674–676 CrossRef.
- J. P. Thomas, M. A. Qidwai and J. C. Kellogg, J. Power Sources, 2006, 159, 1494–1509 CrossRef CAS.
- H. S. Kim, T. Itoh, T. Iida, M. Taya and K. Kikuchi, Mater. Sci. Eng., B, 2014, 183, 61–68 CrossRef CAS.
- M. T. Johansson and M. Soderstrom, Energy Efficiency, 2014, 7, 203–215 CrossRef.
- K. Yazawa and A. Shakouri, Scr. Mater., 2016, 111, 58–63 CrossRef CAS.
- S. J. Kim, J. H. We and B. J. Cho, Energy Environ. Sci., 2014, 7, 1959–1965 Search PubMed.
- G. D. Mahan, J. Appl. Phys., 1991, 70, 4551–4554 CrossRef CAS.
-
T. P. Hogan and T. Shih, Thermoelectrics Handbook: Macro to Nano, Taylor & Francis, 2005 Search PubMed.
- R. He, H. S. Kim, Y. C. Lan, D. Z. Wang, S. Chen and Z. F. Ren, RSC Adv., 2014, 4, 64711–64716 RSC.
- P. Ziolkowski, P. Poinas, J. Leszczynski, G. Karpinski and E. Mueller, J. Electron. Mater., 2010, 39, 1934–1943 CrossRef CAS.
- B. V. K. Reddy, M. Barry, J. Li and M. K. Chyu, Int. J. Therm. Sci., 2013, 67, 53–63 CrossRef.
- H. S. Kim, K. Kikuchi, T. Itoh, T. Iida and M. Taya, Mater. Sci. Eng., B, 2014, 185, 45–52 CrossRef CAS.
- E. Hazan, O. Ben Yehuda, N. Madar and Y. Gelbstein, Adv. Energy Mater., 2015, 5, 1500272 CrossRef.
- X. Hu, A. Yamamoto, M. Ohta and H. Nishiate, Rev. Sci. Instrum., 2015, 86, 045103 CrossRef PubMed.
- G. Skomedal, L. Holmgren, H. Middleton, I. S. Eremin, G. N. Isachenko, M. Jaegle, K. Tarantik, N. Vlachos, M. Manoli, T. Kyratsi, D. Berthebaud, N. Y. D. Truong and F. Gascoin, Energy Convers. Manage., 2016, 110, 13–21 CrossRef CAS.
- G. J. Snyder and T. Ursell, Phys. Rev. Lett., 2003, 91, 148301 CrossRef PubMed.
- H. S. Kim, W. S. Liu, G. Chen, C. W. Chu and Z. F. Ren, Proc. Natl. Acad. Sci. U. S. A., 2015, 112, 8205–8210 CrossRef CAS PubMed.
- H. S. Kim, W. Liu and Z. Ren, J. Appl. Phys., 2015, 118, 115103 CrossRef.
- J. E. Sunderland and N. T. Burak, Solid-State Electron., 1964, 7, 465–471 CrossRef.
- G. Min, D. M. Rowe and K. Kontostavlakis, J. Phys. D: Appl. Phys., 2004, 37, 1301–1304 CrossRef.
- E. J. Sandoz-Rosado, S. J. Weinstein and R. J. Stevens, Int. J. Therm. Sci., 2013, 66, 1–7 CrossRef.
- B. Poudel, Q. Hao, Y. Ma, Y. Lan, A. Minnich, B. Yu, X. Yan, D. Wang, A. Muto, D. Vashaee, X. Chen, J. Liu, M. S. Dresselhaus, G. Chen and Z. F. Ren, Science, 2008, 320, 634–638 CrossRef CAS PubMed.
- G. Joshi, H. Lee, Y. Lan, X. Wang, G. Zhu, D. Wang, R. W. Gould, D. C. Cuff, M. Y. Tang, M. S. Dresselhaus, G. Chen and Z. F. Ren, Nano Lett., 2008, 8, 4670–4674 CrossRef CAS PubMed.
- W. Liu, X. Yan, G. Chen and Z. F. Ren, Nano Energy, 2012, 1, 42–56 CrossRef CAS.
- X. Yan, G. Joshi, W. Liu, Y. Lan, H. Wang, S. Lee, J. W. Simonson, S. J. Poon, T. M. Tritt, G. Chen and Z. F. Ren, Nano Lett., 2011, 11, 556–560 CrossRef CAS PubMed.
- Q. Zhang, J. He, T. J. Zhu, S. N. Zhang, X. B. Zhao and T. M. Tritt, Appl. Phys. Lett., 2008, 93, 102109 CrossRef.
-
W. Liu, Z. Ren and G. Chen, in Thermoelectric Nanomaterials, eds. K. Koumoto and T. Mori, Springer Berlin Heidelberg, 2013, pp. 255-286 Search PubMed.
- S. I. Kim, K. H. Lee, H. A. Mun, H. S. Kim, S. W. Hwang, J. W. Roh, D. J. Yang, W. H. Shin, X. S. Li, Y. H. Lee, G. J. Snyder and S. W. Kim, Science, 2015, 348, 109–114 CrossRef CAS PubMed.
- K. Biswas, J. He, I. D. Blum, C.-I. Wu, T. P. Hogan, D. N. Seidman, V. P. Dravid and M. G. Kanatzidis, Nature, 2012, 489, 414–418 CrossRef CAS PubMed.
- H. Liu, X. Yuan, P. Lu, X. Shi, F. Xu, Y. He, Y. Tang, S. Bai, W. Zhang, L. Chen, Y. Lin, L. Shi, H. Lin, X. Gao, X. Zhang, H. Chi and C. Uher, Adv. Mater., 2013, 25, 6607–6612 CrossRef CAS PubMed.
- L.-D. Zhao, S.-H. Lo, Y. Zhang, H. Sun, G. Tan, C. Uher, C. Wolverton, V. P. Dravid and M. G. Kanatzidis, Nature, 2014, 508, 373–377 CrossRef CAS PubMed.
- H.-S. Choi, W.-S. Seo and D.-K. Choi, Electron. Mater. Lett., 2011, 7, 271–275 CrossRef CAS.
- D. Zhao, X. Li, L. He, W. Jiang and L. Chen, Intermetallics, 2009, 17, 136–141 CrossRef CAS.
-
Y. Hori, D. Kusano, T. Ito and K. Izumi, presented in part at the 18th International Conference on Thermoelectrics, Baltimore, MD, USA, 1999 Search PubMed.
- A. S. Al-Merbati, B. S. Yilbas and A. Z. Sahin, Appl. Therm. Eng., 2013, 50, 683–692 CrossRef.
- U. Erturun, K. Erermis and K. Mossi, Appl. Therm. Eng., 2014, 73, 126–139 CrossRef.
- T. Sakamoto, T. Iida, Y. Ohno, M. Ishikawa and Y. Kogo, J. Electron. Mater., 2014, 43, 1620–1629 CrossRef CAS.
- J.-L. Gao, Q.-G. Du, X.-D. Zhang and X.-Q. Jiang, J. Electron. Mater., 2011, 40, 884–888 CrossRef CAS.
- T. Clin, S. Turenne, D. Vasilevskiy and R. A. Masut, J. Electron. Mater., 2009, 38, 994–1001 CrossRef CAS.
- H. S. Kim, T. B. Wang, W. S. Liu and Z. F. Ren, Adv. Funct. Mater., 2016, 26, 3678–3686 CrossRef CAS.
- E. Altenkirck, Phys. Z., 1909, 10, 560–568 Search PubMed.
-
A. F. Ioffe, Semiconductor Thermoelements and Thermoelectric Cooling, Infosearch, London, 1957 Search PubMed.
- H. J. Goldsmid, A. R. Sheard and D. A. Wright, Br. J. Appl. Phys., 1958, 9, 365–370 CrossRef CAS.
- Y. Lan, A. J. Minnich, G. Chen and Z. F. Ren, Adv. Funct. Mater., 2010, 20, 357–376 CrossRef CAS.
- Q. Jie, H. Wang, W. Liu, H. Wang, G. Chen and Z. F. Ren, Phys. Chem. Chem. Phys., 2013, 15, 6809–6816 RSC.
- J. Shuai, H. S. Kim, Y. Lan, S. Chen, Y. Liu, H. Zhao, J. Sui and Z. F. Ren, Nano Energy, 2015, 11, 640–646 CrossRef CAS.
- K. F. Hsu, S. Loo, F. Guo, W. Chen, J. S. Dyck, C. Uher, T. Hogan, E. K. Polychroniadis and M. G. Kanatzidis, Science, 2004, 303, 818–821 CrossRef CAS PubMed.
- J.-S. Rhyee, K. H. Lee, S. M. Lee, E. Cho, S. Il Kim, E. Lee, Y. S. Kwon, J. H. Shim and G. Kotliar, Nature, 2009, 459, 965–968 CrossRef CAS PubMed.
- Q. Zhang, F. Cao, W. Liu, K. Lukas, B. Yu, S. Chen, C. Opeil, D. Broido, G. Chen and Z. F. Ren, J. Am. Chem. Soc., 2012, 134, 10031–10038 CrossRef CAS PubMed.
- M. Koirala, H. Zhao, M. Pokharel, S. Chen, T. Dahal, C. Opeil, G. Chen and Z. F. Ren, Appl. Phys. Lett., 2013, 102, 213111 CrossRef.
- S. D. Bhame, D. Pravarthana, W. Prellier and J. G. Noudem, Appl. Phys. Lett., 2013, 102, 211901 CrossRef.
- D. Kraemer, J. Sui, K. McEnaney, H. Zhao, Q. Jie, Z. F. Ren and G. Chen, Energy Environ. Sci., 2015, 8, 1299–1308 Search PubMed.
-
S. W. Angrist, Direct Energy Conversion, Allyn and Bacon, Boston, 1965 Search PubMed.
- W. Liu, Q. Jie, H. S. Kim and Z. F. Ren, Acta Mater., 2015, 87, 357–376 CrossRef CAS.
- H. J. Wu, L. D. Zhao, F. S. Zheng, D. Wu, Y. L. Pei, X. Tong, M. G. Kanatzidis and J. Q. He, Nat. Commun., 2014, 5, 4515 CAS.
- L.-D. Zhao, V. P. Dravid and M. G. Kanatzidis, Energy Environ. Sci., 2013, 7, 251–268 Search PubMed.
- A. A. Efremov and A. S. Pushkarsky, Energy Convers., 1971, 11, 101–104 CrossRef.
-
E. Müller, K. Zabrocki, C. Goupil, G. Snyder and W. Seifert, in CRC Handbook of Thermoelectrics: Thermoelectrics and Its Energy Harvesting, ed. D. M. Rowe, Taylor & Francis, 2012, ch. 12, vol. 1 Search PubMed.
- A. Muto, D. Kraemer, Q. Hao, Z. F. Ren and G. Chen, Rev. Sci. Instrum., 2009, 80, 093901 CrossRef CAS PubMed.
- H. Zhao, J. Sui, Z. Tang, Y. Lan, Q. Jie, D. Kraemer, K. McEnaney, A. Guloy, G. Chen and Z. F. Ren, Nano Energy, 2014, 7, 97–103 CrossRef CAS.
- J. Sui, J. Li, J. He, Y. L. Pei, D. Berardan and H. Wu, Energy Environ. Sci., 2013, 6, 2916–2920 Search PubMed.
- C. Fu, S. Bai, Y. Liu, Y. Tang, L. Chen, X. Zhao and T. Zhu, Nat. Commun., 2015, 6, 8144 CrossRef PubMed.
- P. Jood, R. J. Mehta, Y. Zhang, G. Peleckis, X. Wang, R. W. Siegel, T. Borca-Tasciuc, S. X. Dou and G. Ramanath, Nano Lett., 2011, 11, 4337–4342 CrossRef CAS PubMed.
- M. Zhou, J.-F. Li and T. Kita, J. Am. Chem. Soc., 2008, 130, 4527–4532 CrossRef CAS PubMed.
- X. W. Wang, H. Lee, Y. C. Lan, G. H. Zhu, G. Joshi, D. Z. Wang, J. Yang, A. J. Muto, M. Y. Tang, J. Klatsky, S. Song, M. S. Dresselhaus, G. Chen and Z. F. Ren, Appl. Phys. Lett., 2008, 93, 193121 CrossRef.
- E. S. Toberer, P. Rauwel, S. Gariel, J. Tafto and G. J. Snyder, J. Mater. Chem., 2010, 20, 9877–9885 RSC.
- Y. Saiga, B. Du, S. K. Deng, K. Kajisa and T. Takabatake, J. Alloys Compd., 2012, 537, 303–307 CrossRef CAS.
- W. Liu, H. S. Kim, Q. Jie, B. Lv, M. Yao, Z. Ren, C. P. Opeil, S. Wilson, C. W. Chu and Z. F. Ren, Proc. Natl. Acad. Sci. U. S. A., 2015, 112, 3269–3274 CrossRef CAS PubMed.
- Q. Zhang, E. K. Chere, K. McEnaney, M. Yao, F. Cao, Y. Ni, S. Chen, C. Opeil, G. Chen and Z. F. Ren, Adv. Energy Mater., 2015, 5, 1401977 CrossRef.
- X. Chen, L. Shi, J. Zhou and J. B. Goodenough, J. Alloys Compd., 2015, 641, 30–36 CrossRef CAS.
- X. Shi, J. Yang, J. R. Salvador, M. Chi, J. Y. Cho, H. Wang, S. Bai, J. Yang, W. Zhang and L. Chen, J. Am. Chem. Soc., 2011, 133, 7837–7846 CrossRef CAS PubMed.
- Y. Oto, T. Iida, T. Sakamoto, R. Miyahara, A. Natsui, K. Nishio, Y. Kogo, N. Hirayama and Y. Takanashi, Phys. Status Solidi C, 2013, 10, 1857–1861 CrossRef CAS.
- S. Chen, K. C. Lukas, W. Liu, C. P. Opeil, G. Chen and Z. Ren, Adv. Energy Mater., 2013, 3, 1210–1214 CrossRef CAS.
- E. Suhir, J. Appl. Mech., 1986, 53, 657–660 CrossRef.
- E. Suhir and A. Shakouri, J. Appl. Mech., 2012, 79, 061010 CrossRef.
- E. Suhir and A. Shakouri, J. Appl. Mech., 2013, 80, 021012 CrossRef.
- M. Barth and K. Boriboonsomsin, ACCESS Magazine, 2009, 35, 2–9 Search PubMed.
- S. S. Manson, N.A.C.A. Tech. Note, 1953, 2933 Search PubMed.
- W. D. Kingery, J. Am. Ceram. Soc., 1955, 38, 3–15 CrossRef.
- D. P. H. Hasselman, Ceramurgia Int, 1978, 4, 147–150 CrossRef.
- E. Brochen, J. Poetschke and C. G. Aneziris, Int. J. Appl. Ceram. Tec., 2014, 11, 371–383 CrossRef CAS.
-
T. Siewert, S. Liu, D. R. Smith and J. C. Madeni, Properties of Lead-free Solders NIST and Colorado School of Mines, 2002.
-
D. Vasilevskiy, F. Roy, E. Renaud, R. A. Masut and S. Turenne, presented in part at the Proc 25th Int. Conf. on Thermoelectrics, Vienna, Austria, August 6–10, 2006.
- W. Liu, K. C. Lukas, K. McEnaney, S. Lee, Q. Zhang, C. P. Opeil, G. Chen and Z. F. Ren, Energy Environ. Sci., 2013, 6, 552–560 Search PubMed.
- G. Subhash and G. Ravichandran, J. Mater. Sci., 1998, 33, 1933–1939 CrossRef CAS.
- J.-P. Fleurial, JOM, 2009, 61, 79–85 CrossRef CAS.
- S. Jimenez, J. G. Perez, T. M. Tritt, S. Zhu, J. L. Sosa-Sanchez, J. Martinez-Juarez and O. Lopez, Energy Convers. Manage., 2014, 87, 868–873 CrossRef CAS.
- P.-Y. Lee, J. Hao, T.-Y. Chao, J.-Y. Huang, H.-L. Hsieh and H.-C. Hsu, J. Electron. Mater., 2014, 43, 1718–1725 CrossRef CAS.
- L.-P. Hu, T.-J. Zhu, Y.-G. Wang, H.-H. Xie, Z.-J. Xu and X.-B. Zhao, NPG Asia Mater., 2014, 6, e88 CrossRef CAS.
- X. Q. Shi, W. Zhou, H. L. J. Pang and Z. P. Wang, J. Electron. Packag., 1999, 121, 179–185 CrossRef.
- P. T. Vianco, J. A. Rejent and J. J. Martin, JOM, 2003, 55, 50–55 CrossRef CAS.
- W. S. Liu, H. Wang, L. Wang, X. Wang, G. Joshi, G. Chen and Z. F. Ren, J. Mater. Chem. A, 2013, 1, 13093–13100 RSC.
- T. Y. Lin, C. N. Liao and A. T. Wu, J. Electron. Mater., 2011, 41, 153–158 CrossRef.
- M. T. Barako, W. Park, A. M. Marconnet, M. Asheghi and K. E. Goodson, J. Electron. Mater., 2013, 42, 372–381 CrossRef CAS.
|
| This journal is © The Royal Society of Chemistry 2017 |


 , and (2) by taking a Z value corresponding to the average temperature, ZTavg = Z(Tavg). The ZintTavg and ZTavgTavg are called the average ZTs. Fig. 1a shows the temperature-dependent ZT and average ZTs of the p-type Ni-doped MgAgSb,61 and their corresponding efficiencies from eqn (2) shown in Fig. 1b match with the numerical simulation because Z vs. T is not must different from a constant (Fig. 1c). The numerical simulations were carried out based on the finite difference method to account for the temperature dependence of S, ρ, and κ over a large temperature difference between the cold and hot sides.16,17 In Fig. 1d, however, the n-type In4Se3−x57 has larger variations in the average ZTs depending on how they were averaged because of the strong temperature dependence of Z (Fig. 1f), which results in different efficiency predictions (Fig. 1e). Even though the peak ZT of In4Se3−x is higher than that of the Ni-doped MgAgSb, the average ZTs and the predicted efficiency are much lower, which means that the peak ZT value is not the correct indicator of a material's efficiency. In addition, any average ZT cannot be a correct index because of the lack of consistency from the following reasons: (1) average ZTs vary based on the averaging technique (Fig. 1a and d), (2) ZTavg is estimated to be larger than Zint when the Z curve is in a convex upward shape (Fig. 1c) and vice versa (Fig. 1f), and (3) analytical prediction of some materials based on the average ZTs is far from the numerical analysis (Fig. 1e). For this reason, eqn (2) often misleads and gives rise to an impractically high efficiency prediction, and it is desirable to reliably predict the conversion efficiency of thermoelectric materials and module devices for a large temperature difference based on their temperature-dependent thermoelectric properties.


 , which is shown in Fig. 3b, and the positive values of τΔT lead to an increased efficiency compared to that without the Thomson effect. Therefore, it is closer to the efficiency predicted by the numerical analysis. The reasons for the relative difference between the CTD model and numerical model are the linearized expression of dT/dx, and the different types of temperature dependence, i.e., a cumulative (or overall) effect in the CTD model and an instantaneous effect in the numerical model.


 , where Tc is fixed at 50 °C for all materials. The efficiency ηn is calculated based on a finite difference analysis,16,17,49 which takes into account the temperature dependence of S, ρ, and κ as well as the Thomson effect. The p-type and n-type materials and their maximum operable temperatures are listed in Table 1. The scattered pattern in Fig. 6a shows that (ZT)avg is not a direct indicator of a material's maximum efficiency. For example, p-type Bi2Te3 has a 30% lower efficiency with a 40% higher (ZT)avg compared to BiCuSeO. Thus, (ZT)avg is not adequate to represent a material's overall performance. Instead of (ZT)avg, (ZT)eff gives rise to proper characteristics, which are
  .66Fig. 6b shows the efficiency corresponding to the (ZT)eff of the materials. The relationship of ηnvs. (ZT)eff still shows a scattered pattern, so (ZT)eff is also not effective for reliable prediction of a material's efficiency under operable temperature conditions. Fig. 6c plots the efficiencies of the materials according to their (ZT)eng. From the correlation between ηnvs. (ZT)eng, the conversion efficiency of a material can be recognized by evaluating (ZT)eng without efficiency calculations. For example, a (ZT)eng of 0.6 represents about a 10% conversion efficiency regardless of the type of material, which makes it reasonable to compare the performances of different materials. This relationship has the benefit of taking into account each accumulated property based on ΔT rather than Tavg.


![[P with combining macron]](https://www.rsc.org/images/entities/i_char_0050_0304.gif) F is the averaged power factor of a thermoelectric material.
F is the averaged power factor of a thermoelectric material.


![[small kappa, Greek, macron]](https://www.rsc.org/images/entities/i_char_e0cb.gif) . The horizontal line indicates Th,max. The solid and dashed curves indicate the numerical and analytical analyses, respectively, where
. The horizontal line indicates Th,max. The solid and dashed curves indicate the numerical and analytical analyses, respectively, where ![[small kappa, Greek, macron]](https://www.rsc.org/images/entities/i_char_e0cb.gif) 1 = 1.13 and
1 = 1.13 and ![[small kappa, Greek, macron]](https://www.rsc.org/images/entities/i_char_e0cb.gif) 2 = 2.13 W m−1 K−1. (d) The Lmax associated with
2 = 2.13 W m−1 K−1. (d) The Lmax associated with ![[small kappa, Greek, macron]](https://www.rsc.org/images/entities/i_char_e0cb.gif) at a given thermal boundary. (e) The κeng at a steady state with Lmin. (f) The κeng at a transient mode as a function of h. (A) h = 50 (forced convection by air), (B) h = 100 (natural convection by water), and (C) h = 6000 (forced convection by water) W m−2 K−1. Reproduced from ref. 49 with permission from the Wiley-VCH.
at a given thermal boundary. (e) The κeng at a steady state with Lmin. (f) The κeng at a transient mode as a function of h. (A) h = 50 (forced convection by air), (B) h = 100 (natural convection by water), and (C) h = 6000 (forced convection by water) W m−2 K−1. Reproduced from ref. 49 with permission from the Wiley-VCH.![[small kappa, Greek, macron]](https://www.rsc.org/images/entities/i_char_e0cb.gif) = 1.13 W m−1 K−1 to
= 1.13 W m−1 K−1 to ![[small kappa, Greek, macron]](https://www.rsc.org/images/entities/i_char_e0cb.gif) = 0.6 W m−1 K−1, Lmax becomes 0.68 mm and 0.95 mm by the numerical and analytical models, respectively, where qh is assumed to be 20 W cm−2, which is in a typical heat flux density range (up to 40 W cm−2) for most thermoelectric applications.95 The Lmax according to
= 0.6 W m−1 K−1, Lmax becomes 0.68 mm and 0.95 mm by the numerical and analytical models, respectively, where qh is assumed to be 20 W cm−2, which is in a typical heat flux density range (up to 40 W cm−2) for most thermoelectric applications.95 The Lmax according to ![[small kappa, Greek, macron]](https://www.rsc.org/images/entities/i_char_e0cb.gif) by the analytical model (eqn (13)) outweighs the Lmax by the numerical analysis over the whole
by the analytical model (eqn (13)) outweighs the Lmax by the numerical analysis over the whole ![[small kappa, Greek, macron]](https://www.rsc.org/images/entities/i_char_e0cb.gif) range. This is mainly because of the absence of the Thomson heat as well as the assumption of the temperature independence of S, ρ and κ in the analytical model. This leads to an underrated κeng in a steady-state mode by the analytical model as 0.4 W m−1 K−1 at Lmin = 0.77 mm while the κeng evaluated by the numerical analysis is more conservative with a larger κeng (0.7 W m−1 K−1 at Lmin = 0.77 mm) as shown in Fig. 13e. According to the Lmin of 0.77 mm, its corresponding κeng in the transient mode was 0.08, 0.15, and 9 W m−1 K−1 by eqn (17) at h = 50, 100, and 6000 W m−2 K−1, respectively (Fig. 13f).
range. This is mainly because of the absence of the Thomson heat as well as the assumption of the temperature independence of S, ρ and κ in the analytical model. This leads to an underrated κeng in a steady-state mode by the analytical model as 0.4 W m−1 K−1 at Lmin = 0.77 mm while the κeng evaluated by the numerical analysis is more conservative with a larger κeng (0.7 W m−1 K−1 at Lmin = 0.77 mm) as shown in Fig. 13e. According to the Lmin of 0.77 mm, its corresponding κeng in the transient mode was 0.08, 0.15, and 9 W m−1 K−1 by eqn (17) at h = 50, 100, and 6000 W m−2 K−1, respectively (Fig. 13f).
![[small kappa, Greek, macron]](https://www.rsc.org/images/entities/i_char_e0cb.gif) for recent p-type Bi2Te3, and it is close to and/or below the κeng at steady state. This indicates that there is not much room for thermal conductivity reduction for ZT improvement. As discussed, the reduction of thermal conductivity may cause an immediate fracture of a material when it is below the transient κeng, and the failure of the interfacial structure or degradation of the output power occurs when the thermal conductivity is lower than the steady state κeng. Thus, the strategy of reducing thermal conductivity for ZT enhancement should be carefully addressed by considering the mechanical reliability issue.
for recent p-type Bi2Te3, and it is close to and/or below the κeng at steady state. This indicates that there is not much room for thermal conductivity reduction for ZT improvement. As discussed, the reduction of thermal conductivity may cause an immediate fracture of a material when it is below the transient κeng, and the failure of the interfacial structure or degradation of the output power occurs when the thermal conductivity is lower than the steady state κeng. Thus, the strategy of reducing thermal conductivity for ZT enhancement should be carefully addressed by considering the mechanical reliability issue.


