 Open Access Article
Creative Commons Attribution 3.0 Unported Licence
Highly active Pd–Ni nanocatalysts supported on multicharged polymer matrix†
Elza D.
Sultanova
 ab,
Aida I.
Samigullina
 a,
Natalya V.
Nastapova
 a,
Irek R.
Nizameev
 ac,
Kirill V.
Kholin
 ad,
Vladimir I.
Morozov
 a,
Aidar T.
Gubaidullin
 a,
Vitaliy V.
Yanilkin
 a,
Marsil K.
Kadirov
a,
Albina Y.
Ziganshina
a,
Marsil K.
Kadirov
a,
Albina Y.
Ziganshina
 *ab and
Alexander I.
Konovalov
 ab
ab
aA. E. Arbuzov Institute of Organic and Physical Chemistry, Russian Academy of Sciences, Arbuzov str. 8, Kazan 420088, Russia. E-mail: az@iopc.ru
bA. M. Butlerov Institute of Chemistry, Kazan Federal University, Kremlevskaya str. 18, Kazan 420018, Russia
cKazan National Research Technical University, K. Marx str. 10, Kazan 420111, Russia
dKazan National Research Technological University, Karl Marx str .68, Kazan 420015, Russia
First published on 31st October 2017
Abstract
In this article, we report the synthesis of mono- and bimetallic Pd–Ni nanocomposites supported on a multicharged polymeric matrix for catalytic applications. The morphology and catalytic properties of the composites depend on the Pd–Ni ratio. In the Suzuki–Miyaura coupling reaction, the composite with an equal amount of palladium and nickel is the most active and the reaction occurs within six hours in water at room temperature.
Introduction
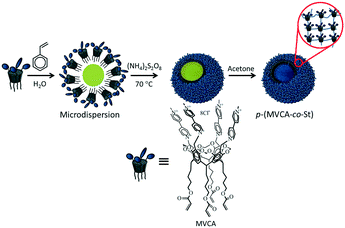
Metal nanoparticles (MNPs) have become extremely popular in the last few decades due to their unique properties particularly catalytic properties.1,2 Furthermore, MNPs based catalysts play an important role in the chemical and oil industry.3,4 Despite the great advances in recent years, the development of MNPs catalyst is still ongoing.5 The creation of innovative catalysts is necessary to solve energy and environmental problems.6,7 The requirements for successful catalysis include high productivity, catalytic activity at low temperatures and minimal use of noble metals.8,9 Thus, to meet these challenges, bimetallic and polymetallic nanocomposites reveal a number of possibilities.10,11 Polymetallic nanocomposites exhibit the properties of individual metals and additional properties resulting from the mutual influence between metals.12 The enhanced catalytic activity of bimetallic composites has been well demonstrated in recent studies.13,14 For example, platinum and palladium composites with nickel have been used in electrochemical oxidations15–18 and reduction reactions.19–22 Ni–Pd NPs immobilized on magnetic silica were applied in the hydrogenation of cyclohexene.23 Pd–Ni nanowires exhibit high catalytic activity for the hydrogenation of 4-nitrophenol24 and in the Suzuki–Miyaura coupling reaction.25–27Previously,28 we reported Pd NPs clusters on a spherical polymeric matrix (p(MVCA-co-St)). The matrix consisted of viologen-cavitands29,30 interconnected with alkyl chains.31 The synthesis of p(MVCA-co-St) is shown in Scheme 1. The surface of p(MVCA-co-St) is multicharged; therefore, it effectively stabilizes Pd NPs, organizing them into clusters. Due to its flexible structure, p(MVCA-co-St) shrinks and adapts to the Pd NPs clusters. The clusters Pdn-p(MVCA-co-St) exhibit high catalytic activity in reduction reactions and in the Suzuki–Miyaura reaction.28 The coupling reaction proceeds under mild conditions: in water at room temperature. Continuing this work, we developed bimetallic Pd–Ni and monometallic Ni composites using p(MVCA-co-St) as a supporting matrix. The insertion of nickel allows both a reduction in the amount of expensive palladium and change in the functional properties of the composites. Moreover,32,33 composites of various shapes and activity can be prepared by varying the ratio of the palladium and nickel precursors. Herein, we report the synthesis and catalytic activity of the PdnNim-p(MVCA-co-St) and Ni4-p(MVCA-co-St). In addition, the influence of the Pd–Ni ratio on the structure of the composites and their catalytic activity in the Suzuki–Miyaura coupling reaction are discussed.
Results and discussion
For the synthesis of PdnNim-p(MVCA-co-St), an aqueous solution of p(MVCA-co-St) was first mixed with sodium tetrachloropalladate (1![[thin space (1/6-em)]](https://www.rsc.org/images/entities/char_2009.gif) :
:![[thin space (1/6-em)]](https://www.rsc.org/images/entities/char_2009.gif) 3 equivalent to viologen-cavitands of p(MVCA-co-St)) for the complex formation between [PdCl4]2− and viologen-cavitands of p(MVCA-co-St). Then, nickel acetylacetonate (Ni(acac)2) was added to the solution, so that the total number of metal atoms in the final complex was 4, which is equal to the number of viologen-cavitands in p(MVCA-co-St). Subsequently, to carry out soft reduction of the palladium and nickel ions, ascorbic acid (AA) was added and the mixtures were kept at room temperature for 24 h. The color of the solutions changed from yellow to dark grey, indicating the MNPs formation. In the UV-vis spectra, the disappearance of the [PdCl4]2− and Ni(acac)2 bands at 410 and 300 nm, respectively, proves the complete reduction of metal ions (Fig. S1 in the ESI†). The composites were purified by dialysis three times to remove excess ascorbic acid and its oxidized forms.
3 equivalent to viologen-cavitands of p(MVCA-co-St)) for the complex formation between [PdCl4]2− and viologen-cavitands of p(MVCA-co-St). Then, nickel acetylacetonate (Ni(acac)2) was added to the solution, so that the total number of metal atoms in the final complex was 4, which is equal to the number of viologen-cavitands in p(MVCA-co-St). Subsequently, to carry out soft reduction of the palladium and nickel ions, ascorbic acid (AA) was added and the mixtures were kept at room temperature for 24 h. The color of the solutions changed from yellow to dark grey, indicating the MNPs formation. In the UV-vis spectra, the disappearance of the [PdCl4]2− and Ni(acac)2 bands at 410 and 300 nm, respectively, proves the complete reduction of metal ions (Fig. S1 in the ESI†). The composites were purified by dialysis three times to remove excess ascorbic acid and its oxidized forms.
The monometallic composite Ni4-p(MVCA-co-St) was prepared similarly but without the addition of [PdCl4]2−. Analogous to PdnNim-p(MVCA-co-St), its UV-vis spectrum does not display absorption bands of Ni(acac)2, which confirms its reduction (Fig. S1 in the ESI†).
The Pd and Ni content in the composites were determined via inductively coupled plasma atomic emission spectrometry (ICP-AES). For this, the purified colloids of the composites obtained from 2 mM solution of metal ions were diluted 70-fold and their line heights were measured. The experimentally observed Pd and Ni concentrations (spectral lines 340.458 nm and 231.604 nm, respectively) are summarized in Table S1 in the ESI.† The yield of Pd and Ni in the composites varies from 74% to 88%.
According to TEM examination, the morphology of the obtained composites depends on the ratio of Pd–Ni (Fig. 1). The composite with excess palladium, Pd3Ni1-p(MVCA-co-St), is similar to the previously described Pd4-p(MVCA-co-St).28 It consists of particles with an average diameter of about 5 nm organized in flower-like clusters of 68–75 nm in size (Fig. 1C). The Pd2Ni2-p(MVCA-co-St) cluster has a size of 40–50 nm and a homogeneous film is observed in its structure.
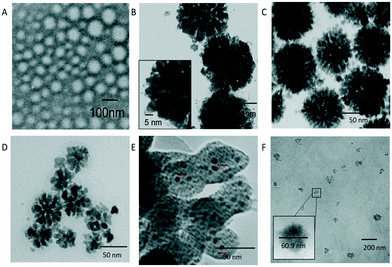 | ||
| Fig. 1 TEM images of (A) p(MVCA-co-St); (B) Pd4-p(MVCA-co-St) published in ref. 27; (C) Pd3Ni1-p(MVCA-co-St); (D) Pd2Ni2-p(MVCA-co-St); (E) Pd1Ni3-p(MVCA-co-St); (F) Ni4-p(MVCA-co-St). | ||
Pd1Ni3-p(MVCA-co-St) with excess nickel is composed of 5 nm isolated nanoparticles on a nanosized homogeneous surface. Ni4-p(MVCA-co-St) is present in the form of homogeneous cloudy spheres with an average size of about 65–70 nm (Fig. 1F). Thus, nanoparticles with size of 5 nm predominate in the structure of the composites with excess palladium. When the nickel content increases, the number of 5 nm nanoparticles decreases, while the amorphous component increases. Evidently, the palladate ions are reduced to elemental Pd NPs with a size of about 5 nm, while nickel forms an amorphous solid which covers the surface of p(MVCA-co-St).34–36 The energy dispersive X-ray analysis (EDX) for Ni4-p(MVCA-co-St) shows the Ni lines at Kα1 = 7.478 keV and Kα2 = 7.461 keV (Fig. S2 in the ESI†). For the bimetallic composites, along with the Ni signals, palladium lines at Lα1 = 2.84 keV, Lβ1 = 2.99 keV, Lβ3 = 3.07 keV, Lγ1 = 3.32 keV and Lγ3 = 3.56 keV are observed (Fig. S3–S6 in the ESI†). With an increase in the Pd content in the composites, the integrated intensity of the Pd lines increases, while the intensity of the Ni lines decreases. The EDX spectrum of Ni4-p(MVCA-co-St) does not exhibit any Pd lines.
Unfortunately, electron microscopy does not provide information on the amorphous or crystalline aggregate states, except that it is possible sometimes to visually observe a facet of the crystalline components. The aggregate state can be determined by X-ray diffraction (XRD) data.
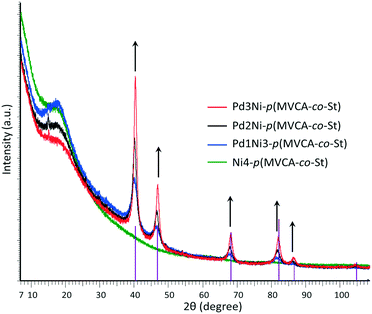
The XRD data is in agreement with the crystalline nature of palladium and the amorphousness of nickel (Fig. 2). As the palladium content increases, the intensity of the Pd diffraction peaks increases while the amorphousness of the samples decreases. The XRD spectrum of Ni4-p(MVCA-co-St) does not exhibit well-defined peaks in any region, which indicates its completely amorphous structure.
Cyclic voltammograms (CV) show that nickel and palladium in the monometallic composites are in the zero oxidation state. An irreversible peak associated with the Ni0 oxidation appears at Ep = +0.38 V in the CV of Ni4-p(MVCA-co-St) (Fig. 3). For Pd4-p(MVCA-co-St), the irreversible peak of the Pd0 oxidation is fixed at Ep = +0.75 V. However, the bimetallic composites PdnNim-p(MVCA-co-St) (where n, m = 1![[thin space (1/6-em)]](https://www.rsc.org/images/entities/char_2009.gif) :
:![[thin space (1/6-em)]](https://www.rsc.org/images/entities/char_2009.gif) 3) exhibit a broadened peak and the current increases in a wide range of potential from E = +0.30 to E = +0.90 V. The peak of the Pd0 oxidation is manifested at +0.75 V, whose height decreases with a decrease in the Pd content in the composites. The absence of a well-defined peak of metallic nickel could be caused by nickel oxidation and the significant mutual influence between palladium and nickel.15
3) exhibit a broadened peak and the current increases in a wide range of potential from E = +0.30 to E = +0.90 V. The peak of the Pd0 oxidation is manifested at +0.75 V, whose height decreases with a decrease in the Pd content in the composites. The absence of a well-defined peak of metallic nickel could be caused by nickel oxidation and the significant mutual influence between palladium and nickel.15
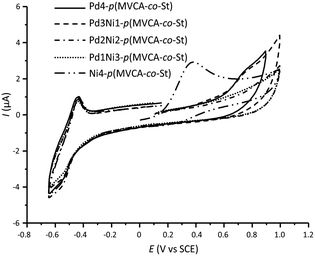 | ||
| Fig. 3 Cyclic voltammograms for Pd4-p(MVCA-co-St), PdnNim-p(MVCA-co-St) and Ni4-p(MVCA-co-St); C(p-MVCA-co-St) = 0.66 mg mL−1, H2O/0.1 M NaCl, ν = 100 mV s−1. | ||
In the cathodic region of the CVs, a pair of peaks for the reduction and re-oxidation of the viologen groups of p(MVCA-co-St) is observed. As discussed earlier,31 the free p(MVCA-co-St) is reduced in two steps with the formation of multi(cation-radical) and neutral species. However, in PdnNim-p(MVCA-co-St) the first reduction peak is not clearly expressed, whereas the background reduction occurs at the potential of the second reduction stage. This is apparently due to the reduction of water with hydrogen evolution at the catalytically active Pd and Ni NPs.
The EPR spectra of the composites manifest several signals (Fig. 4). For Ni4-p(MVCA-co-St), the signals at 500–1000 and 2000 G are attributed to ferromagnetic nickel. In the region around 3000 G, a signal for paramagnetic Ni+ appears. The bimetallic composites exhibit the Ni+ signal at 3000 G, while ferromagnetic nickel is not detected.37,38 All the bimetallic composites display a signal at 3400 G with g = 2.010, corresponding to a viologen cation radical of MVCA. Its intensity increases with the increase in Pd content (Fig. 4). In Ni4-p(MVCA-co-St), the viologen peak appears at 3445 G (g = 2.004). The narrowness of this signal indicates the exchange narrowing of the lines, which usually corresponds to an ordered intermolecular structure of viologen.39–41 From the obtained data, it can be assumed that Ni4-p(MVCA-co-St) consists of an amorphous Ni/Ni+ film coating p(MVCA-co-St). The bimetallic composites have a more complex structure. p(MVCA-co-St) is covered with amorphous oxidized nickel with nanoparticles of metallic palladium.
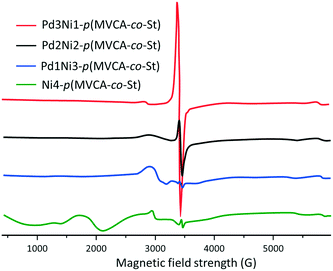 | ||
| Fig. 4 EPR spectra of Pd3Ni1-p(MVCA-co-St), Pd2Ni2-p(MVCA-co-St), Pd1Ni3-p(MVCA-co-St) and Ni4-p(MVCA-co-St), H2O, 20 °C. | ||
The mutual influence between Pd, Ni and viologen in the composites leads to a change in their electronic state, which affects their catalytic activity.15,22,42,43
Nowadays, Suzuki–Miyaura coupling is one of the most popular methods to obtain carbon–carbon bonds for producing biaryls. The reaction is catalyzed by metal complexes and is usually carried out in organic medium at high temperatures.44 In recent years, the number of publications on the application of metal nanoparticles has been increasing.25–27,45 Pd NPs are the most popular and effective, but they are highly expensive. In order to reduce high costs, Pd–Ni and Ni composites are being developed. In a previous article,44 the authors reported ligand stabilized Ni NPs, which catalyze the Suzuki–Miyaura reaction under mild conditions.46 It was reported that Pd–Ni nanoalloy catalysed the Suzuki–Miyaura reaction in water.25 Their results indicated that Pd–Ni alloys are more active than Pd.25 In the article,26 the authors employed Pd and Pd–Ni nanoparticles deposited on carbon nanotubes. The Suzuki reaction was carried out using 0.1 mol% Pd in water at 120 °C.26 The authors of publication27 reported the fabrication of Pd–Ni catalysts with a core–shell structure. The activity of the catalysts increases with the increase in the Ni percentage.27
The PdnNim-p(MVCA-co-St) and Ni4-p(MVCA-co-St) composites were applied as catalysts in the coupling between phenylboronic acid and iodobenzene. The results obtained indicated that, similar to Pd4-p(MVCA-co-St),28 the composites show good activity and the reaction proceeds under mild conditions: in water at room temperature (Table 1). Furthermore, the bimetallic composites exhibit better catalytic activity than the monometallic composites. The most active is Pd2Ni2-p(MVCA-co-St). In its presence, the coupling reaction occurs in six hours. An increase in the content of nickel or palladium in PdnNim-p(MVCA-co-St) leads to a decrease in the catalytic activity. The monometallic composite Ni4-p(MVCA-co-St) exhibits the lowest activity. Pd3Ni-p(MVCA-co-St) and Pd2Ni2-p(MVCA-co-St) display a structure with a flower-like shape, where Pd NPs are adsorbed on the Ni-containing amorphous surface. Apparently, this type of structure is the most preferred in catalysis.10,11,19
| Catalyst | Yield after 6 h, % | Yield after 20 h, % |
|---|---|---|
| a C(iodobenzene) = C(phenylboronic acid) = 5 mM, C(K2CO3) = 15 mM, C(M in PdnNim-p(MVCA-co-St)) = 0.05 mM, V = 15 mL, H2O, 25 °C. | ||
| Pd3Ni1-p(MVCA-co-St) | 82 | 100 |
| Pd2Ni2-p(MVCA-co-St) | 100 | 100 |
| Pd1Ni3-p(MVCA-co-St) | 33 | 34 |
| Ni4-p(MVCA-co-St) | — | 7 |
As the most effective catalyst, Pd2Ni2-p(MVCA-co-St) was applied in Suzuki–Miyaura reactions with a range of aryl halides. The coupling reaction was carried out under similar conditions using 1 mol% metals in Pd2Ni2-p(MVCA-co-St) (Table 2). Halogens attached directly to the benzene ring demonstrate low reactivity due to the conjugation of their electron pair with the benzene ring. Using the less active bromine, in place of iodine, results in a decrease in the reaction rate along with the decrease in yield to 89% (Table 2). Chlorobenzene almost does not react under these conditions. Electron-donating substituents in the benzene ring reduce the mobility of halogens as observed for 4-iodotoluene. The yield of 4-methylbiphenyl was only 74% after 13 h of reaction, while the reaction with iodobenzene completed after 6 h. In case of 4-chlorophenol, a hydroxyl group shows a positive mesomeric effect (+M) and a negative inductive effect (−I). The −I effect decreases the electron density in chlorine, thus chlorine becomes highly mobile and 4-chlorophenol is more reactive than chlorobenzene. In contrast, chlorophenol reacted with phenylboronic acid to provide 47% yield of 4-hydroxybiphenyl in 13 h.
Experimental
Pd and Ni were identified in the colloids simultaneously using inductively coupled plasma atomic emission spectrometry (ICP-AES) on an iCAP 6300 DUO by Varian Thermo Scientific Company equipped with a CID detector. This spectrometer enables the simultaneous measurement of peak heights. The optical resolution was less than 0.007 nm at a wavelength of 200 nm. The working frequency was 27.12 MHz. Collectively, the radial and axial view configurations enabled optimal peak height measurements with suppressed spectral noises. The concentration of Pd and Ni were determined from the spectral line height at 340.458 nm and 231.604 nm, respectively.Transmission electron microscopy (TEM) images were obtained with a Hitachi HT7700, Japan. The images were acquired at an accelerating voltage of 100 kV. Samples were deposited on 300 mesh copper grids with continuous carbon-Formvar support films.
TEM-EDX experiments were conducted on a Hitachi HT7700 transmission electron microscope with an energy-dispersive X-ray detector from Thermo Scientific.
X-ray powder diffraction (XRPD) measurements were performed on a Bruker D8 Advance diffractometer equipped with a Vario attachment and Vantec linear PSD using Cu radiation (40 kV, 40 mA) monochromated by a curved Johansson monochromator (λ CuKα1 1.5406 Å). Room-temperature data were collected in the reflection mode with a flat-plate sample. Samples were applied in liquid form on the surface of standard zero diffraction silicon plates. After drying the layer, a few more layers were applied on top of it to increase the total amount of sample. The sample was spun (15 rpm) throughout the data collection. Patterns were recorded in the 2θ range between 3° and 100° in 0.008° steps with a step time of 0.1–0.5 s. Several diffraction patterns in various experimental modes were collected for the samples. Processing of the obtained data was performed using the EVA47 and TOPAS48 software packages. The powder X-ray diffraction database PDF-2 (ICDD PDF-2, Release 2005–2009) was used to identify the crystalline phase.
Cyclic voltammograms were recorded using a potentiostat P-30S (without the IR-compensation) in an argon atmosphere at a potential scan rate of ν = 100 mV s−1 in 0.1 M NaCl/H2O at 295 K. A glassy carbon electrode (ð = 2 mm) embedded in Teflon was used as the working electrode. Before each measurement, the surface of the working electrode was mechanically polished. A platinum wire was used as the auxiliary electrode. Potentials were measured versus an aqueous saturated calomel electrode (SCE) connected to the solution through a bridge with the supporting electrolyte with the potential of −0.41 V relative to E0′(Fc+/Fc0).
EPR spectra were recorded with an Elexsys E500 spectrometer Bruker.
UV/vis experiments were recorded with a Perkin-Elmer Lambda 25 UV/vis spectrometer. NMR experiments were carried out with an Avance-600 (Bruker, Germany).
Sodium tetrachloropalladate(II) (approx. 36% Pd), nickel acetylacetonate (96%), sodium borohydride (98+%, powder) and ascorbic acid (99%) were purchased from Acros Organics and used without further purification. p(MVCA-co-St) was synthesized as described in an earlier report.31 Regenerated cellulose tubular dialysis membranes (MWCO: nominal: 1000) were acquired from Cellu·Sep. All solutions were prepared with deionized water treated in a Millipore water purification system (Millipore Corp.).
Synthesis of PdnNim-p(MVCA-co-St)
An aqueous solution of p(MVCA-co-St) (4 mg mL−1, 0.5 mL) was mixed with 0.3 mL of 3.33–10 mM Na2PdCl4. Then, 0.4 mL of 2.5–7.5 mM Ni(acac)2 was added, so that the total concentration of salt was 3.33 mM and the ratios of Pd![[thin space (1/6-em)]](https://www.rsc.org/images/entities/char_2009.gif) :
:![[thin space (1/6-em)]](https://www.rsc.org/images/entities/char_2009.gif) Ni were 3
Ni were 3![[thin space (1/6-em)]](https://www.rsc.org/images/entities/char_2009.gif) :
:![[thin space (1/6-em)]](https://www.rsc.org/images/entities/char_2009.gif) 1, 2
1, 2![[thin space (1/6-em)]](https://www.rsc.org/images/entities/char_2009.gif) :
:![[thin space (1/6-em)]](https://www.rsc.org/images/entities/char_2009.gif) 2, and 1
2, and 1![[thin space (1/6-em)]](https://www.rsc.org/images/entities/char_2009.gif) :
:![[thin space (1/6-em)]](https://www.rsc.org/images/entities/char_2009.gif) 3. After 1 min, 0.8 mL of 25 mM ascorbic acid was added. The mixture was kept at room temperature for 24 h. The reduction of Pd and Ni was monitored by observing the disappearance of the absorption band at 410 and 300 nm, respectively, in the UV/vis spectra. Then, the final colloidal solution was dialyzed (2 mL versus 3 × 800 mL water).
3. After 1 min, 0.8 mL of 25 mM ascorbic acid was added. The mixture was kept at room temperature for 24 h. The reduction of Pd and Ni was monitored by observing the disappearance of the absorption band at 410 and 300 nm, respectively, in the UV/vis spectra. Then, the final colloidal solution was dialyzed (2 mL versus 3 × 800 mL water).
Synthesis of Ni4-p(MVCA-co-St)
An aqueous solution of p(MVCA-co-St) (4 mg mL−1, 0.5 mL) was mixed with a solution of Ni(acac)2 (5.33 mM, 0.75 mL). After 1 min, ascorbic acid (26 mM, 0.75 mL) was added. The mixture was kept at room temperature for 24 h. The final colloidal solution was dialyzed for 3 h (2 mL versus 3 × 800 ml water).Suzuki–Miyaura coupling reaction
To an aqueous dispersion (10 mL) containing 7.5 mM aryl halide, 7.5 mM phenylboronic acid and 22.5 mM K2CO3, 0.75 mL of colloidal solution of PdnNim-p(MVCA-co-St) (C(M) = 2 mM) was added. The volume of the mixture was adjusted to 15 mL and the mixture was stirred at room temperature. Aliquots of the solution were taken after 6, 13 and 20 h for determination of the products. The products were extracted with hexane and then with ethyl acetate. The organic solutions were combined, washed with water and dried with MgSO4. Then, the solvents were removed to obtain the product. The structure of products was determined by 1H NMR spectroscopy.Conclusions
We have described the synthesis of monometallic Ni and bimetallic Pd–Ni composites with different sizes and structures stabilized on a flexible multicharged matrix. The monometallic composite Ni4-p(MVCA-co-St) consists of amorphous nickel covering the surface of p(MVCA-co-St). The morphology of the bimetallic composites PdnNim-p(MVCA-co-St) depends on the ratio of Pd-Ni, which varies from flower-like clusters to separated particles on the amorphous surface. The Pd2Ni2-p(MVCA-co-St) composite with an equivalent amount of palladium and nickel exhibits the best catalytic activity in the Suzuki–Miyaura coupling reaction, which proceeds in water at room temperature for 6 h.Conflicts of interest
There are no conflicts to declare.Acknowledgements
This study was supported by the Russian Foundation for Basic Research (Grant No. 15-03-04999) and by the subsidy allocated to Kazan Federal University for the state assignment in the sphere of scientific activities.Elza Sultanova thanks the Haldor Topsøe A/S for PhD scholarship.
We are grateful to the “SMTA” laboratory of Kazan National Research Technological University for access to microscopic and spectroscopic equipment.
Notes and references
- Metal Nanoclusters in Catalysis and Materials Science: The Issue of Size Control, ed. B. Corain, G. Schmid and N. Toshima, Elsevier, Amsterdam, 2008 Search PubMed.
- C. Burda, X. Chen, R. Narayanan and M. A. El-Sayed, Chem. Rev., 2005, 105, 1025–1102 CrossRef CAS PubMed.
- O. G. Ellert, M. V. Tsodikov, S. A. Nikolaev and V. M. Novotortsev, Russ. Chem. Rev., 2014, 83, 718–732 CrossRef.
- J. M. Thomas and W. J. Thomas, Principles and Practice of Heterogeneous Catalysis, Wiley, Weinheim, 1997 Search PubMed.
- F. Zaera, Catal. Lett., 2012, 142, 501–516 CrossRef CAS.
- J. Cookson, Platinum Met. Rev., 2012, 56, 83–98 CrossRef.
- C. Sanchez, P. Belleville, M. Popall and L. Nicole, Chem. Soc. Rev., 2011, 40, 696–753 RSC.
- G. A. Somorjai and J. Y. Park, Top. Catal., 2008, 49, 126–135 CrossRef CAS.
- G. Centi and S. Perathoner, Coord. Chem. Rev., 2011, 255, 1480–1498 CrossRef CAS.
- J. Gu, Y.-W. Zhang and F. Tao, Chem. Soc. Rev., 2012, 41, 8050–8065 RSC.
- B. T. Sneed, A. P. Young and C. K. Tsung, Nanoscale, 2015, 7, 12248–12265 RSC.
- J. A. Rodriguez and D. W. Goodman, Science, 1992, 257, 897–903 CAS.
- H.-L. Jiang and Q. Xu, J. Mater. Chem., 2011, 21, 13705–13725 RSC.
- J. Shi, Chem. Rev., 2013, 113, 2139–2181 CrossRef CAS PubMed.
- B. T. Sneed, A. P. Young, D. Jalalpoor, M. C. Golden, S. Mao, Y. Jiang, Y. Wang and C. K. Tsung, ACS Nano, 2014, 8, 7239–7250 CrossRef CAS PubMed.
- S. Y. Shen, T. S. Zhao, J. B. Xu and Y. S. Li, J. Power Sources, 2010, 195, 1001–1006 CrossRef CAS.
- Y. Hu, P. Wu, H. Zhang and C. X. Cai, Electrochim. Acta, 2012, 85, 314–321 CrossRef CAS.
- P. S. Roy, J. Bagchi and S. K. Bhattacharya, Catal. Sci. Technol., 2012, 2, 2302–2310 CAS.
- C. H. Cui, L. Gan, M. Heggen, S. Rudi and P. Strasser, Nat. Mater., 2013, 12, 765–771 CrossRef CAS PubMed.
- S.-I. Choi, S. Xie, M. Shao, J. H. Odell, N. Lu, H.-C. Peng, L. Protsailo, S. Guerrero, J. Park, X. Xia, J. Wang, M. J. Kim and Y. Xia, Nano Lett., 2013, 13, 3420–3425 CrossRef CAS PubMed.
- M. Wang, W. M. Zhang, J. Z. Wang, D. Wexler, S. D. Poynton, R. C. T. Slade, H. K. Liu, B. Winther-Jensen, R. Kerr, D. Q. Shi and J. Chen, ACS Appl. Mater. Interfaces, 2013, 5, 12708–12715 CAS.
- K. A. Kuttiyiel, K. Sasaki, D. Su, M. B. Vukmirovic, N. S. Marinkovic and R. R. Adzic, Electrochim. Acta, 2013, 110, 267–272 CrossRef CAS.
- N. J. S. Costa, M. Guerrero, V. Collière, É. Teixeira-Neto, R. Landers, K. Philippot and L. M. Rossi, ACS Catal., 2014, 4, 1735–1742 CrossRef CAS.
- Y. Imura, K. Tsujimoto, C. Morita and T. Kawai, Langmuir, 2014, 30, 5026–5030 CrossRef CAS PubMed.
- Y. Wu, D. Wang, P. Zhao, Z. Niu, Q. Peng and Y. Li, Inorg. Chem., 2011, 50, 2046–2048 CrossRef CAS PubMed.
- A. Ohtaka, J. M. Sansano, C. Nájera, I. Miguel-García, Á. Berenguer-Murcia and D. Cazorla-Amorós, ChemCatChem, 2015, 7, 1841–1847 CrossRef CAS.
- J. Xiang, P. Li, H. Chong, L. Feng, F. Fu, Z. Wang, S. Zhang and M. Zhu, Nano Res., 2014, 7, 1337–1343 CrossRef CAS.
- E. D. Sultanova, V. V. Salnikov, R. K. Mukhitova, Y. F. Zuev, Y. N. Osin, L. Ya. Zakharova, A. Y. Ziganshina and A. I. Konovalov, Chem. Commun., 2015, 51, 13317–13320 RSC.
- A. Y. Ziganshina, S. V. Kharlamov, E. Kh. Kazakova, Sh. K. Latypov and A. I. Konovalov, Mendeleev Commun., 2007, 17, 145–147 CrossRef CAS.
- V. V. Yanilkin, G. R. Nasybullina, A. Y. Ziganshina, I. R. Nizamiev, M. K. Kadirov, D. E. Korshin and A. I. Konovalov, Mendeleev Commun., 2014, 24, 108–110 CrossRef CAS.
- E. D. Sultanova, E. G. Krasnova, S. V. Kharlamov, G. R. Nasybullina, V. V. Yanilkin, I. R. Nizameev, M. K. Kadirov, R. K. Mukhitova, L. Y. Zakharova, A. Y. Ziganshina and A. I. Konovalov, ChemPlusChem, 2015, 80, 217–222 CrossRef CAS.
- S. Cheong, J. D. Watt and R. D. Tilley, Nanoscale, 2010, 2, 2045–2053 RSC.
- C. Kim, C. Kim, K. Lee and H. Lee, Chem. Commun., 2014, 50, 6353–6356 RSC.
- Kh. V. Manukyan, Ch. E. Shuck, M. J. Cherukara, S. Rouvimov, D. Y. Kovalev, A. Strachan and A. S. Mukasyan, J. Phys. Chem. C, 2016, 120, 5827–5838 CAS.
- Y. He, M. Qiao, H. Hu, Y. Pei, H. Li, J. Deng and K. Fan, Mater. Lett., 2002, 56, 952–957 CrossRef CAS.
- W. Zhang, Y. Tan, Y. Gao, J. Wu, B. Tang and J. Zhao, RSC Adv., 2014, 4, 27800–27804 RSC.
- H. Shim, P. Dutta, M. S. Seehra and J. Bonevich, Solid State Commun., 2008, 145, 192–196 CrossRef CAS.
- N. Nunomura, H. Hori, T. Teranishi, M. Miyake and S. Yamada, Phys. Lett. A, 1998, 249, 524–530 CrossRef CAS.
- G. Das, T. Prakasam, S. Nuryyeva, D. S. Han, A. Abdel-Wahab, J.-C. Olsen, K. Polychronopoulou, C. Platas-Iglesias, F. Ravaux, M. Jouiad and A. Trabolsi, J. Mater. Chem. A, 2016, 4, 15361–15369 CAS.
- C. Hua, B. Chan, A. Rawal, F. Tuna, D. Collison, J. M. Hook and D. M. D'Alessandro, J. Mater. Chem. C, 2016, 4, 2535–2544 RSC.
- M. Kuroboshi, T. Shiba and H. Tanaka, Tetrahedron Lett., 2013, 54, 3666–3668 CrossRef CAS.
- C. Y. He, X. L. Wu and Z. Q. He, J. Phys. Chem. C, 2014, 118, 4578–4584 CAS.
- R. D. Smith, M. S. Prévot, R. D. Fagan, S. Trudel and C. P. Berlinguette, J. Am. Chem. Soc., 2013, 135, 11580–11586 CrossRef CAS PubMed.
- N. Miyaura and A. Suzuki, Chem. Rev., 1995, 95, 2457–2483 CrossRef CAS.
- I. Maluenda and O. Navarro, Molecules, 2015, 20, 7528–7557 CrossRef CAS PubMed.
- S. Handa, E. D. Slack and B. H. Lipshutz, Angew. Chem., Int. Ed., 2015, 54, 11994–11998 CrossRef CAS PubMed.
- DIFFRAC Plus Evaluation package EVA, Version 11, User's Manual, Bruker AXS, Karlsruhe, Germany, 2005 Search PubMed.
- 47 TOPAS V3: General profile and structure analysis software for powder diffraction data, Technical Reference, Bruker AXS, Karlsruhe, Germany, 2005 Search PubMed.
Footnote |
| † Electronic supplementary information (ESI) available. See DOI: 10.1039/c7cy01797a |
| This journal is © The Royal Society of Chemistry 2017 |

