High-pressure glass formation of a series of 1-alkyl-3-methylimidazolium bis(trifluoromethanesulfonyl)imide homologues
Yukihiro
Yoshimura
 *a,
Takahiro
Takekiyo
a,
Yoshihiro
Koyama
b,
Mayumi
Takaku
c,
Misaho
Yamamura
c,
Natsumi
Kikuchi
c,
Daisuke
Wakabayashi
d,
Nobumasa
Funamori
d,
Kiyoto
Matsuishi
b,
Hiroshi
Abe
 e and
Nozomu
Hamaya
c
aDepartment of Applied Chemistry, National Defense Academy, 1-10-20, Hashirimizu, Yokosuka, Kanagawa 239-8686, Japan. E-mail: muki@nda.ac.jp
bGraduate School of Pure and Applied Science, University of Tsukuba, Ibaraki 305-8537, Japan
cGraduate School of Humanities and Sciences, Ochanomizu University, Tokyo 112-8610, Japan
dInstitute of Materials Structure Science, High Energy Accelerator Research Organization (KEK), Tsukuba 305-0801, Japan
eDepartment of Materials Science and Engineering, National Defense Academy, 1-10-20, Hashirimizu, Yokosuka, Kanagawa 239-8686, Japan
First published on 23rd November 2017
Abstract
We investigated the stability of the liquid phase of a series of 1-alkyl-3-methylimidazolium bis(trifluoromethanesulfonyl)imide ([Cnmim][TFSI]) homologues with different alkyl chain lengths for 3 ≤ n ≤ 10 at room temperature. We found that all [Cnmim][TFSI] samples (n = 3–10) formed a glassy state when pressure was applied. Intriguingly, the glass transition pressure (pg) slightly increases up to n = 5, reaches a plateau at n ≧ 8, and increases again at n = 10. This is completely different from the high-pressure glass formation of [Cnmim][BF4], where the pg decreases as n increases. We discussed the local structural changes occurring in [Cnmim][TFSI] in view of the conformational changes of the cation and anion, and small-angle X-ray scattering data. It seems that [Cnmim][TFSI] is resistant to external pressure and retains its local liquid structure by conformational adjustments of the cation and anion.
Introduction
Recently, there has been growing interest in the phase transition behavior of room-temperature ionic liquids (ILs) at high pressure,1–8 especially with respect to glass formation, in which the main governing interactions are the interplay between Coulomb forces and van der Waals interactions among constituent ions.9,10In a previous study,11 we reported the phase transition behavior of typical ILs, a series of 1-alkyl-3-methylimidazolium tetrafluoroborate (hereafter abbreviated as [Cnmim][BF4]) homologues with different alkyl chain lengths (2 ≤ n ≤ 8) at 298 K. We showed that [Cnmim][BF4] exhibited superpressurization to form a glassy state at around 2–3 GPa upon compression. As n increases, the glass transition pressure (pg) decreases as might be expected. The results indicate that the p–T range of the liquid phase is regulated by the alkyl chain length of [Cnmim][BF4] homologues. Subsequently, we proposed that the flexibility of the alkyl chain of the cations (conformational adjustment) plays an important role in avoiding crystallization, leading to high-pressure glass formation.12
The mechanism by which pressure affects the phase behavior of ILs is thus worthy of investigation. Alternatively, studies of ILs at high pressure would contribute to a basic understanding of these compounds that would allow their use under stressed conditions, e.g., tribological applications.13–15 Moreover, this information might be useful with respect to recycling and purification using high-pressure crystallization in future applications.16,17
Bis(trifluoromethanesulfonyl)imide, usually abbreviated as TFSI, is also one of the most popular anions in ILs because of its attractive properties, which result in low melting point salts, relatively low viscosity, and high electrical conductivity18,19 when combined with common organic cations. Apart from the BF4 anion, it is noted that the TFSI anion has C1 (cisoid) and C2 (transoid) conformers.20,21 A schematic representation of the Cnmim cation and TFSI anion is shown in Fig. 1. Therefore, there might be competition among the different types of interactions in [Cnmim][TFSI], which probably determines its phase transitions and affects its behavior. Indeed, the molecular configurations of anions and cations are key to understanding the dependence of the macroscopic properties of the ILs on their ionic composition and therefore to tailoring them to a particular application. The structure–function link in ILs is, however, sometimes counterintuitive, and predicting the phase behavior is often difficult.
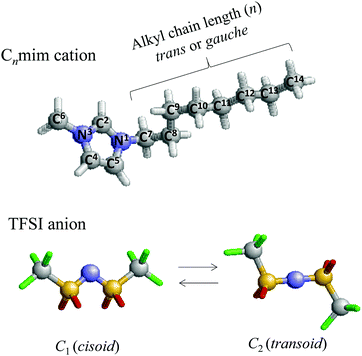 | ||
| Fig. 1 A schematic representation of the structure of 1-alkyl-3-methylimidazolium bis(trifluoromethanesulfonyl)imide ([Cnmim][TFSI]). | ||
Motivated by this background, and especially as a counterpart to the [Cnmim][BF4] homologues, in this study we investigated the phase behavior of [Cnmim][TFSI] as a function of alkyl chain length (n = 3–10) under high pressure at room temperature (298 K). We then compared the results for two typical ILs, i.e., [Cnmim][TFSI] and [Cnmim][BF4], where the TFSI anion has a conformational equilibrium.
Experimental
The [Cnmim][TFSI] used in this study had n values ranging from 3 to 10 (Kanto Chemical Co. for n = 4; Ionic Liquids Technologies Inc. for n = 3, 5–10).Raman spectra were typically measured using a JASCO NRS-5100 Raman spectrophotometer equipped with a single monochromator and a Peltier cooled device. The spectra were excited at 532 nm with a green laser having a power of 5.8 mW. The Gaussian–Lorentzian mixed function was used to analyze the observed Raman spectra using GRAMS/386 software (Galactic Industries Corp.). The pressure-loading device was a screw-type diamond anvil cell (DAC, SR-DAC-KYO3-3d, Kyowa) with 0.6 mm culet anvils. We used a T301 stainless steel gasket with a 0.3 mm hole. The sample was normally compressed to ∼3 GPa in steps of approximately 1 GPa h−1, including the duration time.
For [Cnmim][TFSI] (n = 8–10), synchrotron radiation (SR) small-angle X-ray scattering (SAXS) measurements were performed. A sample was encapsulated into a hole of 0.3 mm diameter drilled in the T301 gasket and loaded on a modified Mao-Bell-type DAC with 0.6 mm culet anvils. The samples were compressed at a rate of ∼0.5 GPa h−1. The measurements were carried out at beamline BL18C in Photon Factory, KEK, Tsukuba. Incident X-rays at wavelengths of 0.08014 nm for n = 8 and 10 and 0.08293 nm for n = 9 were focused and collimated by the shaping and additional collimators with a hole of 35 and 130 μm in diameter. An imaging plate, used as a detector, was placed at a distance of 1285 mm from the sample in a vacuum chamber with a polyimide film window. The acquisition time for each scattering pattern was typically 1800 s. The intensity of the incident X-rays was continuously monitored with a photodiode and used to normalize measured scattering intensities. Background scattering and the diffraction around 4 nm−1 from a polyimide film for an X-ray window were then subtracted from measured scattering patterns.
The pressure was determined from the spectral shift of the R1 fluorescence line of several ruby balls (0.015 mm diameter) placed in the sample chamber of the DAC.22 The error of the estimated pressure was ±0.05 GPa. The sample was prepared in a glovebox filled with argon gas to avoid contamination by water in air. All the Raman and SR-SAXS measurements were performed at room temperature (298 K).
Results and discussion
Firstly, as a typical example of Raman spectral changes, Raman spectra of the C–H stretching vibrational modes (νCH) of the imidazolium cation in [Cnmim][TFSI] (n = 3, 5, 8) are shown as a function of pressure in Fig. 2. These modes are commonly used as an indicator of crystallization. We found that as the pressure increases, the spectral resolution of each peak at 0.1 MPa in the νCH band becomes less clear and the spectra show a different feature from that at 0.1 MPa accompanied by a higher frequency shift. Unfortunately, the spectra present difficulties with respect to quantitative interpretation due to the broad spectral features at high pressure. Visual observations at elevated pressures showed that the sample remained transparent within the studied range of pressures.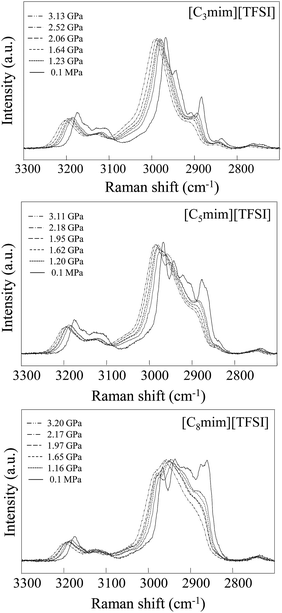 | ||
| Fig. 2 Typical example of pressure-induced Raman CH stretching spectral changes in [Cnmim][TFSI] (n = 3, 5, and 8) as a function of pressure. | ||
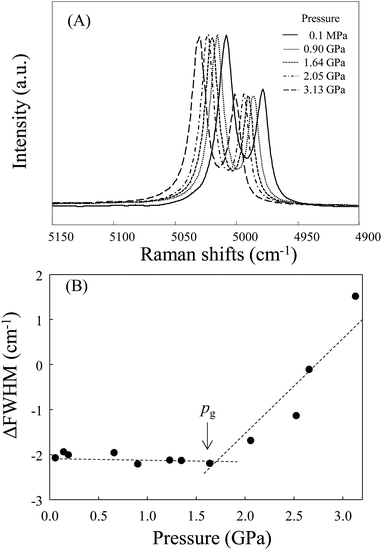
As with previous studies,3,11 we used the line broadening method with the sharp ruby R1 fluorescence line to distinguish high-pressure vitrification from crystallization. As an example of the results, we show the spectral change in the ruby R1 line of [C3mim][TFSI] in Fig. 3(A). Fig. 3(B) shows the variations in the full width at half-maximum (FWHM) of the ruby R1 line relative to the 0.1 MPa line for [C3mim][TFSI] during the compression process. The pressure at which the line broadening begins is defined as the glass transition pressure pg.23 We can see that the ΔFWHM drastically increases with pressure above the initiation point, pg. We found that the [Cnmim][TFSI] homologues for n = 3–10 were superpressed into a metastable (glassy) state.
The observed pg values are plotted in Fig. 4, including their experimental uncertainties based on several runs. Data on pgs for [C4mim][TFSI] and [C6mim][TFSI] were presented by Ribeiro et al.24 (pg = 1.6 GPa for n = 4 and pg = 1.7 GPa for n = 6) and Wu et al.25 (pg = 1.8 GPa for n = 4). We suspect that the slight differences between the values given by these authors and those found in the present studies are due to differences in experimental conditions, such as the compression rate and the measurements of the apparatus used (such as gasket and diamond culet sizes). Notably, as the alkyl chain length increases, pg shifts to slightly higher pressures up to n = ∼5 and then exhibits almost a plateau region up to n = 8. However, we found that the pgs for n = 9 and 10 increase again.
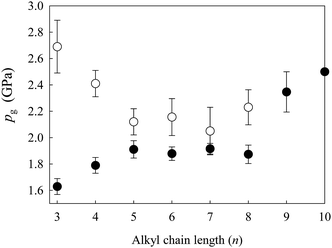 | ||
| Fig. 4 Changes in the glass transition pressure pg (●) for [Cnmim][TFSI] and pg (○) for [Cnmim][BF4]11 as a function of alkyl chain length (n). | ||
It should now be interesting to compare the present results with those for [Cnmim][BF4]. These comparisons are made in Fig. 4. Intriguingly, the results are completely different from those for [Cnmim][BF4], where pg shifts to lower pressures as the alkyl chain length increases. We wonder whether the different phase diagrams of the two typical ILs are the result of competition among the anion–cation and intermolecular interactions. As mentioned in the Introduction, the TFSI anion is a flexible molecule that can adopt two energetically different conformations, the C1 and C2 forms, whose concentrations in the liquid and/or solid phases affect the physical properties of the ILs.26 At normal pressure, the C2 conformer is slightly more stable than the C1 conformer with an energy difference of only 3.5 kJ mol−1,20 and both conformers are present in the liquid state.27,28 The alkyl chain plays an important role in determining the morphology of ILs, but it seems that the TFSI anion also contributes significantly to the structure of [Cnmim][TFSI]. Thus, there must be complex interactions in [Cnmim][TFSI] originating from the cationic and anionic conformations.
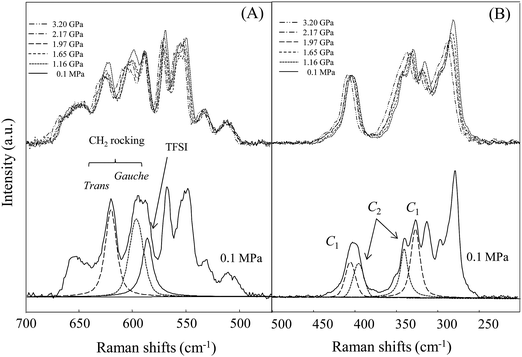
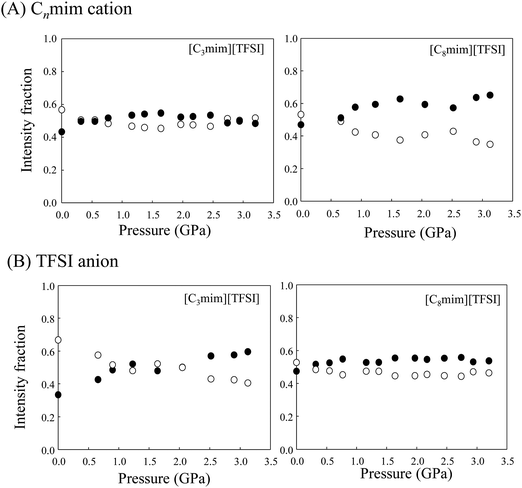
We then consider local structural changes at high pressure, especially conformational changes in the Cnmim cation and TFSI anion. As mentioned in the Introduction, the Cnmim cation exhibits conformational equilibria between the trans and gauche conformers of the main long alkyl chain. As shown in Fig. 5(A), the ∼625 and ∼600 cm−1 peaks for the CH2 rocking modes of the trans and gauche conformers are usually used for the analysis.29,30 Unfortunately, at n = 9 and 10, strong fluorescence emerging in the observed spectra at high pressures prevents precise local conformational analysis. The intensity fractions (f) of gauche and trans conformers were determined by curve fitting spectra of the CH2 rocking mode. The results for [C3mim][TFSI] and [C8mim][TFSI] are shown in Fig. 6(A). Fig. 6(A) shows that both cations favor the trans conformer in the liquid state under normal pressure, but the population of gauche conformers increases upon compression. It should be noted that the change in [C3mim][TFSI] against pressure is small and the populations for both conformers tend to equalize at higher pressures compared to [C8mim][TFSI]. These results imply greater dynamic heterogeneity for main chains with longer alkyl chain segments.
On the other hand, Fig. 5(B) shows pressure-induced Raman spectral changes in the region from 200 to 500 cm−1 of the TFSI anion in [C3mim][TFSI]. As with previous studies,21,31 we used this band for conformational equilibrium analysis of the TFSI anion in an effort to gain further insight into the local structures. The fractions (C2 and C1) for [C3mim][TFSI] and [C8mim][TFSI] are plotted in Fig. 6(B). Under normal pressure, the population of C2 conformers is more favorable, but with increasing pressure, the fraction of C2 decreases, whereas that of C1 increases. Interestingly, in contrast to the conformational changes in the cation, the dependence on pressure for [C8mim][TFSI] is less and the fractions remain constant upon compression. That is, the conformational changes in the anion against pressure are relatively smaller, but those of the cation are larger when the alkyl chain is long, and vice versa. It appears that the local structures of the Cnmim cation and TFSI anion change cooperatively against pressure depending on the alkyl chain length n.
From combined vibrational and NMR spectroscopic measurements, Garage et al.32 assumed that TFSI locates above/below the imidazolium ring, with the –S![[double bond, length as m-dash]](https://www.rsc.org/images/entities/char_e001.gif) O groups pointing to the ring plane and the –CF3 groups pointing away from the ring and forming fluorine rich inter-ring layers. Because of this, the π–π stacking that can be established in imidazolium ILs33 is less likely for intermediate chain lengths (2 ≦ n ≦ 6). An increase in the C1/C2 was reported for TFSI with longer chains, where the TFSI is slightly displaced from a position above the ring to a location closer to the C2 and C6 sites without significantly changing the cation and anion interactions.
O groups pointing to the ring plane and the –CF3 groups pointing away from the ring and forming fluorine rich inter-ring layers. Because of this, the π–π stacking that can be established in imidazolium ILs33 is less likely for intermediate chain lengths (2 ≦ n ≦ 6). An increase in the C1/C2 was reported for TFSI with longer chains, where the TFSI is slightly displaced from a position above the ring to a location closer to the C2 and C6 sites without significantly changing the cation and anion interactions.
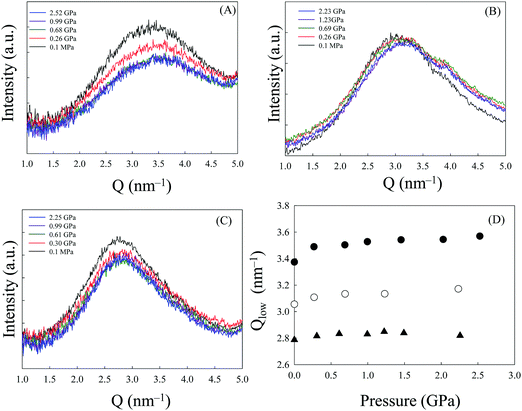
Simulations34 and experimental35 studies have shown that imidazolium-based ILs with alkyl chain lengths greater than that of the C6mim cation form nanostructural domains permeated by a charged (polar) network. Moreover, Moschovi et al.36 studied the structure of [Cnmim][TFSI] using vibrational spectroscopy (FT-IR/ATR and FT-Raman). They proposed a sponge-like structure for the system. Finally, we show the pressure dependence of SAXS normalized intensities for [C8mim][TFSI] at room temperature in Fig. 7(A). The lowest Q peak (Q ∼ 3 nm−1) is known as the pre-peak. The molecular origins of the pre-peak are still under debate, but recent reports state that it is indicative of intermediate range order associated with the size of the apolar domain in ILs, which is the average separation of segments in a charge network spaced by apolar domains.37,38 On the other hand, Fujii et al.39 concluded that for the n = 8 and 10 systems the low Q peak intensity corresponds to correlations between anions with no contribution from alkyl-group aggregates. As seen in the figure, with the initial increase in pressure to ∼0.5 GPa, the pre-peak position slightly shifted to higher Q (Fig. 7(D)) and the peak intensity decreased. However, intriguingly, the peak intensity remains almost unchanged with a further increase in pressure, even above the pg. It seems that [C8mim][TFSI] resists external pressure and almost retains the local liquid structure, as if a sponge absorbs a stimulus. In view of the results shown in Fig. 6, the adjustments are achieved by a combination of cation and anion conformational changes. The results for the [C9mim][TFSI] and [C10mim][TFSI] systems follow a similar line to those for [C8mim][TFSI] as shown in Fig. 7(B) and (C). Overall, the results indicate that even pressures as high as ∼3 GPa change but do not diminish the polar–apolar alternation and barely distort the liquid structure. On the contrary, in a previous study,11 we reported that the pre-peak almost disappeared above ∼2 GPa, at which [C8mim][BF4] falls into a superpressed state. Thus, the results are completely different for the two typical ILs.
We should note that in a recent report Dhungana et al.40 predicted the structural response to pressure of [C10mim][TFSI] by computer simulation. Overall, their results are consistent with the present study, but the intensity of the pre-peak for [C10mim][TFSI] diminished at higher pressures up to ∼1.2 GPa in their prediction. They concluded that polar–apolar alternation is more affected by pressure than charge alternation and that curlier tail conformations of the cation dominate. At higher pressure, the population of gauche states is higher, while the tails deform to lie flat at the interface with the charge network.40 This leads to smaller apolar pockets without breaking the charge networks. They ascribed this to the larger Q shift for changes in polarity alternation. They also predicted changes in the anionic conformation with pressure, i.e., between two conformers with C1 and C2 configurations. As the pressure is increased, the C2 configuration loses population to other dihedral conformations. All these conformational changes are consistent with the present results.
In addition, we should mention about the hydrogen bonds’ role in the behavior of the pressure-induced glass transition of the [Cnmim][TFSI] series. Hydrogen bonds play an important role in the dynamics of this series of ILs, other than the Coulomb and/or dispersion forces.41 Recently, Roth et al.41 investigated three [Cnmim][TFSI] (n = 1, 2, 8) with infrared, linear Raman and multiplex coherent anti-Stokes Raman scattering (CARS) spectroscopy at normal pressure. They showed that the C4–H and C5–H groups form weak hydrogen bonds with the TFSI anion, whereas the hydrogen bonds of the C2–H group are relatively stronger. Whether hydrogen bonds in ILs strengthen or weaken with increasing pressure would be intriguing issue. We suspect that the differences observed in conformational changes between cations with short and long alkyl chains together with the respective behavior of anions may reflect changes in the hydrogen bonds by applied pressure. In particular, for the pg behavior with the longest side alkyl chains (i.e., C9 and C10) in the TFSI series studied, change in the hydrogen bond strength may be responsible for the jump in pgs. Another possibility is that some plastic or liquid crystalline-type ordering in the sample with shorter side chains than that is observed at normal pressure42 may be induced by application of pressure, which is beyond the present study and needs further experimental studies. As shown in Fig. 2, the CH stretching band of the imidazolium ring (C2, C4, and C5) at ∼3175 cm−1 shifts to a higher wavenumber with increasing pressure. However, as mentioned earlier, the broad spectral features at high pressure could not allow us to perform further full-detailed quantitative analysis. A plausible explanation for the results shown in Fig. 4 is that these features are probably key to the relatively higher pg values of longer alkyl chains in [Cnmim][TFSI], though the overall picture that emerges from the present results is of complex layers of structure and dynamics arising from the spatial heterogeneity.
Conclusions
In summary, based on the present study, we have provided stability limits for [Cnmim][TFSI] homologues with different alkyl chain lengths (3 ≤ n ≤ 10) under stress at room temperature. We found that [Cnmim][TFSI] (n = 3–10) formed a glassy state with applied pressure. The pg increased with the length of the alkyl chain. An interesting difference was found between the pg behavior against pressure of two ILs sharing the same Cnmim cation but having different anions, i.e., [Cnmim][TFSI] and [Cnmim][BF4]. Clearly, the more complex molecular structure of the TFSI anion, which existed as C1 and C2 conformations, was responsible for the differing dependence of the pg behavior on the alkyl chain lengths. A more interesting point is that the liquid structure of [Cnmim][TFSI] tends to resist shear stress through cooperative conformational changes in the cation and anion. Each contribution shifts depending on the alkyl chain length n, where the anion contribution is relatively larger than that of the cation for shorter alkyl chains. In other words, [Cnmim][TFSI] can adapt to external stimuli such as applied pressure. We believe that the information deduced from the present study would be valuable with respect to optimizing the properties of this IL for particular applications. The use of pressure is a useful tool for fine-tuning the strength of intermolecular interactions without the unavoidable perturbations and side effects experienced when exploiting changes in temperature and chemical composition.3 Thus, we need to further explore an extended p–T region of ILs, which might allow us to draw general conclusions on the phase behavior of the ILs.43 Of course, more detailed simulations based on information from scattering experiments at high pressure will be especially helpful for analyzing actual local structures.Author contributions
Y. Y., H. A., K. M. and N. H. designed the experiments. T. T., Y. K., M. T., M. Y., N. K., D. W., N. F., H. A., and N. H. performed experiments. Y. Y., T. T. and N. H. wrote the manuscript.Conflicts of interest
There are no conflicts of interest to declare.Acknowledgements
The authors would like to thank Crimson Interactive Japan for the English language review. Part of this work was performed under the approval of the Photon Factory Program Advisory Committee (Proposal Number: 2015G124).References
- L. Su, M. Li, X. Zhu, Z. Wang, Z. Chen, F. Li, Q. Zhou and S. Hong, J. Phys. Chem. B, 2010, 114, 5061–5065 CrossRef CAS PubMed.
- O. Russina, B. Fazio, C. Schmidt and A. Triolo, Phys. Chem. Chem. Phys., 2011, 13, 12067–12074 RSC.
- Y. Yoshimura, H. Abe, Y. Imai, T. Takekiyo and N. Hamaya, J. Phys. Chem. B, 2013, 117, 3264–3269 CrossRef CAS PubMed.
- M. Shigemi, T. Takekiyo, H. Abe, N. Hamaya and Y. Yoshimura, J. Solution Chem., 2014, 43, 1614–1624 CrossRef CAS.
- F. Capitani, C. Fasolato, S. Mangialardo, S. Signorelli, L. Gontrani and P. Postorino, J. Phys. Chem. Solids, 2015, 84, 13–16 CrossRef CAS.
- H.-C. Chang, J.-C. Jiang, M.-H. Kuo, D.-T. Hsu and S. H. Lin, Phys. Chem. Chem. Phys., 2015, 17, 21143–21148 RSC.
- K. Hirosawa, K. Fujii, T. Ueki, Y. Kitazawa, M. Watanabe and M. Shibayama, Macromolecules, 2016, 49, 8249–8253 CrossRef CAS.
- V. H. Paschoal, L. F. O. Faria and M. C. C. Ribeiro, Chem. Rev., 2017, 117, 7053–7112 CrossRef CAS PubMed.
- T. Welton, Chem. Rev., 1999, 99, 2071–2084 CrossRef CAS PubMed.
- M. J. Earle and R. Seddon, Pure Appl. Chem., 2000, 72, 1391–1398 CrossRef CAS.
- Y. Yoshimura, M. Shigemi, M. Takaku, M. Yamamura, T. Takekiyo, H. Abe, N. Hamaya, D. Wakabayashi, K. Nishida, N. Funamori, T. Sato and T. Kikegawa, J. Phys. Chem. B, 2015, 119, 8146–8153 CrossRef CAS PubMed.
- T. Takekiyo, Y. Koyama, M. Shigemi, K. Matsuishi, H. Abe, N. Hamaya and Y. Yoshimura, Phys. Chem. Chem. Phys., 2017, 19, 863–870 RSC.
- C. Ye, W. Liu, Y. Chen and L. Yu, Chem. Commun., 2001, 2244–2245 RSC.
- P. K. Cooper, H. Li, M. W. Rutland, G. B. Webbera and R. Atkin, Phys. Chem. Chem. Phys., 2016, 18, 23657–23662 RSC.
- L. F. O. de Faria, M. M. Nobrega, M. L. A. Temperini and M. C. C. Ribeiro, J. Raman Spectrosc., 2013, 44, 481–484 CrossRef.
- L. Su, L. Li, Y. Hu, C. Yuan, C. Shao and S. Hong, J. Chem. Phys., 2009, 130, 184503 CrossRef PubMed.
- H. Li, L. Su, X. Zhu, X. Cheng, K. Yang and G. Yang, J. Phys. Chem. B, 2014, 118, 8684–8690 CrossRef CAS PubMed.
- P. Bonhote, A. Dias, N. Papageorgiou, K. Kalyanasundaram and M. Gratzel, Inorg. Chem., 1996, 35, 1168–1178 CrossRef CAS PubMed.
- V. R. Koch, C. Nanjundah, G. B. Appetecchi and B. Scrosati, J. Electrochem. Soc., 1995, 142, L116–L118 CrossRef CAS.
- K. Fujii, T. Fujimori, T. Takamuku, R. Kanzaki, Y. Umebayasi and S. Ishiguro, J. Phys. Chem. B, 2006, 110, 8179–8183 CrossRef CAS PubMed.
- J. C. Lassègues, J. Grondin, R. Holomb and P. Johansson, J. Raman Spectrosc., 2007, 38, 551–558 CrossRef.
- H. K. Mao and P. M. Bell, J. Appl. Phys., 1978, 49, 3276–3283 CrossRef CAS.
- G. J. Piermarini, S. Block and J. D. Barnett, J. Appl. Phys., 1973, 44, 5377–5382 CrossRef CAS.
- M. C. C. Ribeiro, A. A. H. Pádua and M. F. Costa Gomes, J. Chem. Phys., 2014, 140, 244514 CrossRef PubMed.
- J. Wu, X. Zhu, L. Su, K. Yang, X. Cheng, G. Yang and J. Liu, J. Solution Chem., 2015, 44, 2106–2116 CrossRef CAS.
- F. Capitani, F. Trequattrini, O. Palumbo, A. Paolone and P. Postorino, J. Phys. Chem. B, 2016, 120, 2921–2928 CrossRef CAS PubMed.
- J. C. Lassègues, J. Grondin, C. Aupetit and P. Johansson, J. Phys. Chem. A, 2009, 113, 305–314 CrossRef PubMed.
- A. Martinelli, A. Matic, P. Johansson, P. Jacobsson, L. Börjesson, A. Fernicola, S. Panero, B. Scrosati and H. Ohno, J. Raman Spectrosc., 2011, 42, 522–528 CrossRef CAS.
- H. Hamaguchi and R. Ozawa, Adv. Chem. Phys., 2005, 131, 85–104 CrossRef CAS.
- R. Ozawa, S. Hayashi, S. Saha, A. Kobayashi and H. Hamaguchi, Chem. Lett., 2003, 32, 948–949 CrossRef CAS.
- Y. Yoshimura, T. Takekiyo, Y. Imai and H. Abe, J. Phys. Chem. C, 2012, 116, 2097–2101 CAS.
- M. N. Garage, M. Nayeri and A. Martinelli, J. Mol. Liq., 2015, 210, 169–177 CrossRef.
- R. P. Matthews, T. Welton and P. A. Hunt, Phys. Chem. Chem. Phys., 2014, 16, 3238–3253 RSC.
- J. N. A. C. Lopes and A. A. H. Padua, J. Phys. Chem. B, 2006, 110, 3330–3335 CrossRef PubMed.
- A. Triolo, O. Russina, H. J. Bleif and E. Di Cola, J. Phys. Chem. B, 2007, 111, 4641–4644 CrossRef CAS PubMed.
- A. M. Moschovi and V. Dracopulos, J. Mol. Liq., 2015, 210, 189–199 CrossRef CAS.
- H. K. Kashyap, J. J. Hettige, H. V. R. Annapureddy and C. J. Margulis, Chem. Commun., 2012, 48, 5103–5105 RSC.
- H. V. R. Annapureddy, H. K. Kashyap, P. M. De Biase and C. J. Margulis, J. Phys. Chem. B, 2010, 114, 16838–16846 CrossRef CAS PubMed.
- K. Fujii, S. Kohara and Y. Umebayashi, Phys. Chem. Chem. Phys., 2015, 17, 17838–17843 RSC.
- K. B. Dhungana and C. J. Margulis, J. Phys. Chem. B, 2017, 121, 6890–6897 CrossRef CAS PubMed.
- C. Roth, S. Chatzipapadopoulos, D. Kerlé, F. Friedriszik, M. Lütgens, S. Lochbrunner, O. Kühn and R. Ludwig, New J. Phys., 2012, 14, 105026 CrossRef.
- Y. Nozaki, K. Yamaguchi, K. Tomida, N. Taniguchi, H. Hara, Y. Takisawa, K. Sadakane, K. Nakamura, T. Konishi and K. Fukao, J. Phys. Chem. B, 2016, 120, 5291–5300 CrossRef CAS PubMed.
- S. Mangialardo, L. Baldassarre, E. Bodo and P. Postorino, in The Structure of Ionic Liquids, ed., R. Caminiti and L. Gontrani, Springer International Publishing, Switzerland, 2014 Search PubMed.
| This journal is © the Owner Societies 2018 |

