Molecular dynamics simulation of geminal dicationic ionic liquids [Cn(mim)2][NTf2]2 – structural and dynamical properties†
Majid
Moosavi
 *,
Fatemeh
Khashei
and
Elaheh
Sedghamiz
Department of Chemistry, University of Isfahan, Isfahan 81746-73441, Iran. E-mail: m.mousavi@sci.ui.ac.ir; Fax: +98-313-668-9732; Tel: +98-313-7934942
First published on 29th November 2017
Abstract
In this work, the structural and dynamical properties of two imidazolium-based geminal dicationic ionic liquids (GDILs), i.e. [Cn(mim)2][NTf2]2 with n = 3 and 5, have been studied to obtain a fundamental understanding of the molecular basis of the macroscopic and microscopic properties of the bulk liquid phase. To achieve this purpose, molecular dynamics (MD) simulation, density functional theory (DFT) and atoms in molecule (AIM) methods were used. Interaction energies, charge transfers and hydrogen bonds between the cation and anions of each studied GDIL were investigated by DFT calculations and also AIM. The mean square displacement (MSD), self-diffusion coefficient, and transference number of the cation and anions, and also the density, viscosity and electrical conductivity of the studied GDILs, were computed at 333.15 K and at 1 atm. The simulated values were in good agreement with the experimental data. The effect of linkage alkyl chain length on the thermodynamic, transport and structural properties of these GDILs has been investigated. The structural features of these GDILs were characterized by calculating the partial site–site radial distribution functions (RDFs) and spatial distribution functions (SDFs). The heterogeneity order parameter (HOP) has been used to describe the spatial structures of these GDILs and the distribution of the angles formed between two cation heads and the middle carbon atom of the linkage alkyl chain was analyzed in these ILs. To investigate the temporal heterogeneity of the studied GDILs, the deviation of the self-part of the van Hove correlation function, Gs(![[r with combining right harpoon above (vector)]](https://www.rsc.org/images/entities/i_char_0072_20d1.gif) ,t), from the Gaussian distribution of particle displacement and also the second-order non-Gaussian parameter, α2(t), were used. Since, the transport and interfacial properties and ionic characteristics of these GDILs were studied experimentally in our previous studies as a function of linkage chain length and temperature, in this work, we try to give a better perspective of the structure and dynamics of these systems at a molecular level.
,t), from the Gaussian distribution of particle displacement and also the second-order non-Gaussian parameter, α2(t), were used. Since, the transport and interfacial properties and ionic characteristics of these GDILs were studied experimentally in our previous studies as a function of linkage chain length and temperature, in this work, we try to give a better perspective of the structure and dynamics of these systems at a molecular level.
1. Introduction
Ionic liquids (ILs) are molten salts having melting points less than 100 °C.1 ILs show specific properties such as negligible vapor pressure, low melting points, non-flammability, high thermal stability and high intrinsic ionic conductivity which make them suitable for industrial applications.2 Due to their unique properties, ILs are described as potential “green” solvents to replace conventional organic ones to reduce environmental pollution.3 The possibility of selection of different cations and anions in the structure of ILs allows for a large variety of tunable properties and applications.4Geminal dicationic ionic liquids (GDILs), as a new category of ILs, consist of two head groups linked by a rigid or flexible spacer and two monoanions.5 These compounds have received considerable attention from researchers in the academic and industrial fields due to their higher melting points, wider liquid range, and better thermal stability compared with the conventional monocationic ionic liquids (MILs). They can be used as solvents in organic reactions,6 as lubricants,7–10 as the stationary phase in gas chromatography columns,11–13 and as electrolytes in secondary batteries,14 in electrospray ionization mass spectrometry15 and in dye sensitized solar cells especially at high temperatures.16,17 Although, the number of reports on DILs is increasing gradually, the studies on this group of ILs are still limited and the knowledge about them is much less than that of MILs. There are few experimental studies on these compounds to understand their structural and dynamical properties and also to explain these properties at a molecular level.8,18–21 For example, Majhi and Sarkar22 investigated the microscopic structural organization of neat ILs and IL-based gels experimentally through resonance energy transfer (RET) studies. A small number of computational studies on imidazolium-based GDILs have been reported so far.4,21,23–27 Bodo et al.27 studied long range structural ordering of [Cn(mim)2] [NTf2]2 (n = 3, 6, 9 and 12) and compared their bulk liquid structures with gas-phase structures and also with the structures of the monoimidazolic counterparts. Yeganegi et al.26 investigated the effect of the anion type and the alkyl linkage length on the diffusion, density and microscopic structure of the liquid phase for (Cn(mim)2X2) (n = 3, 6, or 9) where X = PF6−, BF4−, and Br−. Li et al.25 studied the effects of the linkage chain length on the nanoscale organization of [Cn(mim)2](BF4)2 (n = 3, 6, 9, 12, 16) compared with those of the free alkyl chain length in MILs. They proposed idealized structural models for nanoaggregates formed by the alkyl chains of DILs and MILs. Also, Lovelock et al.24 studied the vaporization of [C3(mim)2][NTf2]2 by means of the ioncyclotron resonance mass spectroscopy technique and MD simulation. However, more studies on some features of these compounds, such as microscopic interionic interactions, heterogeneity, and their spatial structures at a nanoscopic level seem to be of great importance.
In our previous studies,28,29 we studied experimentally the transport and interfacial properties and ionic characteristics of imidazolium-based short alkyl chain length DILs ([Cn(mim)2][NTf2]2) as a function of linkage chain length and temperature. In the present work, to obtain a fundamental understanding of the molecular basis of the macroscopic and microscopic properties of the bulk liquid phase in the studied GDILs, i.e. [Cn(mim)2][NTf2]2 with n = 3 and 5, in which the cations are 1,3-bis(3-methylimidazolium-1-yl)alkane (propane or pentane) ([Cn(mim)2]2+), and the anion is bis(trifluoromethylsulfonyl)imide ([NTf2]−), we have used molecular dynamics (MD) simulation and also density functional theory (DFT) and atoms in molecule (AIM) methods. Fig. 1 shows the schematic structures and the atomic labels of the cations and anions of the studied GDILs. The effect of linkage alkyl chain length on the thermodynamic, transport and structural properties of these GDILs has been investigated. In addition, the heterogeneity order parameter (HOP) has been used to describe the spatial structures of these GDILs and the distribution of the angles formed between two cation heads and the middle carbon atom of the linkage alkyl chain was analyzed in these ILs. To investigate the temporal heterogeneity of the studied GDILs, we try to study the deviation of the self-part of the van Hove correlation function, Gs(![[r with combining right harpoon above (vector)]](https://www.rsc.org/images/entities/i_char_0072_20d1.gif) ,t), from the Gaussian distribution of particle displacement and also the second-order non-Gaussian parameter, α2(t).
,t), from the Gaussian distribution of particle displacement and also the second-order non-Gaussian parameter, α2(t).
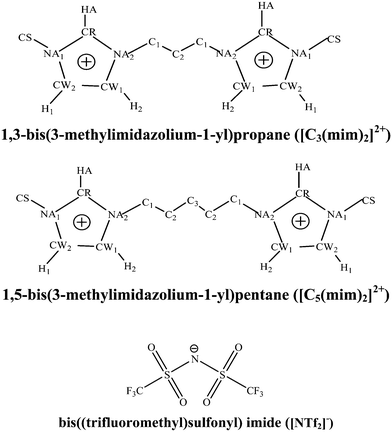 | ||
| Fig. 1 Schematic structures and atomic labels of cations and anions of the studied GDILs. The hydrogens connected to the carbons of the alkyl chains and also CS have not been shown in this figure. | ||
2. Computational details
The initial configuration of each IL (a single ion triplet) has been created as follows: the structures of the isolated cation and anions were optimized by density functional theory (DFT) at the B3LYP/6-31++G(d,p) level of theory, using the GAUSSIAN 03 program.30 The structure of each ion was checked by harmonic vibrational frequencies to ensure the absence of negative frequencies and verify the existence of a true minimum. The charges of the separate cation and anions were set at +2e and −e, respectively. After that, the structure of each IL (cation and anions together) was optimized using the B3LYP/6-31G(d) level of theory. All atom non-polarizable force fields were employed to simulate the studied DILs, which were taken from the work of Tsuzuki et al.31 The potential energy of the systems was modeled using the following standard functional form: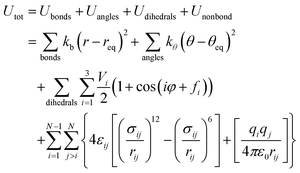 | (1) |
The functional form of the force field contains four kinds of potential energies: stretching of covalent bonds, bending of angles, torsion around dihedral angles, and nonbonded interactions. In the first three terms, the intermolecular bonds and angles are described by harmonic terms and dihedral torsion energies are represented by a series of cosines. Nonbonded interactions are described by the last term of eqn (1), including the Lennard-Jones (12-6) potential for the van der Waals interactions and the Coulombic term for the electrostatic interactions between partial charges placed on the atomic sites. The cross term parameters i.e. εij and σij are obtained by combining and mixing rules, i.e. εij = (εiiεjj)1/2 and σij = (σii + σjj)/2, respectively. The atomic partial charges were calculated using the CHarges from ELectrostatic Potentials using a Grid (CHELPG) method32 at the B3LYP/6-31++G(d,p) level of theory. The total charges for the ions obtained in this work are considerably less than unity which are in agreement with the previous simulation studies on other IL systems.33,34 The electrostatic charges, bond lengths, bond angles and dihedrals for the studied GDILs were taken from our ab initio calculations. The electrostatic charges have been reported in the ESI† (Tables S1 and S2).
The binding energy for each ionic triplet (Eb) was defined as:
| Eb = EgCP-D3GDIL − (EgCP-D3cation + 2EgCP-D3anion) | (2) |
| EgCP-D3 = Eel + EgCP + ED3 | (3) |
All of the ILs were simulated using the DL_POLY 2.17 molecular dynamics package.39 For each IL, a periodic cubic box containing 216 ion triplets was used. In these boxes, the total number of atoms of [C3(mim)2][NTf2]2 and [C5(mim)2][NTf2]2, was 13![[thin space (1/6-em)]](https://www.rsc.org/images/entities/char_2009.gif) 608 and 14
608 and 14![[thin space (1/6-em)]](https://www.rsc.org/images/entities/char_2009.gif) 904, respectively. Temperature and pressure were controlled using the Nosé–Hoover thermostat and barostat40 with 0.1 and 2 ps relaxation times, respectively. Long-range electrostatic interactions were calculated with the Ewald summation technique with a precision of 1 × 10⁻⁵. A cut-off distance of 25.0 Å was chosen for the Lennard-Jones interactions and cubic periodic boundary conditions were applied. The equations of motion were solved using the Verlet–Leapfrog integration algorithm.41 Due to the slow dynamics of these systems, in each case, the simulation was started at a relatively high temperature (350 K) at ambient pressure (1 atm). Equilibration was carried out following an annealing schedule. The temperature of the systems was increased at intervals of 50 K up to 600 K. At each temperature, the simulation was performed for 500 ps under constant NPT conditions at 1 atm. The system was then cooled down sequentially to the target temperature at steps of 50 K. After equilibration, the lengths of the sides of the simulation boxes were 55.10 Å and 57.57 Å for [C3(mim)2][NTf2]2, and [C5(mim)2][NTf2]2, respectively. Then, a 2 ns NPT simulation was carried out in order to establish the density and structure of each IL at a specified temperature at ambient pressure. The transport properties of the ions of each GDIL were calculated at 333.15 K from a 8 ns production run under NPT conditions.
904, respectively. Temperature and pressure were controlled using the Nosé–Hoover thermostat and barostat40 with 0.1 and 2 ps relaxation times, respectively. Long-range electrostatic interactions were calculated with the Ewald summation technique with a precision of 1 × 10⁻⁵. A cut-off distance of 25.0 Å was chosen for the Lennard-Jones interactions and cubic periodic boundary conditions were applied. The equations of motion were solved using the Verlet–Leapfrog integration algorithm.41 Due to the slow dynamics of these systems, in each case, the simulation was started at a relatively high temperature (350 K) at ambient pressure (1 atm). Equilibration was carried out following an annealing schedule. The temperature of the systems was increased at intervals of 50 K up to 600 K. At each temperature, the simulation was performed for 500 ps under constant NPT conditions at 1 atm. The system was then cooled down sequentially to the target temperature at steps of 50 K. After equilibration, the lengths of the sides of the simulation boxes were 55.10 Å and 57.57 Å for [C3(mim)2][NTf2]2, and [C5(mim)2][NTf2]2, respectively. Then, a 2 ns NPT simulation was carried out in order to establish the density and structure of each IL at a specified temperature at ambient pressure. The transport properties of the ions of each GDIL were calculated at 333.15 K from a 8 ns production run under NPT conditions.
The reliability of molecular dynamics simulations depends on the ability of the parameterized force fields to reproduce accurately relevant thermophysical properties such as liquid density. The simulated densities for the studied GDILs are in good agreement with the experimental data and deviations between simulated and experimental densities are about 3% over the whole temperature range (see Table S3, ESI†).
3. Results and discussion
3.1. Quantum chemistry calculations
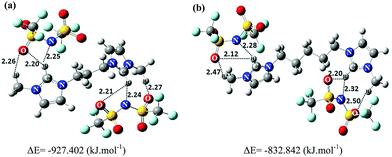
Calculating the charge transfer upon ionic triplet formation is an important factor for the analysis of the studied GDILs. While polarizable force fields are more successful in predicting the dynamical properties of ILs, they need a noticeably higher computational cost compared with the nonpolarizable ones.42 Although, the nonpolarizable force fields greatly underestimate the ionic dynamics, they can reproduce the thermodynamic and structural properties of ILs with a good accuracy.43 On the other hand, when all-atom force fields are used, the computed dynamical properties of ILs converge slowly and the use of polarizable force fields for simulation of ILs is not feasible. To improve the nonpolarizable force fields, we can calculate charge transfers between ions and even use the scaling factor to reduce the partial electrostatic charges on all interaction sites. It has been shown that the use of a scaling factor is an adequate approximation to reproduce the experimental data of ILs, especially for their transport properties within the framework of classical MD studies.43,44 As mentioned in Section 2, in this work, charge transfer processes between ions were studied through the CHELPG method. This method showed that the net charges on the cations are +1.55e and +1.65e for [C3(mim)2][NTf2]2, and [C5(mim)2][NTf2]2, respectively (which means that the net charge on each anion would be approximately −0.77e and −0.82e, respectively). As it can be seen, there is remarkable charge transfer between the corresponding ions which is in agreement with the literature for other types of ILs.33,45,46The intermolecular interactions were characterized through the estimation of binding energies as well as AIM analysis. The total electronic energies (Eel), gCP correction energies (EgCP), D3 correction energies (ED3) and binding energies are tabulated in Table 1. The reported results show hydrogen bonding between HA hydrogen atoms of the rings with nitrogen or oxygen atoms of the [NTf2]− anions and also hydrogen atoms of the methylene groups connected to the rings with oxygen of the anions. In agreement with the shorter hydrogen bond distances for most of the presented hydrogen bonds in [C3(mim)2][NTf2]2 compared with [C5(mim)2][NTf2]2, the interaction between the [C3(mim)2]2+ cation and [NTf2]− anions is stronger than that for [C5(mim)2]2+ with the anions (Fig. 2). The values of interaction energies between the dication and two anions in the studied GDILs were computed to be −927.402 kJ mol−1 and −832.842 kJ mol−1 for [C3(mim)2][NTf2]2 and [C5(mim)2][NTf2]2, respectively. These values are much greater than the reported interaction energies between ion pairs in MILs.4,47,48 This can be due to the stronger electrostatic attractions between the cation and the anions in GDILs compared with the interactions between the ions in MILs which is responsible for the higher melting point and thermal stability of GDILs. This result is in agreement with those obtained by Sun et al. in which the interaction energy in [C3(mim)2][Br]2 was more than double the interaction energy in [C4mim][Br].4
| Configuration | E el (a.u.) | gCP correction (a.u.) | D3 correction (a.u.) | E el-gCP-D3 (a.u.) | E b (kJ mol−1) |
|---|---|---|---|---|---|
| [C3(mim)2]2+ | −648.498 | 0.080 | −0.055 | −648.473 | — |
| [C5(mim)2]2+ | −727.150 | 0.095 | −0.064 | −727.119 | — |
| [NTf2]− | −1827.205 | 0.103 | −0.034 | −1827.136 | — |
| [C3(mim)2][NTf2]2 | −4303.267 | 0.326 | −0.158 | −4303.099 | −927.402 |
| [C5(mim)2][NTf2]2 | −4381.875 | 0.329 | −0.164 | −4381.709 | −832.842 |
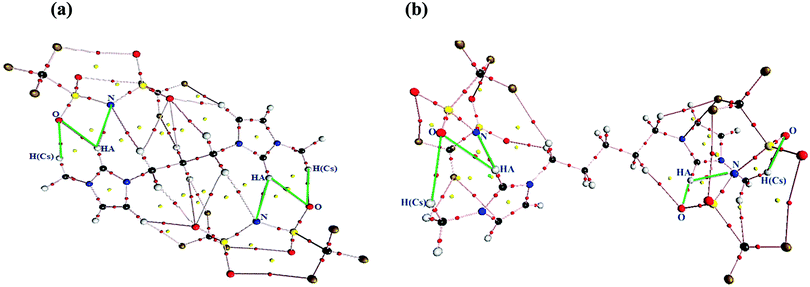
To gain a better insight into the intermolecular interactions between the cation and anions in the studied GDILs, AIM analysis was performed on the optimized geometries. In AIM, there is one bond critical point (BCP) between each pair of atoms bonded or interacting, where a critical point is defined by the point localized between two attractors. The AIM theory, based on a topological analysis of electron density at the bond critical point (ρBCP) and its laplacian (∇2ρBCP), provides a universally applicable tool for the classification of the bonding interactions occurring in any molecular system. The ρBCP is used to describe the strength of a bond, with stronger bonds associated with a larger ρBCP value. The ∇2ρBCP describes the characteristic of the bond. When ∇2ρBCP < 0, it is named as a covalent bond. When ∇2ρBCP > 0, it refers to a closed-shell interaction49 with characteristics of ionic bonds, H-bonds, or vdW interactions. In this paper, the values of ρBCP and ∇2ρBCP have been observed only for intermolecular H-bonds. The considered criterion to define a hydrogen bond according to the AIM approach is that ρBCP and ∇2ρBCP must be in the 0.002–0.035 a.u. and 0.024–0.139 a.u. ranges, respectively.50 For both of the studied GDILs, the values of ρBCP and ∇2ρBCP which are given in Table 2 are in the above mentioned ranges. Also, the topological graphics of the lowest energy ionic triplets of the studied GDILs are shown in Fig. 3. In this figure, several interaction sites can be determined between the cation and anions in the studied GDILs, where the anion interaction sites are nitrogen and oxygen atoms and the cation interaction sites are HA hydrogen atoms of the rings and also hydrogen atoms of the methylene groups connected to the rings. In this figure, the most important possible hydrogen bonds are shown with green lines. The values of ∇2ρBCP listed in Table 2 are all positive, indicating the existence of the electrostatic characteristics in the inter-ionic hydrogen bonds. According to Table 2, in both of the studied GDILs, the interaction of oxygen atoms of the anions with the HA atom of each ring of a cation is stronger than the interaction of nitrogen atoms of the anions with HA. Furthermore, it can be seen that the interaction of oxygen atoms of the anions with an HA atom of each ring is much greater than the interactions with the hydrogens of methylene groups connected to the rings. Thus, the charge depletions between the HA atoms and also hydrogens of methylene groups from the cation and the oxygen and nitrogen atoms of the anions correspond to strong hydrogen bonds.
| Structure | Bond | ρ BCP | ∇2ρBCP |
|---|---|---|---|
| [C3(mim)2][NTf2]2 | N(anion)⋯HA | 0.0162 | 0.0519 |
| N(anion)⋯HA | 0.0161 | 0.0518 | |
| O(anion)⋯HA | 0.0164 | 0.0548 | |
| O(anion)⋯HA | 0.0165 | 0.0550 | |
| O(anion)⋯H(Cs) | 0.0128 | 0.0459 | |
| O(anion)⋯H(Cs) | 0.0128 | 0.0458 | |
| [C5(mim)2][NTf2]2 | N(anion)⋯HA | 0.0156 | 0.0548 |
| N(anion)⋯HA | 0.0172 | 0.0563 | |
| O(anion)⋯HA | 0.0195 | 0.0593 | |
| O(anion)⋯HA | 0.0170 | 0.0557 | |
| O(anion)⋯H(Cs) | 0.0097 | 0.0337 | |
| O(anion)⋯H(Cs) | 0.0090 | 0.0318 | |
3.2. Molecular dynamics simulations
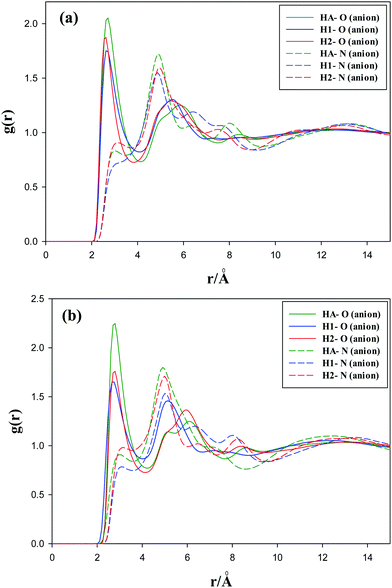
The radial distribution functions of the oxygen atoms of the anions with the hydrogen atoms of the methyl groups (hydrogen atoms connected to the CS atom) for the studied GDILs are given in Fig. 5 at 333.15 K and 1 atm. As this figure shows, the first peaks of the RDFs show less intensity than those observed for the interactions of oxygen atoms with the cation ring hydrogens, i.e. HA, H1 and H2 (see Fig. 4). This interaction is a little stronger for [C3(mim)2][NTf2]2, which is in agreement with higher values of ρBCP obtained from AIM calculations.
Fig. S1 (ESI†) shows the center of mass RDFs of cation–cation, anion–anion, and cation–anion for the studied GDILs at 333.15 K and 1 atm. While the anion–anion and cation–cation interactions show first peaks at about 8 or 9 Å, the cation–anion RDF exhibits a strong first peak at about 4 Å for each of the studied GDILs. Positioning of these interactions at shorter separations indicates preferential cation–anion interactions over the two other ones. In fact, to preserve the conditions of local electroneutrality, the ions of a given type prefer to be surrounded by ions of opposite charge. All RDFs exhibit a second less-intense but broader peak and also a weak third peak at longer distances, which is due to the long-range Coulombic interactions. The cation–cation RDFs exhibit a broad first peak, with a low intensity compared to those of the other two pair types.
The radial distribution functions of the anions [NTf2]− around the CR carbon atom of the rings and also the carbon atom in the middle of the alkyl chain for the studied GDILs have been given in Fig. S2 (ESI†) at 333.15 K and 1 atm. The labels are defined according to those in Fig. 1. The distinct and sharp peaks at about 6 Å indicate strong interactions between the mentioned carbon atoms of the cations and the anions. Fig. S2 (ESI†) shows that the interactions between the anions and the CR carbon of the rings are stronger than the interactions of the anions with the carbon atom in the middle of the alkyl chain for the studied GDILs.
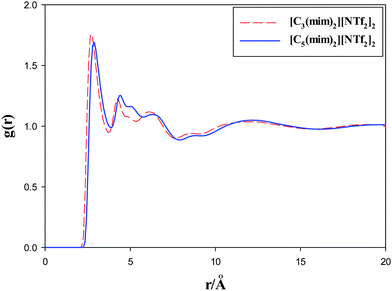
Alkyl chain–alkyl chain RDFs of the studied GDILs are shown in Fig. 6 at 333.15 K and 1 atm. As this figure shows, in spite of [C3(mim)2][NTf2]2, which has a weak broad peak at about 10 Å, [C5(mim)2][NTf2]2 shows a sharp and intense peak at about 5 Å. This shows the aggregation of the alkyl chains in [C5(mim)2][NTf2]2. Two kinds of interactions i.e. Coulombic interactions between the rings and anions and the short-range attractive van der Waals interactions between the alkyl chains compete with each other under a geometrical constraint between the rings and alkyl chain groups in these GDILs. It seems that, with increasing the linkage alkyl chain length in [C5(mim)2][NTf2]2, the rings have less effect on the aggregation of the alkyl chain groups and the alkyl chain groups have more freedom to be closer to each other. In the case of [C3(mim)2][NTf2]2, the geometrical constraint restricts the aggregation of the alkyl chains due to the short linkages.
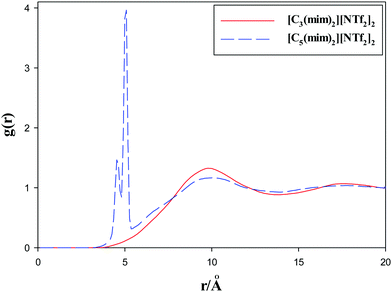 | ||
| Fig. 6 Radial distribution functions of alkyl chain–alkyl chain of the studied GDILs at 333.15 K and 1 atm. | ||
To give useful visual insights into the spatial arrangement between the anions and cations in the studied GDILs, the three-dimensional spatial distribution functions (SDFs) have been calculated via the Travis package51 and visualized by the VMD program52 as shown in Fig. 7. In this figure, mauve stands for [NTf2]−, cyan for carbon, blue for nitrogen, and white for hydrogen. As it can be seen in Fig. 7, the probability of finding anions around the imidazolium rings is higher than that around the alkyl chains and the anions are clustered around the rings. For better presentation and clarity, the clustering of anions around the rings has been presented just for one of the rings in Fig. 7. This result is similar to the results obtained for MILs33 and some other DILs.26 As it is recognizable in the SDFs, the GDILs bend to maximize the electrostatic interactions of the imidazolium rings with the anions and also to minimize the interactions between ions with the same charges.
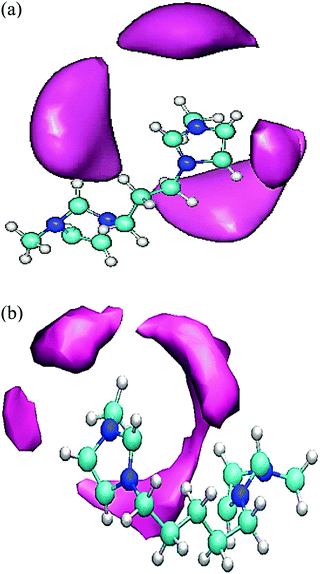 | ||
| Fig. 7 Spatial distribution functions (SDFs) of the anion [NTf2]− around the cations: Mauve, [NTf2]−; cyan, carbon; blue, nitrogen; white, hydrogen. | ||
To investigate the structural nano-organization of the studied GDILs, the distribution of the angles formed by two vectors pointing from the rings to the center atom of the linkage chain for the studied GDILs is shown in Fig. 8 at 333.15 K. Li et al.25 showed that in spite of MILs in which a micelle-like nanoaggregate model proposed by Triolo et al.53,54 is acceptable, in DILs, nanoscale organization is more complicated due to the constraint of the linkage alkyl chain between two imidazolium rings and reduction of the flexibility. They showed that in a series of [Cn(mim)2][BF4]2 with different values of n, neither the straight chain model, nor the folded chain model exist and the nanoscale aggregates consist of a mixture of a majority of unfolded and a small portion of highly folded DILs. Fig. 10 shows that there is a relatively wide distribution of angles formed between the rings and the center atom of the linkage chain for both of the studied GDILs. While in [C5(mim)2][NTf2]2, the most probable distribution of angles is between 100 to 180 degrees, this range for [C3(mim)2][NTf2]2 is between 70 to 140 degrees. In fact, in both of the studied GDILs, the obtuse angles are more probable. According to Fig. 8, the angles with the largest population for [C3(mim)2][NTf2]2 and [C5(mim)2][NTf2]2 are about 120 and 140 degrees, respectively. It must be mentioned that, in [C3(mim)2][NTf2]2, although the angle at about 120 degrees is the angle with the largest population, the structures with the angle about 90 degrees are also important. Increasing this angle with increasing the linkage alkyl chain may be due to a balance between increasing the polarity alternation distance as a result of reduction of electrostatic interactions between the head groups and anions and flexibility of the linkage chain. The dependence of angle distribution on temperature is shown in Fig. S3 (ESI†) for [C5(mim)2][NTf2]2 in the temperature range of 298 to 333 K, which represents weak dependence on temperature. According to this figure, the maximum angle increases from 135 to 140, when the temperature increases from 298 to 333 K. This narrow increasing may be interpreted as a result of increasing the flexibility at higher temperatures.
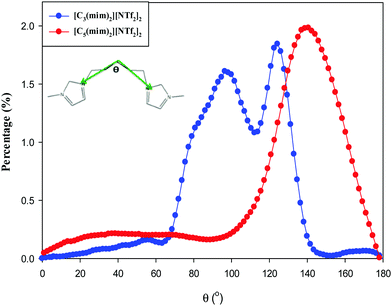 | ||
| Fig. 8 Distribution of the angles formed by two vectors pointing from the rings towards the center atom of the linkage chain for the studied GDILs at 333.15 K. | ||
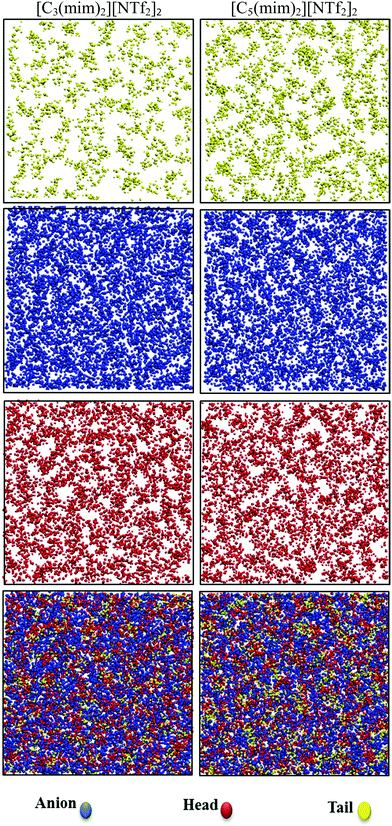
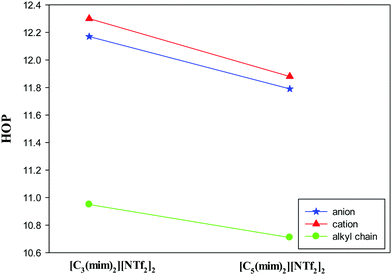
The spatial heterogeneity of the studied GDILs may be characterized by an uneven distribution of different sites in these systems and can be quantify by the heterogeneity order parameter (HOP) which is defined as55,56
 | (4) |
For simulating the transport properties of these GDILs, the simulations were performed under 20% charge reduction on all atomic sites. To consider the polarization effects of highly polarizable ions, the partial charge of each atom must be reduced more than that calculated by methods such as CHELPG. In fact, using the overall charge as a fitting parameter in classical force fields describing ILs, as reduction of the ionic charges, will accelerate the dynamics and give a better agreement between classical force-field simulations and experimental results, especially for transport properties. In recent years, in simulations of IL properties, several authors used reduced charges by applying a scaling factor on all atomic sites of the IL.33,43,57 It must be mentioned that using the nonpolarizable force field with intact partial charges (such as that carried out by Yeganegi et al.26 on some DILs) underestimates the dynamics and overestimates the values of viscosities obtained by the simulation. In this case, just the trends of calculated diffusion coefficients and viscosities remain unchanged. More complete discussion in this subject has been given in our previous work on the simulation of linear tricationic ILs (LTILs).34
The self-diffusion coefficient (D) of ion i can be evaluated from both the Green–Kubo formula58 and also from the Einstein relation. The Einstein relation is the most commonly used method to calculate D. Indeed, if a diffusive regime can be established at relatively long simulation times, the values of diffusion coefficients can be calculated from the MSD plots. Each simulated MSD for the anions and cations was calculated from an 8 ns production run which was performed under 20% reduction of partial charges. The Einstein relation is as follows
 | (5) |
| MSDαtβ | (6) |
 | (7) |
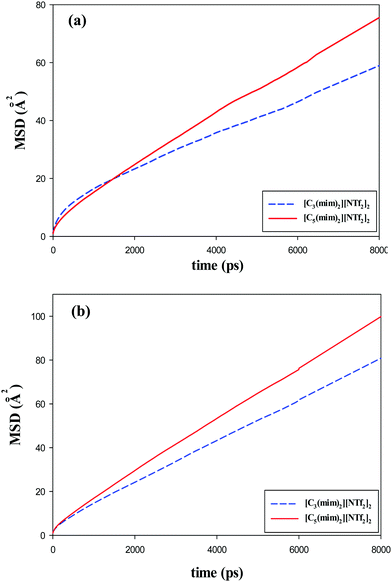 | ||
| Fig. 11 Mean square displacements (MSDs) of the (a) cations and (b) anions of the studied GDILs at 333.15 K and 1 atm. | ||
| Property | [C3(mim)2][NTf2]2 | [C5(mim)2][NTf2]2 | ||||
|---|---|---|---|---|---|---|
| Simu. (MSD) | Simu. (VACF) | Exp. | Simu. (MSD) | Simu. (VACF) | Exp. | |
a
 . .
|
||||||
| D + (10−11 m2 s−1) | 1.00 (8.93) | 1.066 (2.91) | 1.098 | 1.38 (−17.95) | 1.202 (−2.73) | 1.17 |
| D − (10−11 m2 s−1) | 1.59 (11.67) | 1.542 (14.33) | 1.80 | 1.98 (0.50) | 2.078 (−4.42) | 1.99 |
| % t+ | 55.71 (−1.53) | 58.03 (−5.75) | 54.87 | 58.23 (−7.97) | 53.63 (0.56) | 53.93 |
| % t− | 44.28 (1.86) | 41.97 (7.00) | 45.13 | 41.77 (9.33) | 46.36 (−0.63) | 46.07 |
| Λ (mS cm−1) | 3.88 (10.00) | 4.03 (6.51) | 4.311 | 4.86 (−12.24) | 4.46 (−3.00) | 4.33 |
| η (cP) | 164.21 (−12.62) | 165.40 (−13.44) | 145.8 | 112.96 (−2.69) | 114.00 (−3.64) | 110.00 |
Furthermore, we calculated the self-diffusion coefficient (D) of the ions of the studied GDILs using velocity autocorrelation functions (VACFs). The VACF is defined using the following expression:
 | (8) |
Fig. 11 and also Table 3 show that for both studied GDILs, the anion diffuses faster than the corresponding dication. This is in line with the experimental results28 due to the smaller size of the anion compared to the cation. The hydrodynamic radii of the anion/cation are 1.391/2.287 and 1.652/2.823 for [C3(mim)2][NTf2]2 and [C5(mim)2][NTf2]2, respectively (see ref. 28). In addition, the self-diffusion of the cation and anions of [C5(mim)2][NTf2]2 is more than that of [C3(mim)2][NTf2]2 which is in agreement with the lower viscosity in the former. With an increase in the number of carbons in the linkage alkyl chain, the balance between two opposing effects, i.e. weakening the electrostatic attractions between the anion and cation as a result of the dispersion of the charge centers and also the enhancement of the vdW interactions, determines the dynamics of the ions. It seems that weakening the electrostatic attractions dominates and the diffusion of the [C5(mim)2][NTf2]2 increases.
A comparison among MSDs of the ring (the CR atom in the imidazolium cation), alkyl chain (the carbon atom in the middle of the alkyl chain), and anion (the nitrogen atom of the [NTf2]−) for the studied GDILs is shown in Fig. S6 (ESI†) at 333.15 K and 1 atm. As this figure shows, for both studied GDILs, at large time scales, anions move faster than the atoms of the ring and these atoms, in turn, move faster than the atoms of the linkage alkyl chains. The time scales in which no crossing point has been observed are after 3 ns and 5 ns for [C3(mim)2][NTf2]2 and [C5(mim)2][NTf2]2, respectively. This shows that the dynamics of these groups is identical at large time scales. Also, the MSDs show that the dynamics of the linkage alkyl chain and the ring in each of the studied GDILs are similar, which indicates that the motion of these groups is highly correlated with each other. However, there are some crossing points for these GDILs at short time scales. The crossing points are sensitive to the proper equilibration and trajectory averaging in the simulations for each IL.26
Fig. S7 (ESI†) shows the MSDs of the carbon atoms of the linkage alkyl chain in the studied GDILs at 333.15 K and 1 atm. As shown in this figure, on moving from the rings toward the center of the linkage alkyl chain, the MSDs and thus self-diffusion coefficients decrease. In fact, the alkyl chain carbon atoms which are near the rings move faster than the carbons in the center of the linkage alkyl chain. It seems that the presence of the anions around the rings may be a possible reason for this result, due to the faster motion of the anions as discussed before. In other words, the anion tends to remain around the rings and the interaction between the anion and atoms of the chain decreases for the atoms that are far from the rings.
To investigate the temporal heterogeneity of the studied GDILs, the deviation of the self-part of the van Hove correlation function, Gs(![[r with combining right harpoon above (vector)]](https://www.rsc.org/images/entities/i_char_0072_20d1.gif) ,t),59 from the Gaussian distribution of particle displacement and also the second-order non-Gaussian parameter, α2(t),60,61 were used. These quantities are defined as follow:
,t),59 from the Gaussian distribution of particle displacement and also the second-order non-Gaussian parameter, α2(t),60,61 were used. These quantities are defined as follow:
 | (9) |
 | (10) |
 | (11) |
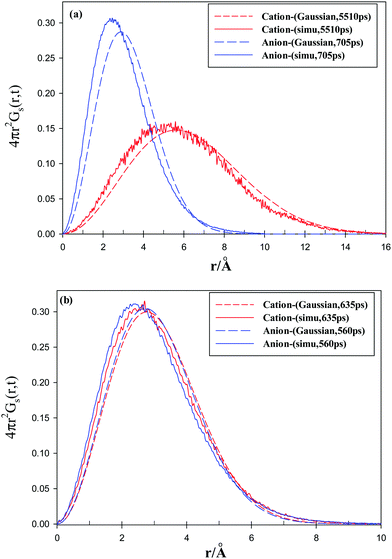
Although on macroscopic timescales the IL is homogeneous and there is no difference in the dynamical behavior of any two regions, in the simulation timescales (a few nanoseconds) there are significant differences in the dynamics of different regions.62Fig. 12 shows the simulated non-Gaussian parameter associated with cation and anion displacement in the studied GDILs at 333.15 K and 1 atm. Larger values of α2(t) can be related to the varying rates of both cationic and anionic motions, and their occurrence at longer times is due to the possibility of a non-diffusive mechanism (such as particle jump) even much after the onset of the diffusion timescale for a system.63–65 As Fig. 12 shows, there is significant temporal heterogeneity for both the anion and cation in each of these GDILs, but this temporal heterogeneity is more for anions, which indicates that the anions have a higher degree of heterogeneity in their dynamics than cations. In addition, in the Fig. S4 (ESI†), the plots of β(t) = d[log(MSD)]/d[log(t)] versus t have been shown for the cations and anions of the studied GDILs to examine a diffusive regime. Fig. 12 represents that, although the maximum of α2(t) occurs at shorter times (<1 ns) for the cation and anion of [C5(mim)2][NTf2]2 and the anion of [C3(mim)2][NTf2]2, the maximum of α2(t) for the cation of [C3(mim)2][NTf2]2 occurs at a much longer time (>5 ns) which is in accordance with the results obtained in Fig. S4 (ESI†) in which β(t) become close to 1 at longer times to achieve the diffusive regime. However, as Pal and Biswas63 mentioned, the presence of spatial heterogeneity (microscopic domain formation) is not a prerequisite for showing variation in motional rates, and temporal heterogeneity can exist even for much simpler systems.
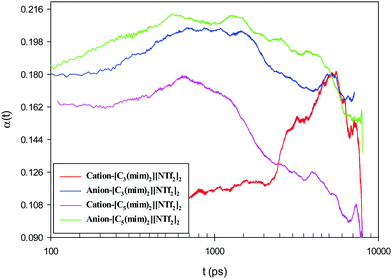 | ||
| Fig. 12 Non-Gaussian parameter associated with cation and anion displacement at 333.15 K and 1 atm for [C3(mim)2][NTf2]2 and [C5(mim)2][NTf2]2. | ||
The simulated self-part of the van Hove correlation function which is the probability distribution of displacement at time t, is shown in Fig. 13 for both of the ions in the studied GDILs at 333.15 K and 1 atm. Simulated functions correspond to the times at which the non-Gaussian parameters showed maxima. These times are mentioned in the accompanying legends in Fig. 13. In order to reflect the extent of deviation from Gaussian behavior of the particle displacements, the predicted Gaussian behavior is also shown in Fig. 13 at the same times. The Gaussian behavior can be accessed via the following relation:
 | (12) |
As it can be seen from Fig. 13, Gs(![[r with combining right harpoon above (vector)]](https://www.rsc.org/images/entities/i_char_0072_20d1.gif) ,t) deviates from the Gaussian behavior for all of the studied ions. Also, the longer tail of the curve for the cation of [C3(mim)2][NTf2]2 shows relatively large amplitude displacements for the cation of this IL. This may be due to the shorter alkyl chain linkage between the rings in [C3(mim)2][NTf2]2.
,t) deviates from the Gaussian behavior for all of the studied ions. Also, the longer tail of the curve for the cation of [C3(mim)2][NTf2]2 shows relatively large amplitude displacements for the cation of this IL. This may be due to the shorter alkyl chain linkage between the rings in [C3(mim)2][NTf2]2.
Viscosity can be evaluated computationally from both the equilibrium MD (Green–Kubo) (GK) formalism, and Stokes–Einstein formula (it must be mentioned that there is also a non-equilibrium MD approach which is based on the response of the system to an external perturbation). In the Green Kubo method, the viscosity is calculated from the time integral over the stress autocorrelation function (SACF), i.e. . Generally, obtaining good statistics in the calculation of viscosity from the GK relation, requires averaging over long time trajectories to ensure that the integrand has decayed sufficiently to allow the upper limit on the integral to be truncated. In fact, the GK method is difficult to apply in simulations of highly viscous ILs since the correlation function converges slowly with time.66,67 Thus, it seems that the estimation of the values of viscosities of the studied GDILs based on the Stokes–Einstein formula from the diffusion coefficient values can be also used as an approximation method. Viscosity can be estimated using the diffusion coefficients by the Stokes–Einstein equation
 | (13) |
The simulated self-diffusion coefficients can be used to calculate some other properties such as electrical conductivity, and also the transference numbers of cations and anions of the studied GDILs. The electrical conductivity was calculated from the Nernst–Einstein equation68
 | (14) |
The transference numbers were also estimated to study the contributions of the anions and cations to the transport of charges in these GDILs. The transference numbers show the relative mobility of the ions in an electrolyte. The transference numbers in a GDIL may be estimated from the diffusion coefficients of both cation and anion, according to
 | (15) |
The results of electrical conductivities and also transference numbers of cations and anions in each of the studied GDILs are given and compared with corresponding experimental values in Table 3. As this table shows, there is relatively good agreement between calculated values in this work and those measured and obtained in our previous work.28 Viscosity plays a main role in conductivity; the larger the viscosity, the lower the conductivity. The electrical conductivity of [C5(mim)2][NTf2]2 is greater than that of [C3(mim)2][NTf2]2 which is in contrast with the viscosity values of these ILs. Although, the greater ion size in [C5(mim)2][NTf2]2 can decrease the electrical conductivity, it seems that the viscosity is a dominant factor in the total electrical conductivity of these GDILs. The calculated values of cationic and anionic transference numbers of the studied GDILs are given in Table 3 at 333.15 K and at 1 atm. As this table shows, the transference number for the cation is greater than the anion which can be related to the larger diffusion coefficients of the cation. This result is in accordance with the results obtained in some previous studies for MILs,72 dicationic ILs25 and tricationic ILs.34 It must be mentioned that in electrolytes with t+ > 0.5, the cations have a larger contribution to the ionic conductivity of the electrolyte than the anions.
4. Conclusions
The transport and interfacial properties and ionic characteristics of imidazolium-based short alkyl chain length DILs ([Cn(mim)2][NTf2]2) as a function of linkage chain length and temperature have been studied experimentally in our previous studies. In this study, we obtained a fundamental understanding of the molecular basis of the macroscopic and microscopic properties of a bulk liquid phase of these GDILs using classical MD simulations and also quantum mechanical methods. Interaction energies, charge transfers and hydrogen bonds between the studied ion triplets were investigated by DFT calculations and also the AIM method. The results showed that the interaction energies between ion triplets in the studied GDILs are much greater than those of ion pairs in MILs which may be due to the stronger electrostatic attractions between the cation and the anions in GDILs and is responsible for their higher melting point and thermal stability. The results also showed that, in both of the studied GDILs, the interactions of oxygen atoms of the anions with the HA atom of each ring of the cation are stronger than the interactions of nitrogen atoms of the anions with the HA atoms. Also, it can be seen that the interactions of oxygen atoms of the anions with the HA atom of each ring are much greater than the interactions with the hydrogens of methylene groups connected to the rings.The effect of linkage alkyl chain length on the thermodynamic, transport and structural properties of these GDILs have been investigated. The structural features of these GDILs were characterized by calculating the partial site–site RDFs and SDFs. In accordance with the results of DFT and AIM, RDFs show that, compared to the nitrogen atom, the oxygen atoms of the anions are more likely to form hydrogen bonds with the ring hydrogen atoms. The center of mass RDFs of cation–cation, anion–anion, and cation–anion for the studied GDILs show that to preserve the conditions of local electroneutrality, the ions of a given type prefer to be surrounded by ions of opposite charge. Alkyl chain–alkyl chain RDFs of the studied GDILs show the aggregation of the alkyl chains in [C5(mim)2][NTf2]2. In fact, with increasing the linkage alkyl chain length in [C5(mim)2][NTf2]2, the Coulombic interactions on the rings have less effect on the aggregation of the alkyl chain groups and the alkyl chain groups have more freedom to be closer to each other. In the case of [C3(mim)2][NTf2]2, the geometrical constraint restricts the aggregation of the alkyl chains due to the short length of these linkages. Also, the SDFs of these GDILs indicated that these ILs bend to maximize the electrostatic interactions of imidazolium rings with the anions and also to minimize the interactions between ions with the same charges.
The heterogeneity order parameter (HOP) has been used to describe the spatial structures of these GDILs and the distribution of the angles formed between two cation heads and the middle carbon atom of the linkage alkyl chain was analyzed in these ILs. According to the results, all sites aggregate to form several spatially heterogeneous domains, but this aggregation is relatively more for the alkyl chains of the cations. Also, for the studied GDILs, neither the straight chain model, nor the folded chain model exists and the nanoscale aggregates consist of a mixture of a majority of unfolded and a small portion of highly folded DILs.
To investigate the temporal heterogeneity of the studied GDILs, the deviation of the self-part of the van Hove correlation function, Gs(![[r with combining right harpoon above (vector)]](https://www.rsc.org/images/entities/i_char_0072_20d1.gif) ,t), from the Gaussian distribution of particle displacement and also the second-order non-Gaussian parameter, α2(t), were used. Gs(
,t), from the Gaussian distribution of particle displacement and also the second-order non-Gaussian parameter, α2(t), were used. Gs(![[r with combining right harpoon above (vector)]](https://www.rsc.org/images/entities/i_char_0072_20d1.gif) ,t) deviates from the Gaussian behavior for all of the studied ions. The longer tail of the curve for the cation of [C3(mim)2][NTf2]2 shows the relatively large amplitude displacements for the cation of this IL. This may be due to the shorter alkyl chain linkage between the rings in [C3(mim)2][NTf2]2. Although the maximum of α2(t) occurs at shorter times (<1 ns) for the cation and anion of [C5(mim)2][NTf2]2 and the anion of [C3(mim)2][NTf2]2, the maximum of α2(t) for the cation of [C3(mim)2][NTf2]2 occurs at a much longer time (>5 ns) which is in accordance with the results of β(t) plots in which β(t) for the cation of [C3(mim)2][NTf2]2 becomes close to 1 at longer times to achieve the diffusive regime.
,t) deviates from the Gaussian behavior for all of the studied ions. The longer tail of the curve for the cation of [C3(mim)2][NTf2]2 shows the relatively large amplitude displacements for the cation of this IL. This may be due to the shorter alkyl chain linkage between the rings in [C3(mim)2][NTf2]2. Although the maximum of α2(t) occurs at shorter times (<1 ns) for the cation and anion of [C5(mim)2][NTf2]2 and the anion of [C3(mim)2][NTf2]2, the maximum of α2(t) for the cation of [C3(mim)2][NTf2]2 occurs at a much longer time (>5 ns) which is in accordance with the results of β(t) plots in which β(t) for the cation of [C3(mim)2][NTf2]2 becomes close to 1 at longer times to achieve the diffusive regime.
MSD, self-diffusivity, viscosity, electrical conductivity and transference numbers of cations and anions have been computed for the studied GDILs at 333.15 K and at 1 atm. The simulated values were in good agreement with experimental data. The MSDs and self-diffusion values showed that weakening the electrostatic attractions dominates over the enhancement of the vdW interactions and therefore the diffusion of [C5(mim)2][NTf2]2 increases. The MSD plots showed that, for both studied GDILs, at large time scales, the anions move faster than the atoms of the ring and these atoms, in turn, move faster than the atoms of linkage alkyl chains. The results showed that, the cations have a larger contribution to the ionic conductivity of the electrolyte than the anions. Altogether, in this work, a better perspective of the structuring and dynamics of the studied GDILs has been obtained at a molecular level.
Conflicts of interest
There are no conflicts to declare.Acknowledgements
This research was supported financially by the Research Council of University of Isfahan. The authors are also indebted to Institute for Studies in Theoretical Physics and Mathematics (IPM) for providing us with the HPC Cluster to perform a part of the simulations.References
- A. Sanmartín Pensado, P. Malfreyt and A. l. A. Pádua, J. Phys. Chem. B, 2009, 113, 14708–14718 CrossRef PubMed
.
- B. Heggen, W. Zhao, F. Leroy, A. J. Dammers and F. Müller-Plathe, J. Phys. Chem. B, 2010, 114, 6954–6961 CrossRef CAS PubMed
.
- T. G. Youngs and C. Hardacre, ChemPhysChem, 2008, 9, 1548–1558 CrossRef CAS PubMed
.
- H. Sun, D. Zhang, C. Liu and C. Zhang, THEOCHEM, 2009, 900, 37–43 CrossRef CAS
.
- B. Bhargava and M. L. Klein, J. Phys. Chem. B, 2011, 115, 10439–10446 CrossRef CAS PubMed
.
- S. K. Chellappan, Y. Xiao, W. Tueckmantel, K. J. Kellar and A. P. Kozikowski, J. Med. Chem., 2006, 49, 2673–2676 CrossRef CAS PubMed
.
- C.-M. Jin, C. Ye, B. S. Phillips, J. S. Zabinski, X. Liu, W. Liu and M. S. Jean'ne, J. Mater. Chem., 2006, 16, 1529–1535 RSC
.
- Z. Zeng, B. S. Phillips, J.-C. Xiao and J. N. M. Shreeve, Chem. Mater., 2008, 20, 2719–2726 CrossRef CAS
.
- M. Palacio and B. Bhushan, J. Vac. Sci. Technol., A, 2009, 27, 986–995 CAS
.
- G. Yu, S. Yan, F. Zhou, X. Liu, W. Liu and Y. Liang, Tribol. Lett., 2007, 25, 197–205 CrossRef CAS
.
- J. L. Anderson and D. W. Armstrong, Anal. Chem., 2005, 77, 6453–6462 CrossRef CAS PubMed
.
- M. Qi and D. W. Armstrong, Anal. Bioanal. Chem., 2007, 388, 889–899 CrossRef CAS PubMed
.
- K. Huang, X. Han, X. Zhang and D. W. Armstrong, Anal. Bioanal. Chem., 2007, 389, 2265–2275 CrossRef CAS PubMed
.
- Z. Zhang, H. Zhou, L. Yang, K. Tachibana, K. Kamijima and J. Xu, Electrochim. Acta, 2008, 53, 4833–4838 CrossRef CAS
.
- F. M. Nachtigall, Y. E. Corilo, C. C. Cassol, G. Ebeling, N. H. Morgon, J. Dupont and M. N. Eberlin, Angew. Chem., Int. Ed., 2008, 47, 151–154 CrossRef CAS PubMed
.
- J. Y. Kim, T. H. Kim, D. Y. Kim, N.-G. Park and K.-D. Ahn, J. Power Sources, 2008, 175, 692–697 CrossRef CAS
.
- C. Zafer, K. Ocakoglu, C. Ozsoy and S. Icli, Electrochim. Acta, 2009, 54, 5709–5714 CrossRef CAS
.
- J. L. Anderson, R. Ding, A. Ellern and D. W. Armstrong, J. Am. Chem. Soc., 2005, 127, 593–604 CrossRef CAS PubMed
.
- J. Pitawala, A. Matic, A. Martinelli, P. Jacobsson, V. Koch and F. Croce, J. Phys. Chem. B, 2009, 113, 10607–10610 CrossRef CAS PubMed
.
- K. Ito, N. Nishina and H. Ohno, Electrochim. Acta, 2000, 45, 1295–1298 CrossRef CAS
.
- B. Bhargava and M. L. Klein, J. Chem. Theory Comput., 2010, 6, 873–879 CrossRef CAS PubMed
.
- D. Majhi and M. Sarkar, Phys. Chem. Chem. Phys., 2017, 19, 23194–23203 RSC
.
- N. S. Nooruddin, P. G. Wahlbeck and W. R. Carper, Tribol. Lett., 2009, 36, 147–156 CrossRef CAS
.
- K. R. Lovelock, A. Deyko, J. A. Corfield, P. N. Gooden, P. Licence and R. G. Jones, ChemPhysChem, 2009, 10, 337–340 CrossRef CAS PubMed
.
- S. Li, G. Feng, J. L. Bañuelos, G. Rother, P. F. Fulvio, S. Dai and P. T. Cummings, J. Phys. Chem. C, 2013, 117, 18251–18257 CAS
.
- S. Yeganegi, A. Soltanabadi and D. Farmanzadeh, J. Phys. Chem. B, 2012, 116, 11517–11526 CrossRef CAS PubMed
.
- E. Bodo, M. Chiricotto and R. Caminiti, J. Phys. Chem. B, 2011, 115, 14341–14347 CrossRef CAS PubMed
.
- M. Moosavi, F. Khashei, A. Sharifi and M. Mirzaei, Ind. Eng. Chem. Res., 2016, 55, 9087–9099 CrossRef CAS
.
- M. Moosavi, F. Khashei, A. Sharifi and M. Mirzaei, J. Chem. Thermodyn., 2017, 107, 1–7 CrossRef CAS
.
-
M. Frisch, G. Trucks, H. Schlegel, G. Scuseria, M. Robb, J. Cheeseman and J. Montgomery, Gaussian 03, revision C. 02, 2008 Search PubMed
.
- S. Tsuzuki, W. Shinoda, H. Saito, M. Mikami, H. Tokuda and M. Watanabe, J. Phys. Chem. B, 2009, 113, 10641–10649 CrossRef CAS PubMed
.
- C. M. Breneman and K. B. Wiberg, J. Comput. Chem., 1990, 11, 361–373 CrossRef CAS
.
- M. H. Ghatee, A. R. Zolghadr, F. Moosavi and Y. Ansari, J. Chem. Phys., 2012, 136, 124706 CrossRef PubMed
.
- E. Sedghamiz and M. Moosavi, J. Phys. Chem. B, 2017, 121, 1877–1892 CrossRef CAS PubMed
.
- H. Kruse, L. Goerigk and S. Grimme, J. Org. Chem., 2012, 77, 10824–10834 CrossRef CAS PubMed
.
- S. Grimme, J. Antony, S. Ehrlich and H. Krieg, J. Chem. Phys., 2010, 132, 154104 CrossRef PubMed
.
- G. Henkelman, A. Arnaldsson and H. Jónsson, Comput. Mater. Sci., 2006, 36, 354–360 CrossRef
.
- F. Biegler-Konig and J. Schonbohm, J. Comput. Chem., 2002, 23, 1489–1494 CrossRef CAS PubMed
.
-
W. Smith, T. Forester and I. Todorov, STFC, STFC Daresbury Laboratory, Daresbury, Warrington, Cheshire, WA4 4AD, UK, version, 2012 Search PubMed
.
- S. Nosé, J. Chem. Phys., 1984, 81, 511–519 CrossRef
.
-
M. P. Allen and D. J. Tildesley, Computer simulation of liquids, Oxford University Press, 1989 Search PubMed
.
- M. Salanne, Phys. Chem. Chem. Phys., 2015, 17, 14270–14279 RSC
.
- V. Chaban, Phys. Chem. Chem. Phys., 2011, 13, 16055–16062 RSC
.
- I. Leontyev and A. Stuchebrukhov, Phys. Chem. Chem. Phys., 2011, 13, 2613–2626 RSC
.
- W. Zhao, H. Eslami, W. L. Cavalcanti and F. Müller-Plathe, Z. Phys. Chem., 2007, 221, 1647–1662 CrossRef CAS
.
- S. Aparicio and M. Atilhan, J. Phys. Chem. B, 2012, 116, 9171–9185 CrossRef CAS PubMed
.
- K. Dong, S. Zhang, D. Wang and X. Yao, J. Phys. Chem. A, 2006, 110, 9775–9782 CrossRef CAS PubMed
.
- P. A. Hunt, I. R. Gould and B. Kirchner, Aust. J. Chem., 2007, 60, 9–14 CrossRef CAS
.
- M. Solimannejad, I. Alkorta and J. Elguero, Chem. Phys. Lett., 2007, 449, 23–27 CrossRef CAS
.
- R. G. Parr and W. Yang, Annu. Rev. Phys. Chem., 1995, 46, 701–728 CrossRef CAS PubMed
.
- M. Brehm and B. Kirchner, J. Chem. Inf. Model, 2011, 51, 2007–2023 CrossRef CAS PubMed
.
- W. Humphrey, A. Dalke and K. Schulten, J. Mol. Graphics, 1996, 14, 33–38 CrossRef CAS PubMed
.
- O. Russina, A. Triolo, L. Gontrani, R. Caminiti, D. Xiao, L. G. Hines Jr, R. A. Bartsch, E. L. Quitevis, N. Plechkova and K. R. Seddon, J. Phys.: Condens. Matter, 2009, 21, 424121 CrossRef
.
- A. Triolo, O. Russina, B. Fazio, R. Triolo and E. Di Cola, Chem. Phys. Lett., 2008, 457, 362–365 CrossRef CAS
.
- Y. Ji, R. Shi, Y. Wang and G. Saielli, J. Phys. Chem. B, 2013, 117, 1104–1109 CrossRef CAS PubMed
.
- Y. Wang and G. A. Voth, J. Phys. Chem. B, 2006, 110, 18601–18608 CrossRef CAS PubMed
.
- B. Bhargava and S. Balasubramanian, J. Chem. Phys., 2007, 127, 114510 CrossRef CAS PubMed
.
-
J.-P. Hansen and I. R. McDonald, Theory of Simple Liquids: With Applications to Soft Matter, Academic Press, 2013 Search PubMed
.
- Z. Hu and C. J. Margulis, Proc. Natl. Acad. Sci. U. S. A., 2006, 103, 831–836 CrossRef CAS PubMed
.
- J. Picalek and J. Kolafa, Mol. Simul., 2009, 35, 685–690 CrossRef CAS
.
- A. Rahman, Phys. Rev., 1964, 136, A405 CrossRef
.
- S. S. Sarangi, W. Zhao, F. Müller-Plathe and S. Balasubramanian, ChemPhysChem, 2010, 11, 2001–2010 CAS
.
- T. Pal and R. Biswas, Theor. Chem. Acc., 2013, 132, 1348 CrossRef
.
- T. Pal and R. Biswas, J. Phys. Chem. B, 2015, 119, 15683–15695 CrossRef CAS PubMed
.
- T. Pal and R. Biswas, J. Chem. Phys., 2014, 141, 104501 CrossRef PubMed
.
- N.-T. Van-Oanh, C. Houriez and B. Rousseau, Phys. Chem. Chem. Phys., 2010, 12, 930–936 RSC
.
- W. Jiang, T. Yan, Y. Wang and G. A. Voth, J. Phys. Chem. B, 2008, 112, 3121–3131 CrossRef CAS PubMed
.
-
J. Hansen and I. R. McDonald, Theory of Simple Liquids, Academic Press, London, 1986 Search PubMed
.
- S. U. Lee, J. Jung and Y.-K. Han, Chem. Phys. Lett., 2005, 406, 332–340 CrossRef CAS
.
- C. Rey-Castro, A. Tormo and L. Vega, Fluid Phase Equilib., 2007, 256, 62–69 CrossRef CAS
.
- C. Rey-Castro and L. F. Vega, J. Phys. Chem. B, 2006, 110, 14426–14435 CrossRef CAS PubMed
.
- M. Kowsari, S. Alavi, M. Ashrafizaadeh and B. Najafi, J. Chem. Phys., 2008, 129, 224508 CrossRef CAS PubMed
.
Footnote |
| † Electronic supplementary information (ESI) available: The electrostatic charges for the atoms of the studied GDILs obtained at the B3LYP/6-31++G(d,p) level of theory by the CHELPG method, the simulated densities (in g cm−3) of the studied GDILs at different temperatures and at 1 atm and also some figures. See DOI: 10.1039/c7cp05681h |
| This journal is © the Owner Societies 2018 |

