Quantum-state-selected integral cross sections for the charge transfer collision of O2+(a4Πu5/2,3/2,1/2,−1/2: v+ = 1–2; J+) [O2+(X2Πg3/2,1/2: v+ = 22–23; J+)] + Ar at center-of-mass collision energies of 0.05–10.00 eV
Bo
Xiong
 ,
Yih-Chung
Chang
 and
Cheuk-Yiu
Ng
 *
*
Department of Chemistry, University of California, Davis, CA 95616, USA. E-mail: cyng@ucdavis.edu
First published on 7th September 2017
Abstract
By employing the sequential electric field pulsing scheme for vacuum ultraviolet (VUV) laser pulsed field ionization-photoion (PFI-PI) detection, we have successfully recorded the spin–orbit and rovibronic state resolved VUV-PFI-PI spectra for O2+(a4Πu5/2,3/2,1/2,−1/2: ν+ = 0–2; J+) and O2+(X2Πg3/2,1/2: ν+ = 21–23; J+), indicating that O2+(a4Πu) and O2+(X2Πg) ions in these spin–orbit and rovibronic states can be prepared for ion–molecule collision studies. The present experiment is concerned with the measurement of absolute integral cross sections (σ's) of the charge transfer reactions, O2+(a4Πu5/2,3/2,1/2,−1/2: ν+ = 1, 2; J+) [O2+(X2Πg1/2,3/2: ν+ = 22, 23)] + Ar → Ar+ + O2. The fact that the O2+(a4Πu5/2,3/2,1/2,−1/2: ν+ = 1) and O2+(X2Πg3/2,1/2: ν+ = 22) [O2+(a4Πu5/2,3/2,1/2,−1/2: ν+ = 2) and O2+(X2Πg3/2,1/2: ν+ = 23)] states are in close energy resonance, makes these reactions ideal model systems for investigating the energy resonance and Franck–Condon factor (FCF) effects on the charge transfer reactivity of O2+. The σ(a4Πu5/2,3/2,1/2,−1/2: ν+ = 1, 2) values are found to be about ten-fold higher than the σ(X2Πg3/2,1/2: ν+ = 22, 23) values at Ecm = 0.05–10.00 eV, indicating that the FCFs play a predominant role in promoting these charge transfer reactions. The present ion–molecule reaction study also shows that σ(a4Πu) depends strongly on the spin–orbit as well as the vibrational states with the order: σ(a4Πu: v+ = 2) > σ(a4Πu: v+ = 1), and σ(a4Πu5/2: v+) > σ(a4Πu3/2: v+) > σ(a4Πu1/2: v+) > σ(a4Πu−1/2: v+), where v+ = 1 and 2. The high σ(a4Πu5/2,3/2,1/2,−1/2: v+ = 1, 2) values, along with their decreasing trend with increasing Ecm, are consistent with those expected for a long range charge transfer mechanism. However, the low σ(X2Πg3/2,1/2: ν+ = 22, 23) values and the lack of Ecm-dependence observed in the Ecm range of 0.05–10.00 eV point to the involvement of short-range collision dynamics.
I. Introduction
State-selected studies of ion–molecule collisions have played an important role in the fundamental understanding of chemical reaction dynamics.1–4 The most outstanding merit of ion-neutral reaction studies is that ions in metastable and long-lived quantum states, which cannot be prepared by direct photoexcitation of ions, can be readily generated by single-photon vacuum ultraviolet (VUV) or two-color laser photoionization schemes.5–12 This capability makes possible the systematic examination of ion reactivity as a function of not only center-of-mass collision energy (Ecm), but also internal spin–orbit, rotational, vibrational, and electronic states of ions.The photoionization techniques required for ion-state preparations depend on the properties of the VUV light source used.8 It has been well established that the use of a pseudo-continuous VUV synchrotron source requires the application of the photoelectron–photoion coincidence method for state-selected studies, whereas the use of a pulsed VUV laser source necessitates the application of the PFI-PI or MATI (mass analyzed threshold ion)13 detection scheme.8,14–16
In early state-selected ion–molecule experiments using a continuous VUV discharge source, Koyano and coworkers applied the threshold electron-secondary-ion coincidence (TESICO) method and have examined the Ecm and vibrational and electronic state effects on an array of prototypical ion–molecule reaction systems, including the charge transfer reactions, O2+(a4Πu: v+ = 0–7) [O2+(X2Πg: v+ = 19, 20)] + Ar → Ar+ + O2.17,18 Limited by the TPE energy resolution of ≈30 meV (full-width at half-maximum, FWHM), the TESICO study was not able to investigate the rotational and spin–orbit state dependences on these charge transfer reactions.
Taking advantage of the dark-gap existing in the synchrotron ring period at the Advanced Light Source, we have previously introduced the dark-gap VUV-pulsed field ionization-photoelectron (VUV-PFI-PE) scheme for high-resolution photoelectron measurements.19,20 This scheme was further developed into the VUV-PFI-PE-photoion coincidence (VUV-PFI-PEPICO) method21 for state-selected unimolecular dissociation studies and the VUV-PFI-PE-secondary ion coincidence (VUV-PFI-PESICO) technique22 for state-selected bimolecular ion–molecule reaction measurements. The dark-gap VUV-PFI-PE method has demonstrated a practical energy resolution of 5–8 cm−1 (FWHM). The successful application of the synchrotron based VUV-PFI-PESICO method for rovibrational-state selected σ-measurements of a series of proton transfer reactions, H2+(X2Σg+: v+ = 0–15; N+ = 1) + He → HeH+ + H;23 HD+(X2Σ+: v+ = 0–15; N+ = 1) + He → HeH+ (HeD+) + D(H);24 H2+(X2Σg+: v+ = 0–17; N+ = 1) + Ne → NeH+ + H;25 and H2+(X2Σg+: v+ = 0–17; N+ = 1) + Ar → ArH+ + H,26 can be taken as strong evidence of the superior energy resolution and detection sensitivity achieved by the VUV synchrotron based PFI-PESICO detection approach. Nevertheless, the practical application of the VUV synchrotron based PFI-PEPISICO and TPESICO schemes remains very challenging as limited by the formidable data accumulation time required to achieve acceptable signal-to-noise ratios for quantum-state-selected σ-measurements. For more complex ion–molecule reactions, it is highly desirable to develop an alternative detection scheme with higher detection sensitivity for quantum-state-selected ion–molecule collision studies.
The recent development of the VUV laser PFI-PI ion source, along with its implementation with the double-quadrupole–double-octopole (DQDO) mass spectrometer, represents a significant experimental advance for quantum-state-selected ion–molecule reaction studies. The array of successful state-selected ion–molecule reaction studies27–37 has shown that the VUV laser PFI-PI-DQDO approach achieves exceptional detection sensitivity and energy resolution unmatched by the VUV-TPESICO and VUV-PFI-PESICO schemes, allowing not only vibrational but also rotational state selections for ion–molecule reactions of H2O+(X2B1: v1+v2+v3+; NKa+Kc++) + H2 (D2, HD, and CO),27–32 N2+(X2Σg+: v+ = 0–2, N+ = 0–9) + Ar (CH4 and C2H2),33–36 and H2+(X2Σg+: v+ = 1–3, N+ = 0–3) + Ne,37 covering the Ecm range from thermal energies (0.03 eV) to 10.00 eV. Simple signal-to-noise analysis also shows that the PFI-PI and PFI-PI-DQDO methods are superior to the photoelectron–photoion coincidence schemes. In a photoelectron–photoion coincidence experiment, the coincidence-counting rate is proportional to the product of the detection efficiency for photoelectrons and that for photoions.5 The low photoelectron detection efficiency often makes coincidence experiments very challenging. The PFI-PI approach does not involve the detection of photoelectrons. The fact that prompt ions are completely rejected before reactant PFI-PI ions enter the reaction gas cell makes coincidence background corrections unnecessary.
The present study is concerned with the σ measurement of reactions (1) and (2) using the VUV laser PFI-PI-DQDO approach.
| O2+(a4Πu5/2,3/2,1/2,−1/2: v+ = 1, 2; J+) + Ar → Ar+ + O2, | (1) |
| O2+[(X2Πg3/2,1/2: v+ = 22, 23; J+)] + Ar → Ar+ + O2. | (2) |
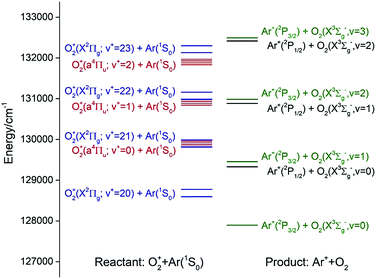
Fig. 1 shows the energy level diagram for the reactant states, O2+(a4Πu5/2,3/2,1/2,−1/2: v+ = 0–2) + Ar and O2+[(X2Πg3/2,1/2: v+ = 21–23)] + Ar, and the product states, Ar+(2P1/2,3/2) + O2(X3Σg−: v = 0–2). The O2+(a4Πu5/2,3/2,1/2,−1/2: v+ = 0–2) states are well known metastable states as the radiative decay of these states is spin-disallowed.40–42 Since O2 has no dipole moment, the radiative decay of O2+[(X2Πg3/2,1/2: v+ = 21–23)] is also electric dipole disallowed. Thus, the preparation of these long-lived states cannot be made by direct photoexcitation.
According to previous charge transfer studies of the [Ar + H2]+ and [Ar + N2] ion–molecule reaction systems,1,43,44 where both the forward and backward reaction cross sections were examined, the energy resonance factor was found to be highly important in promoting charge transfer processes. It is clear from the energy diagram of Fig. 1 that both charge transfer reactions (1) and (2) are exothermic, and that O2+(a4Πu5/2,3/2,1/2,−1/2: v+ = 1) and O2+(a4Πu5/2,3/2,1/2,−1/2: v+ = 2) states are in near energy resonance with their respective O2+(X2Πg3/2,1/2: v+ = 22) and O2+(X2Πg3/2,1/2: v+ = 23) states. Thus, reactions (1) and (2) are naturally interesting model reactions for a detailed investigation of the energy resonance factor in charge transfer collisions. Another interesting aspect that can be examined in the present study is the influence of the Franck–Condon factor (FCF) effect for electron capture by the O2+(a4Πu: v+ = 1, 2) and O2+(X2Πg: v+ = 22, 23) ions.45
II. Experiment
The σ-measurements of reactions (1) and (2) are made using the VUV laser PFI-PI-DQDO ion–molecule reaction apparatus, which has been described previously in detail.34Fig. 2 shows the schematic diagram of the apparatus, aiming to facilitate the description of the general experimental features and procedures used. Briefly, the apparatus consists of three major components, i.e., the tunable VUV laser system, the PFI-PI ion source, and the DQDO mass spectrometer.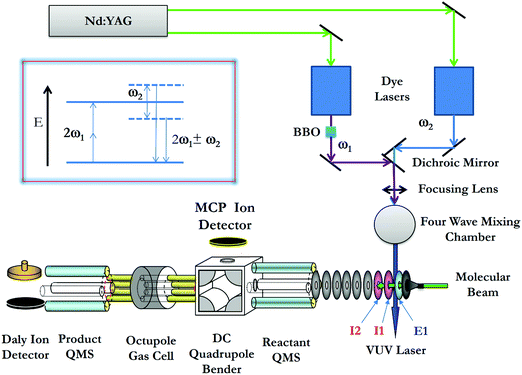 | ||
| Fig. 2 Schematic diagram showing the arrangement of the VUV laser and PFI-PI-DQDO apparatus. Ion lenses E1, I1, and I2 are important elements of the ion source, which are marked in the figure. | ||
The VUV laser radiation was generated by resonance-enhanced four-wave sum-frequency (2ω1 + ω2) mixing (as shown in the inset of Fig. 2) using Kr gas in the form of a free jet as the nonlinear medium. The fundamental ω1 and ω2 frequencies were generated by two independently tunable dye lasers (Sirah Cobra Stretch), which were pumped by an identical Nd:YAG laser (Quanta Ray PRO-290, 30 Hz) at the third harmonic output (355 nm). The ω1 output was fixed at 47046.43 cm−1, where 2ω1 matches the 5p ← 4p resonance transition of Kr at 94092.85 cm−1. An autotracker with a BBO crystal and beam path compensator was used to scan ω2 in the range of 33![[thin space (1/6-em)]](https://www.rsc.org/images/entities/char_2009.gif) 749–36
749–36![[thin space (1/6-em)]](https://www.rsc.org/images/entities/char_2009.gif) 697 cm−1 to generate the VUV (2ω1 + ω2) range (129
697 cm−1 to generate the VUV (2ω1 + ω2) range (129![[thin space (1/6-em)]](https://www.rsc.org/images/entities/char_2009.gif) 750–132
750–132![[thin space (1/6-em)]](https://www.rsc.org/images/entities/char_2009.gif) 366 cm−1) required for the present experiment. The outputs of the two dye lasers, ω1 and ω2, were merged by a dichroic mirror before intersecting with a Kr gas jet in the four-wave mixing chamber. In this experiment, the sum-frequency (2ω1 + ω2) along with the ω1, ω2, (2ω1 − ω2), and 3ω1 frequencies, entered the photoionization/photoexcitation (PI/PEX) region without passing through any windows or dispersive devices. As shown below, the analysis of the VUV laser PFI-PI spectra for O2+(a4Πu5/2,3/2,1/2,−1/2: v+ = 0–2) and O2+(X2Πg3/2,1/2: v+ = 21–23) obtained here shows no background contributions from the unwanted laser frequencies.
366 cm−1) required for the present experiment. The outputs of the two dye lasers, ω1 and ω2, were merged by a dichroic mirror before intersecting with a Kr gas jet in the four-wave mixing chamber. In this experiment, the sum-frequency (2ω1 + ω2) along with the ω1, ω2, (2ω1 − ω2), and 3ω1 frequencies, entered the photoionization/photoexcitation (PI/PEX) region without passing through any windows or dispersive devices. As shown below, the analysis of the VUV laser PFI-PI spectra for O2+(a4Πu5/2,3/2,1/2,−1/2: v+ = 0–2) and O2+(X2Πg3/2,1/2: v+ = 21–23) obtained here shows no background contributions from the unwanted laser frequencies.
The precursor O2 molecules were introduced into the beam source chamber as a pulsed molecular beam by supersonic expansion through a pulsed valve (operated at 30 Hz) at a stagnation pressure of 35 psi. The O2 beam traveled along the central axis of the ion lenses of the ion source. After passing through two conical skimmers, the O2 beam intersected the VUV laser perpendicularly at the PI/PEX center, resulting in excited O2 molecules in high-n Rydberg states [O2*(n)], along with the production of O2+ prompt ions by direct photoionization. The most essential elements of the ion source are ion lenses E1, I1, and I2 as marked in Fig. 2. The PI/PEX region is defined by the spacing between lenses E1 and I1, and was maintained field free during VUV laser excitation. After a delay of 100 ns relative to the VUV laser pulse, prompt ions were retarded by a pulsed electric field (2.3 V cm−1, duration = 2.2 μs) applied to lens I1, such that prompt ions were forced to travel in the opposite direction of the O2 molecular beam. Immediately at the end of the retarding pulsed field, a second pulsed electric field (14.4 V cm−1, duration = 0.76 μs) was applied to lens E1 to field ionize the O2*(n) species as well as extract the PFI-PIs thus formed out of the ion source. The duration of the second pulsed electric field was set so that all the O2+ PFI-PIs gained the same momentum from the PFI pulsed field before they exited the PI/PEX region. As a result, O2+ PFI-PIs retain the same high kinetic energy resolution or laboratory kinetic energy spread (ΔEcm) of the O2 beam achieved in the supersonic expansion.
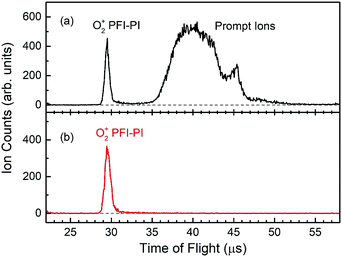
Fig. 3(a) shows a typical TOF spectrum for O2+ ions formed in the ion source recorded using the microchannel-plate (MCP) ion detector associated with the dc quadrupole ion bender. As expected, the O2+ PFI-PI peak appeared as a fast, narrow TOF peak at 29.5 μs, and the prompt ion peak appeared as a broad TOF structure at >35 μs, indicating that the prompt ions have lower kinetic energies compared to those for the PFI-PIs. Thus, by applying an appropriate dc retarding voltage at ion lens I2 situated between the PFI-PI ion source and the reactant quadrupole mass spectrometer (QMS), we can reject all prompt ions, but transmit all PFI-PIs to the MCP ion detector. Such a scenario is shown by the TOF spectrum of Fig. 3(b), showing only the O2+ PFI-PI peak at 29.5 μs. Here, all other ion lenses along with the reactant QMS were used to optimize the transmission of O2+ PFI-PIs into the rf-octopole ion-guide reaction gas cell, where the charge transfer collision with Ar occurred.
The Elab of reactant O2+ PFI-PIs is measured with respect to the rf-octopole reaction gas cell, and thus is determined by the retarding potential method, which involves the measurement of the O2+ PFI-PI intensity as a function of dc voltage applied to the rf-octopole ion guide. As an example, we show in Fig. 4 the retarding potential energy curve for the reactant O2+ PFI-PI beam with Elab = 1.20 ± 0.05 eV, which was determined by the steep drop identified with an error limit of 0.05 eV (FWHM).
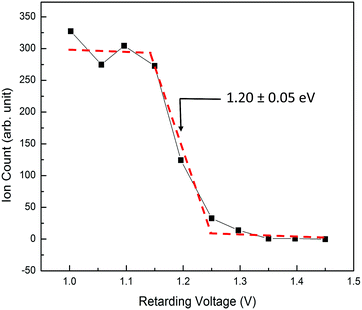 | ||
| Fig. 4 A typical retarding potential energy curve for reactant O2+ PFI-PIs at Elab = 1.20 ± 0.05 eV measured with respect to the reaction gas cell. The red dashed curve is shown to guide the eyes. | ||
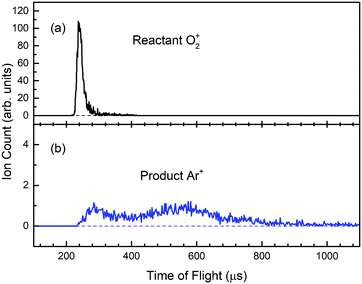
The Ar gas used in this experiment has a quoted purity of 99.999%; and the Ar pressure used in the reaction gas cell was maintained at 1.0 × 10⁻⁴ Torr as monitored by an MKS Baratron. The intensity of O2+ PFI-PIs together with product Ar+ ions formed in the reaction gas cell were guided by the rf-octopole to enter the product QMS for the measurements of O2+ and Ar+ ion intensities by using the Daly ion detector. As an example, we show in Fig. 5(a) and (b) the TOF spectra for respective O2+ PFI-PIs and charge transfer Ar+ ions formed at Elab = 0.50 eV (or Ecm = 0.28 eV), respectively. These spectra were recorded by using the product QMS and a multichannel scalar (FAST ComTec P7888). We found that the charge transfer channel is the overwhelming product channel of reactions (1) and (2) in the Ecm range of 0.05–10.0 eV. Fig. 5(a) shows that the O2+ PFI-PIs arrived at the Daly detector at ∼240 μs, whereas the product Ar+ ions arrived at the ion detector over a wide TOF range of 240–1040 μs as shown in Fig. 5(b). The product Ar+ TOF profile appears to be bimodal. This feature possibly corresponds to forward–backward scattered Ar+ ions in the center-of-mass frame. Some Ar+ ions are expected to be formed with near thermal energies in the laboratory-frame. We note that at lower Ecm, the charge-transfer Ar+ ions are often found to cover a TOF range up to 2000 μs. The reactant O2+ and product Ar+ ion counts are measured as the respective sums of ion counts covered by the TOF peaks of Fig. 5(a) and (b), respectively. Assuming that the rf-octopole ion guide allows the collection of all product Ar+ ions, the absolute integral cross sections were calculated based on the Beer–Lambert law.
As pointed out previously, the absolute integral cross sections determined here are estimated to have error limits of ≤30%. However, the error limits for relative integral cross sections of different reactant quantum states can reach the precision of 3–5%. In addition to absolute integral cross sections, we believe that the relative values for the σ[(a4Πu5/2,3/2,1/2,−1/2: v+; J+)] and σ(X2Πg3/2,1/2; v+; J+) curves obtained by plotting σ as a function of Ecm are reliable experimental measurements for benchmarking theoretical dynamics predictions.
III. Results and discussion
As pointed out above, the present quantum-state-selection study is based on VUV-PFI-PI detection. Thus, the first step of this experiment necessarily involves the measurement and assignment of the VUV-PFI-PI spectra for the ion states of interest. Although the VUV-PFI-PE spectra for O2+(a4Πu5/2,3/2,1/2,−1/2: v+; J+) and O2+(X2Πg3/2,1/2; v+; J+) with detailed simulation have been reported previously, measurements of the corresponding VUV-PFI-PI spectra have not been made. All VUV-PFI-PI spectra presented here represent the average of at least three independent scans.As expected, the PFI-PI spectra for O2+(a4Πu5/2,3/2,1/2,−1/2: v+ = 0–2; J+) and O2+(X2Πg3/2,1/2; v+ = 21–23; J+) in the VUV energy [hν(VUV)] range of 129![[thin space (1/6-em)]](https://www.rsc.org/images/entities/char_2009.gif) 750–132
750–132![[thin space (1/6-em)]](https://www.rsc.org/images/entities/char_2009.gif) 366 cm−1 are similar to those reported in previous VUV-PFI-PE studies. Some differences in rotational transition intensities observed here compared to the result of the previous synchrotron based study can be attributed to the different rotational temperatures of O2 used in the PFI-PI and PFI-PE experiments. As shown in the spectral simulation below, O2 molecules used in the form of a supersonic beam achieve a rotational temperature of 30 K, whereas O2 molecules used in the form of an effusive beam in the VUV synchrotron PFI-PE study have a rotational temperature close to room temperature at 298 K.
366 cm−1 are similar to those reported in previous VUV-PFI-PE studies. Some differences in rotational transition intensities observed here compared to the result of the previous synchrotron based study can be attributed to the different rotational temperatures of O2 used in the PFI-PI and PFI-PE experiments. As shown in the spectral simulation below, O2 molecules used in the form of a supersonic beam achieve a rotational temperature of 30 K, whereas O2 molecules used in the form of an effusive beam in the VUV synchrotron PFI-PE study have a rotational temperature close to room temperature at 298 K.
A. VUV-PFI-PI spectra and spectral simulation
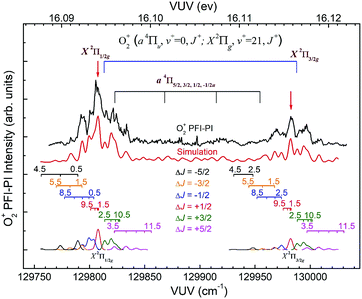
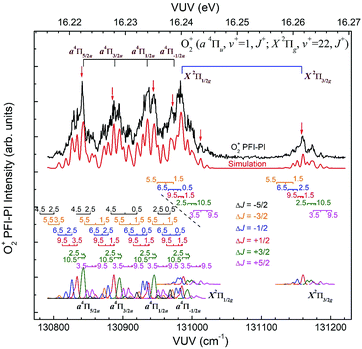
The spin–orbit and rovibronic state resolved VUV-PFI-PI spectra (top black curves) for O2+(a4Πu5/2,3/2,1/2,−1/2: v+ = 0; J+) and O2+(X2Πg3/2,1/2; v+ = 21; J+) at hν(VUV) = 129![[thin space (1/6-em)]](https://www.rsc.org/images/entities/char_2009.gif) 750–130
750–130![[thin space (1/6-em)]](https://www.rsc.org/images/entities/char_2009.gif) 025 cm−1 are depicted in Fig. 6. Based on previous VUV-PFI-PE measurements, we have assigned the two strong VUV-PFI-PI bands at the high and low energy ends of Fig. 6 as the spin–orbit bands of O2+(X2Πg3/2: v+ = 21; J+) and O2+(X2Πg1/2; v+ = 21; J+). The four spin–orbit PFI-PI bands for O2+(a4Πu5/2,3/2,1/2,−1/2: v+ = 0; J+) fall in between the O2+(X2Πg3/2,1/2; v+ = 21; J+) spin–orbit bands. The very weak PFI-PI intensities for the O2+(a4Πu5/2,3/2,1/2,−1/2: v+ = 0; J+) bands compared to that for the O2+(X2Πg3/2,1/2: v+ = 21; J+) bands observed are consistent with previous VUV-PFI-PE measurements. This PFI-PI measurement indicates that the PFI-PI intensities for O2+(a4Πu5/2,3/2,1/2,−1/2: v+ = 0; J+) are likely too low for an ion–molecule collision study.
025 cm−1 are depicted in Fig. 6. Based on previous VUV-PFI-PE measurements, we have assigned the two strong VUV-PFI-PI bands at the high and low energy ends of Fig. 6 as the spin–orbit bands of O2+(X2Πg3/2: v+ = 21; J+) and O2+(X2Πg1/2; v+ = 21; J+). The four spin–orbit PFI-PI bands for O2+(a4Πu5/2,3/2,1/2,−1/2: v+ = 0; J+) fall in between the O2+(X2Πg3/2,1/2; v+ = 21; J+) spin–orbit bands. The very weak PFI-PI intensities for the O2+(a4Πu5/2,3/2,1/2,−1/2: v+ = 0; J+) bands compared to that for the O2+(X2Πg3/2,1/2: v+ = 21; J+) bands observed are consistent with previous VUV-PFI-PE measurements. This PFI-PI measurement indicates that the PFI-PI intensities for O2+(a4Πu5/2,3/2,1/2,−1/2: v+ = 0; J+) are likely too low for an ion–molecule collision study.
The spin–orbit and rovibronic state resolved VUV-PFI-PI spectra (top black curves) for O2+(a4Πu5/2,3/2,1/2,−1/2: v+ = 1; J+) and O2+(X2Πg3/2,1/2: v+ = 22; J+) at hν(VUV) = 130![[thin space (1/6-em)]](https://www.rsc.org/images/entities/char_2009.gif) 800–131
800–131![[thin space (1/6-em)]](https://www.rsc.org/images/entities/char_2009.gif) 225 cm−1 are depicted in Fig. 7. The four spin–orbit PFI-PI bands for O2+(a4Πu5/2,3/2,1/2,−1/2: v+ = 1; J+) are discernible, and have significantly higher intensities than those for the O2+(X2Πg3/2,1/2: v+ = 22; J+) bands. While the O2+(X2Πg3/2: v+ = 22; J+) band is well separated from other bands, the O2+(X2Πg1/2: v+ = 22; J+) band is in strong overlap with the O2+(a4Πu−1/2: v+ = 1; J+) band.
225 cm−1 are depicted in Fig. 7. The four spin–orbit PFI-PI bands for O2+(a4Πu5/2,3/2,1/2,−1/2: v+ = 1; J+) are discernible, and have significantly higher intensities than those for the O2+(X2Πg3/2,1/2: v+ = 22; J+) bands. While the O2+(X2Πg3/2: v+ = 22; J+) band is well separated from other bands, the O2+(X2Πg1/2: v+ = 22; J+) band is in strong overlap with the O2+(a4Πu−1/2: v+ = 1; J+) band.
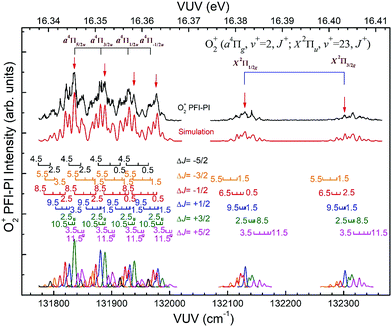
Fig. 8 depicts the spin–orbit resolved VUV-PFI-PI spectra (top black curves) for O2+(a4Πu5/2,3/2,1/2,−1/2: v+ = 2; J+) and O2+(X2Πg3/2,1/2: v+ = 23; J+) bands at hν(VUV) = 131![[thin space (1/6-em)]](https://www.rsc.org/images/entities/char_2009.gif) 775–132
775–132![[thin space (1/6-em)]](https://www.rsc.org/images/entities/char_2009.gif) 366 cm−1. All PFI-PI spectra for these spin–orbit bands are well resolved. The intensities for the O2+(a4Πu5/2,3/2,1/2,−1/2: v+ = 2; J+) bands are found to be higher than those for the O2+(X2Πg3/2,1/2: v+ = 23; J+) bands. This observation is also consistent with the previous VUV synchrotron PFI-PE measurement.
366 cm−1. All PFI-PI spectra for these spin–orbit bands are well resolved. The intensities for the O2+(a4Πu5/2,3/2,1/2,−1/2: v+ = 2; J+) bands are found to be higher than those for the O2+(X2Πg3/2,1/2: v+ = 23; J+) bands. This observation is also consistent with the previous VUV synchrotron PFI-PE measurement.
In order to assign overlapping rotational and spin–orbit transitions of the O2+(a4Πu5/2,3/2,1/2,−1/2: v+ = 0–2; J+) and O2+(X2Πg3/2,1/2: v+ = 21–23; J+) bands, it is necessary to perform spectral simulations. The ground O2+(X2Πg) state is formed by the removal of an electron from the anti-bonding 1πg orbital, whereas the O2+(a4Πu) state resulted from the ejection of one electron from the bonding 1πu orbital. The spin–orbit interaction, i.e., the coupling between Λ and Σ, gives rise to four spin–orbit components F1(4Π5/2), F2(4Π3/2), F3(4Π1/2), and F4(4Π−1/2) for the O2+(a4ΠuΩ) state, where the quantum number Ω = Λ + Σ = 5/2, 3/2, 1/2, and −1/2. Similarly, the O2+(X2Πg) state splits into two spin–orbit components: 2Πg1/2 and 2Πg3/2. The interaction of spin–orbit components can be expressed as ΔEso = AΛΣ, where A is the spin–orbit coupling constant, and Λ and Σ are the projection of electronic orbital angular momentum (L) and electron spin angular momentum (S), respectively, along the molecular axis.
The electronic energies of spin–orbit states can be expressed as Te = T0 + ΔESO + T0 + AΛΣ. The energy of O2(X3Σg+: v′′ = 0; N′′) can be expressed by eqn (3):
| E(X,v′′ = 0,N′′) = 1/2ωe′′ − 1/4ωe′′χe′′ + B0′′N′′(N′′ + 1). | (3) |
| E+(a,v+,N+) = Te+ + ωe+(v+ + 1/2) − ωe+χe+ + (v+ + 1/2)2 + B+[N+(N+ + 1) − v+Ω2] + AΛΣ. | (4) |
| ΔE = E+(a,v+,N+) − E(X,v′′ = 0,N′′) = T0v+ + B+[N+(N+ + 1) − v+Ω2] + AΛΣ − B0′′N′′(N′′ + 1). | (5) |
For the O2+(a4Πu5/2,3/2,1/2,−1/2) states, the spin–orbit splitting of individual components are given in eqn (6a)–(6d).
| 4Π5/2, ΔEso = (3/2) A, Λ = 1, Σ = 3/2, | (6a) |
| 4Π3/2, ΔEso = (1/2) A, Λ = 1, Σ = 1/2, | (6b) |
| 4Π1/2, ΔEso = (−1/2) A, Λ = 1, Σ = −1/2, | (6c) |
| 4Π−1/2, ΔEso = (−3/2) A, Λ = 1, Σ = −3/2. | (6d) |
| 2Π3/2, ΔEso = (1/2) A, Λ = 1, Σ = 1/2, | (7a) |
| 2Π1/2, ΔEso = (−1/2) A, Λ = 1, Σ = −1/2. | (7b) |
The spectral simulation of the VUV-PFI-PI spectra assume a Gaussian instrumental transition line profile with a FWHM = 4.0 cm−1. We also assume that the N′′ (odd) rotational populations for the O2(X3Σg+: v′′ = 0) ground state are governed by the Boltzmann rotational temperature achieved in the O2 pulsed supersonic expansion. In previous rotational resolved PFI-PE studies of diatomic and small molecular ions, the intensities for rotational transitions are found to fall in a pattern that favors the smaller |ΔJ| (= |J+ − J′′|) value.49–52 That is, the most intense rotational transition usually has the smallest |ΔJ| value, and the intensity for rotational transition decreases as |ΔJ| increases. The maximum |ΔJ| value identified can be in the range of 5–10. Furthermore, the ΔJ < 0 transitions are often found to be more intense than the ΔJ > 0 transitions. The present simulation assumes that the ΔJ transitions have an intensity profile as described above; and fine adjustment of the simulated intensities for individual ΔJ transitions were made to give the best fit to the PFI-PI spectra.
Since the spacing between adjacent rotational lines is generally 0.1–0.2 cm−1, the present experiment was not able to fully resolve individual rotational transitions. The simulation of the VUV-PFI-PI spectra identified six ΔJ-branches, i.e., ΔJ = +5/2, +3/2, +1/2, −1/2, −3/2, and −5/2, which are marked by bars with downward or upward pointing strikes in Fig. 6–8. The individual simulated ΔJ-branch transition spectra are shown at the bottom of these figures. The markings of ΔJ-branch transitions in these figures are color coded in pink, green, red, blue, yellow, and black, for the ΔJ = +5/2, +3/2, +1/2, −1/2, −3/2, and −5/2 branches, respectively. The sums of the simulated ΔJ-transition spectra give the overall simulated spectra (red curves) shown below the PFI-PI spectra (top black curves) in Fig. 6–8. The PFI-PI spectra exhibit quite complicated rotational structures due to the high multiplicity of the O2+(a4Πu) and O2+(X2Πg) states. The numbers above the ΔJ branch transition markings are the J+ quantum numbers of O2+ ions, which are defined as J+ = N+ + Ω+. Since the rotational transitions of nearby spin–orbit components have some overlap, the simulation is necessary for determining the purities of selected rovibronic states; and ensuring the PFI-PI transition peaks selected have no spectral overlaps between adjacent spin–orbit components.
In the VUV-PFI-PI spectra of O2+(a4Πu: v+ = 0) and O2+(X2Πg: v+ = 21) shown in Fig. 6, the four spin–orbit components O2+(a4Πu5/2,3/2,1/2,−1/2: v+ = 0) fall in between the two spin–orbit components O2+(X2Πg3/2,1/2: ν+ = 21). As pointed out above, due to very small FCFs for the formation of the O2+(a4Πu: v+ = 0) state from the O2(X3Σg+) ground state,53 the VUV-PFI-PI intensities for O2+(a4Πu: v+ = 0) are too weak for ion-neutral collision studies. Thus, we have not devoted much effort for a detailed simulation of the VUV-PFI-PI spectrum for O2+(a4Πu: v+ = 0).
Nonetheless, the O2+(X2Πg3/2,1/2: v+ = 21) VUV-PFI-PI spectra have been successfully analyzed with satisfactory rotational assignments as marked in Fig. 6. Based on the spectral simulation of the VUV-PFI-PI spectra for O2+(a4Πu, v+ = 0) and O2+(X2Πg, v+ = 21), we have identified two PFI-PI peaks at hν (VUV) = 129807.6 and 129982.4 cm−1 (marked by downward pointing red arrows in Fig. 6 and listed in Table 1) for the spin–orbit state selections of O2+(X2Πg1/2: v+ = 21) and O2+(X2Πg3/2: v+ = 21), respectively. The spin–orbit components thus prepared consist of the three J+ = 1.5, 3.5, and 5.5 states (as listed in Table 1) with the J+ = 5.5 state (highlighted in red) predicted to have the highest population.
| Spin–orbit and vibronic O2+ states | Ω + | J + | hν(VUV) (cm−1) |
|---|---|---|---|
| X2Πg, v+ = 21 | 1/2 | 1.5, 3.5, 5.5 | 129807.6 |
| 3/2 | 1.5, 3.5, 5.5 | 129982.4 | |
| X2Πg, v+ = 22 | 1/2 | 5.5 | 131012.3 |
| 3/2 | 1.5, 3.5, 5.5 | 131158.3 | |
| a4Πu, v+ = 1 | 5/2 | 2.5, 4.5 | 130840.7 |
| 3/2 | 1.5, 3.5 | 130885.0 | |
| 1/2 | 2.5, 4.5 | 130943.5 | |
| −1/2 | 1.5 | 130971.8 | |
| X2Πg, v+ = 23 | 1/2 | 1.5, 3.5 | 132129.8 |
| 3/2 | 1.5, 3.5 | 132301.6 | |
| a4Πu, v+ = 2 | 5/2 | 2.5, 4.5, 6.5 | 131835.4 |
| 3/2 | 2.5, 4.5, 6.5 | 131888.2 | |
| 1/2 | 2.5, 4.5, 6.5 | 131939.4 | |
| −1/2 | 0.5, 1.5, 3.5 | 131979.6 | |
B. Spin–orbit state selected integral charge transfer cross sections
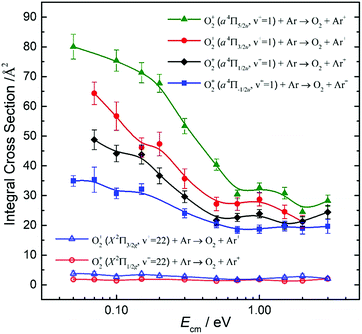
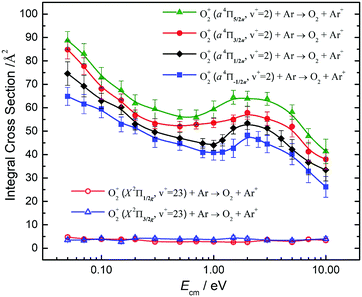
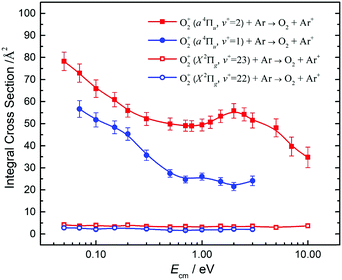
By tuning the VUV laser to selected PFI-PI peaks as marked by the downward pointing red arrows in Fig. 7 and 8, we can prepare reactant O2+ ions in single spin–orbit states of O2+(a4ΠuΩ: v+ = 1 and 2) and O2+(X2ΠgΩ: ν+ = 22 and 23) for the ion–molecule collision study with Ar. The selection of these PFI-PI peaks with high spin–orbit purities and high intensities were guided by spectral simulation of the VUV-PFI-PI spectra as described above. The hν(VUV) values of twelve selected PFI-PI peaks, together with their spectroscopic assignments are given in Table 1. Six of the PFI-PI peaks selected at hν(VUV) = 131012.3, 131158.3, 130840.7, 130885.0, 130943.5, and 130971.8 cm−1 are assigned as the spin–orbit states: O2+(X2Πg1/2: v+ = 22), O2+(X2Πg3/2: v+ = 22), O2+(a4Πu5/2: v+ = 1), O2+(a4Πu3/2: v+ = 1), O2+(a4Πu1/2: v+ = 1), and O2+(a4Πu−1/2: v+ = 1), respectively. The other six PFI-PI peaks situated at hν(VUV) = 132129.8, 132301.6, 131835.4, 131888.2, 131939.4, and 131979.6 cm−1 are associated with the formation of their respective spin–orbit states: O2+(X2Πg1/2: ν+ = 23), O2+(X2Πg3/2: ν+ = 23), O2+(a4Πu5/2: ν+ = 2), O2+(a4Πu5/2: ν+ = 2), O2+(a4Πu5/2: ν+ = 2), and O2+(a4Πu5/2: ν+ = 2). The spectral simulations show that these PFI-PI peaks for the assigned spin–orbit states consist of contributions from one to three low J+ states with values ≤6.5. The J+ states highlighted in red are predicted to have the major populations.The primary goal of this experiment is to measure and compare the σ values with reactant O2+ ions prepared in two distinct vibronic states, i.e., O2+(a4Πu: v+ = 1) and O2+(X2Πg: v+ = 22) as well as O2+(a4Πu: v+ = 2) and O2+(X2Πg: ν+ = 23), which are in near energy resonance with energy separations in the range of 200–300 cm−1. A comparison of σ(a4Πu5/2,3/2,1/2,−1/2: v+ = 1) with σ(X2Πg3/2,1/2: v+ = 22) is shown in Fig. 9, and that of σ(a4Πu5/2,3/2,1/2,−1/2: v+ = 2) with σ(X2Πg3/2,1/2: v+ = 23) is given in Fig. 10. Both comparisons reveal that O2+ ions in the a4Πu state are overwhelmingly more reactive toward Ar via charge transfer than in the X2Πg state. The high σ(a4Πu5/2,3/2,1/2,−1/2: v+ = 1, 2), and their increasing trend with decreasing Ecm are indicative of the involvement of a long range charge transfer mechanism.35,36
As shown in Fig. 9, the σ(a4Πu: v+ = 1) values obtained in the Ecm range of 0.05–3.00 eV reveal that the σ(a4Πu) depends strongly on the spin–orbit state with the order: σ(a4Πu5/2: v+ = 1) > σ(a4Πu3/2: v+ = 1) > σ(a4Πu1/2: v+ = 1) > σ(a4Πu−1/2: v+ = 1). The σ(a4Πu5/2,3/2,1/2,−1/2: v+ = 1) values were found to decrease rapidly from thermal (0.05 eV) to Ecm ≈ 0.70 eV and level off at Ecm = 0.70–3.00 eV. The σ(a4Πu5/2: v+ = 1) value is higher than the σ(a4Πu−/2: v+ = 1) value by a factor of 1.5–2.2 in the Ecm = 0.05–3.00 eV range. Interestingly, the σ(X2Πg3/2,1/2: v+ = 22) values obtained at Ecm = 0.05–3.00 eV were found to be essentially independent of Ecm. This observation, together with the low σ(X2Πg3/2,1/2: v+ = 22) values observed, indicates that the formation of Ar+ from the charge transfer collision of O2+(X2Πg3/2,1/2: v+ = 22) + Ar is unlikely to result from a long-range electron jump mechanism. Instead, a short-range collision pathway must be involved in the latter reaction. It appears that σ(X2Πg3/2: v+ = 22) is slightly larger than σ(X2Πg1/2: v+ = 22).
Fig. 10 compares the σ(a4Πu5/2,3/2,1/2,−1/2: v+ = 2) and the σ(X2Πg3/2,1/2: v+ = 23) obtained at Ecm = 0.05–10.00 eV. The σ(a4Πu5/2,3/2,1/2,−1/2: v+ = 2) curves at Ecm = 0.05–1.00 eV are found to be high and have an Ecm dependence similar to the σ(a4Πu5/2,3/2,1/2,−1/2: v+ = 1) of Fig. 9. The σ(a4Πu5/2,3/2,1/2,−1/2: v+ = 1) curves exhibit a broad hump peaked at Ecm ≈ 2.0 eV. At Ecm > 4.0 eV, the σ(a4Πu5/2,3/2,1/2,−1/2: v+ = 2) curves were found to drop rapidly with increasing Ecm. The nature of this hump is not known, and would require theoretical interpretation. The spin–orbit state dependences for σ(a4Πu5/2,3/2,1/2,−1/2: v+ = 2) observed are also similar to those for σ(a4Πu5/2,3/2,1/2,−1/2: v+ = 1), i.e., σ(a4Πu5/2: v+ = 2) > σ(a4Πu3/2: v+ = 2) > σ(a4Πu1/2: v+ = 2) > σ(a4Πu−1/2: v+ = 2) for the full Ecm range of 0.05–10.00 eV. The difference between adjacent σ(a4Πu5/2,3/2,1/2,−1/2: v+ = 2) curves is ≈10%. The comparison of the σ(a4Πu: v+ = 1) of Fig. 9 and the σ(a4Πu: v+ = 2) of Fig. 10 has also shown that σ(a4Πu: v+ = 2) > σ(a4Πu: v+ = 1).
The low values and the lack of Ecm dependence observed for σ(X2Πg3/2,1/2: v+ = 23) as shown in Fig. 10 are in close resemblance with that observed for the σ(X2Πg3/2,1/2: ν+ = 22) of Fig. 9. Although the O2+(X2Πg3/2,1/2: v+ = 23) states are only slightly higher (≈300 cm−1) than the O2+(a4Πu5/2,3/2,1/2,−1/2: v+ = 2) states, these states are found to have significantly different charge transfer reactivity with Ar.
Koyano and co-workers have previously reported relative values for σ(a4Πu: v+ = 0–7) and σ(a2Πg: v+ = 19, 20) at Ecm = 1.4 and 5.8 eV using the TESICO technique.17 Their results show that σ(a4Πu: v+ = 2) is significantly higher than σ(a2Πu: v+ = 1). The latter observation is in accordance with the result of the present study. Since the charge transfer collision of O2+(X2Πg: v+ = 19) + Ar is endothermic, we have not examined the reactivity of this state. We note that the TPE resolution of 30 meV (240 cm−1) used in the previous TESICO measurements cannot resolve the O2+(X2Πg: v+ > 19) states from the O2+(a4Πu: v+ = 0–7) states, as well as from different spin–orbit states of interest in the present study. In order to compare the relative integral cross sections of Koyano and co-workers17 with the spin–orbit state-selected σ(a4Πu5/2,3/2,1/2,−1/2: v+) values obtained here, we have taken the average of σ(a4Πu: v+) as 〈σ(a4Πu: v+)〉 = (1/4)[σ(a4Πu5/2: v+) + σ(a4Πu3/2: v+) + σ(a4Πu1/2: v+) + σ(a4Πu−1/2: v+)], where v+ = 1 and 2. The 〈σ(a4Πu: v+ = 1)〉 and 〈σ(a4Πu: v+ = 2)〉 curves thus obtained are shown in Fig. 11, confirming the observation of Fig. 9 and 10 that the σ(a4Πu5/2,3/2,1/2,−1/2: v+ = 2) values are significantly higher that the corresponding σ(a4Πu5/2,3/2,1/2,−1/2: v+ = 1) values. This conclusion is also in qualitative agreement with the results of the TPESICO study. We have also taken the averages 〈σ(X2Πg: ν+ = 22)〉 and 〈σ(X2Πg: v+ = 23)〉 as depicted in Fig. 11, revealing that 〈σ(X2Πg: ν+ = 23)〉 is higher than 〈σ(X2Πg: ν+ = 22)〉. Based on the HeI photoelectron study of O2, it is well known that the FCFs for the formation of O2+(a4Πu: v+ ≥ 1) are significantly greater than those for O2+(X2Πg: v+ > 20) from O2(X3Σg−).53 Koyano and co-workers first suggested that the finding of σ(a4Πu: v+ = 1) > σ(X2Πg: v+ = 22) and σ(a4Πu: ν+ = 2) > σ(X2Πg: v+ = 23), along with the fact that σ(a4Πu: v+ = 2) > σ(a4Πu: v+ = 1), can be attributed to the difference in FCFs for the formation of the O2+(a4Πu: v+) and O2+(X2Πg: v+) electronic states from the O2 ground state.
The charge-transfer reactions (1) and (2) necessarily involve the crossing of the reactant state [O2+⋯Ar] to the product state [Ar+⋯O2] along the reaction coordinate. As pointed out above, the ground O2+(X2Πg) state is formed by the removal of an electron from the anti-bonding 1πg orbital, whereas the O2+(a4Πu) state resulted from the ejection of one electron from the bonding 1πu orbital. Thus, the interaction of Ar with O2+(a4Πu) in the long range by donating an electron to the 1πu orbital from Ar is expected to be more attractive compared to the interaction of Ar with O2+(X2Πg), where the electron from Ar would be donated into the anti-bond 1πg orbital. The more favorable bonding interaction for [O2+(a4Πu)⋯Ar] could partly account for the higher σ(a4Πu: ν+ = 1 and 2) compared to the σ(X2Πg: v+ = 22 and 23). The spin–orbit interaction and vibrational excitation can alter the crossing region for the [O2+⋯Ar] and [Ar+⋯O2] states, and thus the σ values for reactions (1) and (2). The extended O–O distance for highly vibrational states O2+(X2Πg: v+ = 21–23) may not favor the curve crossing between the reactant and product charge transfer states. We hope that the extensive high-quality spin–orbit, rotational, vibrational, and electronic state-selected integral cross sections reported here will motivate state-of-the-art theoretical dynamics calculations.
IV. Conclusion and summary
We have succeeded in preparing spin–orbit and rovibronic state selected O2+(a4Πu5/2,3/2,1/2,−1/2: v+ = 0–2; J+) and O2+(X2Πg3/2,1/2: v+ = 21–23; J+) ions in the form of a pulsed beam by employing the sequential electric field VUV laser PFI-PI detection scheme. These quantum state-selected ions thus generated have a narrow ΔElab spread of 50 meV, allowing σ measurements of reactions (1) and (2) from thermal energies (50 meV) to 10 eV. Since the O2+(a4Πu5/2,3/2,1/2,−1/2: v+ = 1 and 2) and O2+(X2Πg3/2,1/2: v+ = 22 and 23) states are in close energy resonance, these reactions represent ideal model systems for investigating the energy resonance and FCF effects on charge transfer reactivity of O2+. We found that the σ(a4Πu5/2,3/2,1/2,−1/2: v+ = 1 and 2) values are overwhelmingly higher than the σ(X2Πg3/2,1/2: v+ = 22 and 23) values at Ecm = 0.05–10.00 eV, indicating that the FCFs play the dominant role in promoting these charge transfer reactions. The σ(a4Πu) was also found to depend strongly on the spin–orbit as well as the vibrational states with the order: σ(a4Πu: v+ = 2) > σ(a4Πu: v+ = 1), and σ(a4Πu5/2: v+) > σ(a4Πu3/2: v+) > σ(a4Πu1/2: v+) > σ(a4Πu−1/2: v+), where v+ = 1 and 2. While the high σ(a4Πu5/2,3/2,1/2,−1/2: v+ = 1 and 2) values along with their Ecm dependences are consistent with that for exothermic long range charge exchange processes, the low σ(X2Πg3/2,1/2: v+ = 22 and 23) and the lack of Ecm dependence observed in the full Ecm range of 0.05–10.00 eV point to the involvement of short-range collision dynamics. The spin–orbit state and Ecm dependences for σ(a4Πu5/2,3/2,1/2,−1/2: v+) were not observed previously. The quantum-state-selected σ values presented here require the interpretation of rigorous theoretical calculations.Conflicts of interest
There are no conflicts to declare.Acknowledgements
This material is based upon work supported by the National Science Foundation under grant CHE-1462172 and CHE-1642172. C. Y. N. is also grateful to Dr Huie Tarng Liou for his generous donation of research support for the Ng Laboratory.References
- C. Y. Ng, State-Selected and State-to-State Ion-Molecule Reaction Dynamics by Photoionization and Differential Reactivity Methods, in State-Selected and State-to-State Ion-Molecule Reaction Dynamics, Part 1: Experiment, ed. C. Y. Ng and M. Baer, John Wiley & Sons, New York, 1992, vol. 82, pp. 401–500 Search PubMed.
- E. E. Ferguson, Ion–Molecule Reactions, Annu. Rev. Phys. Chem., 1975, 26, 17–38 CrossRef CAS.
- P. B. Armentrout, Fundamentals of ion–molecule chemistry, J. Anal. At. Spectrom., 2004, 19, 571–580 RSC.
- J. Meyer and R. Wester, Ion–Molecule Reaction Dynamics, Annu. Rev. Phys. Chem., 2017, 68, 333–353 CrossRef CAS PubMed.
- C. Y. Ng, Vacuum ultraviolet photoionization and photoelectron studies in the new millennium: recent developments and applications, Int. J. Mass Spectrom., 2000, 200, 357–386 CrossRef CAS.
- C. Y. Ng, Two-color photoionization and photoelectron studies by combining infrared and vacuum ultraviolet, J. Electron Spectrosc. Relat. Phenom., 2005, 142, 179–192 CrossRef CAS.
- C.-Y. Ng, State-to-State Spectroscopy and Dynamics of Ions and Neutrals by Photoionization and Photoelectron Methods, Annu. Rev. Phys. Chem., 2014, 65, 197–224 CrossRef CAS PubMed.
- C. Y. Ng, Vacuum ultraviolet spectroscopy and chemistry by photoionization and photoelectron methods, Annu. Rev. Phys. Chem., 2002, 53, 101–140 CrossRef CAS PubMed.
- J. Berkowitz, Photoabsorption, Photoionization, and Photoelectron Spectroscopy, Academic Press, New York, 1979 Search PubMed.
- W. A. Chupka, Photoionization of molecular Rydberg states: H2, C1Πu and its doubly excited states, J. Chem. Phys., 1987, 87, 1488–1498 CrossRef CAS.
- F. Merkt, Molecules in high Rydberg states, Annu. Rev. Phys. Chem., 1997, 48, 675–709 CrossRef CAS PubMed.
- Y. Wang and W. A. Chupka, Prescription for preparation of molecular ions in selected rotational states, Chem. Phys. Lett., 1992, 200, 192–198 CrossRef CAS.
- L. C. Zhu and P. Johnson, Mass Analyzed Threshold Ionization Spectroscopy, J. Chem. Phys., 1991, 94, 5769–5771 CrossRef CAS.
- C. Y. Ng, Advances in photoionization and photoelectron studies using third generation synchrotron radiation, J. Electron Spectrosc. Relat. Phenom., 2000, 108, 41–45 CrossRef CAS.
- C. Y. Ng, Advances in Photoionization and Photoelectron Studies Using Third Generation Synchrtron Radiation and UV/VUV Lasers, in Photoionization and Photodetachment, ed. C. Y. Ng, World Scientific, Singapore, 2000, vol. 10, pp. 394–538 Search PubMed.
- C. Y. Ng, High-resolution pulsed-field ionization photoelectron–photoion coincidence spectroscopy: determination of accurate bond dissociation energies for neutrals and cations, J. Electron Spectrosc. Relat. Phenom., 2000, 112, 31–46 CrossRef CAS.
- I. Koyano and K. Tanaka, State-Selected Charge Transfer and Chemical Reactions by the TESICO Technique, in State-Selected and State-to-State Ion-Molecule Reaction Dynamics, Part 1. Experiment, ed. M. Baer and C. Y. Ng, John Wiley & Sons, Inc., New York, 1992, vol. 82, ch. 4, pp. 263–307 Search PubMed.
- T. Kato, State selected charge transfer reactions in the BC+ + Ar ⇄ BC + Ar+ systems: Comparison among BC = H2, O2, and NO, J. Chem. Phys., 1984, 80, 6105–6113 CrossRef CAS.
- C.-W. Hsu, M. Evans, C. Y. Ng and P. Heimann, High resolution threshold and pulsed field ionization photoelectron spectroscopy using multi-bunch synchrotron radiation, Rev. Sci. Instrum., 1997, 68, 1694–1702 CrossRef CAS.
- C.-W. Hsu, M. Evans, S. Stimson, C. Y. Ng and P. Heimann, High-resolution photoelectron spectroscopy using multibunch synchrotron radiation: rotational-resolved photoelectron bands of O2+(b4Σg−, v+), Chem. Phys., 1998, 231, 121–143 CrossRef CAS.
- G. K. Jarvis, K.-M. Weitzel, M. Malow, T. Baer, Y. Song and C. Y. Ng, High-resolution pulsed field ionization photoelectron-photoion coincidence spectroscopy using synchrotron radiation, Rev. Sci. Instrum., 1999, 70, 3892–3906 CrossRef CAS.
- X. M. Qian, T. Zhang, C. Chang, P. Wang, C. Y. Ng, Y. H. Chiu, D. J. Levandier, J. S. Miller, R. A. Dressler, T. Baer and D. S. Peterka, High-resolution state-selected ion-molecule reaction studies using pulsed field ionization photoelectron-secondary ion coincidence method, Rev. Sci. Instrum., 2003, 74, 4096–4109 CrossRef CAS.
- X. N. Tang, H. Xu, T. Zhang, Y. Hou, C. Chang, C. Y. Ng, Y. H. Chiu, R. A. Dressler and D. J. Levandier, A pulsed-field ionization photoelectron secondary ion coincidence study of the H2+(X, v+ = 0–15, N+ = 1) + He proton transfer reaction, J. Chem. Phys., 2005, 122, 164301 CrossRef CAS PubMed.
- X. N. Tang, C. Houchins, H. F. Xu, C. Y. Ng, Y. Chiu, R. A. Dressler and D. J. Levandier, An experimental and quasiclassical trajectory study of the rovibrationally state-selected reactions: HD+(v = 0–15, j = 1) + He → HeH+(HeD+) + D(H), J. Chem. Phys., 2007, 126, 234305 CrossRef CAS PubMed.
- T. Zhang, X. M. Qian, X. N. Tang, C. Y. Ng, Y. Chiu, D. J. Levandier, J. S. Miller and R. A. Dressler, A state-selected study of the H2+(X,v+ = 0–17, N+ = 1) + Ne proton transfer reaction using the pulsed-field ionization–photoelectron–secondary ion coincidence scheme, J. Chem. Phys., 2003, 119, 10175–10185 CrossRef CAS.
- X.-M. Qian, T. Zhang, Y.-H. Chiu, D. J. Levandier, J. S. Miller, R. A. Dressler and C. Y. Ng, Rovibrational state-selected study of H2+(X, ν+ = 0–17, N+ = 1) + Ar using the pulsed field ionization-photoelectron-secondary ion coincidence scheme, J. Chem. Phys., 2003, 118, 2455–2458 CrossRef CAS.
- Y. Xu, B. Xiong, Y. C. Chang and C. Y. Ng, Communication: Rovibrationally selected absolute total cross sections for the reaction H2O+(X2B1: v1+v2+v3+ = 000; NKa+Kc++) + D2: observation of the rotational enhancement effect, J. Chem. Phys., 2012, 137, 241101 CrossRef PubMed.
- Y. Xu, B. Xiong, Y. C. Chang and C. Y. Ng, The translational, rotational, and vibrational energy effects on the chemical reactivity of water cation H2O+(X2B1) in the collision with deuterium molecule D2, J. Chem. Phys., 2013, 139, 024203 CrossRef PubMed.
- A. Li, Y. Li, H. Guo, K. C. Lau, Y. Xu, B. Xiong, Y. C. Chang and C. Y. Ng, Communication: the origin of rotational enhancement effect for the reaction of H2O+ + H2(D2), J. Chem. Phys., 2014, 140, 011102 CrossRef PubMed.
- H. Song, A. Li, H. Guo, Y. Xu, B. Xiong, Y.-C. Chang and C. Y. Ng, Comparison of experimental and theoretical quantum-state-selected integral cross-sections for the H2O+ + H2(D2) reactions in the collision energy range of 0.04–10.00 eV, Phys. Chem. Chem. Phys., 2016, 18, 22509–22515 RSC.
- Y. Xu, B. Xiong, Y. C. Chang and C. Y. Ng, Isotopic and quantum-rovibrational-state effects for the ion-molecule reaction H2O+(X2B1: v1+v2+v3+; NKa+Kc++) + HD in the collision energy range of 0.03–10.00 eV, Phys. Chem. Chem. Phys., 2017, 19, 8694–8705 RSC.
- Y. Xu, B. Xiong, Y.-C. Chang, Y. Pan, P. K. Lo, K. C. Lau and C. Y. Ng, A quantum-rovibrational-state-selected study of the reaction H2O+(X2B1: v1+v2+v3+; NKa+Kc++) + CO in the collision energy range of 0.05–10.00 eV: translational, rotational, and vibrational energy effects, Phys. Chem. Chem. Phys., 2017, 19, 9778–9789 RSC.
- Y. C. Chang, H. Xu, Y. Xu, Z. Lu, Y. H. Chiu, D. J. Levandier and C. Y. Ng, Communication: rovibrationally selected study of the N2+(X; v+ = 1, N+ = 0–8) + Ar charge transfer reaction using the vacuum ultraviolet laser pulsed field ionization-photoion method, J. Chem. Phys., 2011, 134, 201105 CrossRef PubMed.
- Y. C. Chang, Y. Xu, Z. Lu, H. Xu and C. Y. Ng, Rovibrationally selected ion-molecule collision study using the molecular beam vacuum ultraviolet laser pulsed field ionization-photoion method: charge transfer reaction of N2+(X2Σg+; v+ = 0–2; N+ = 0–9) + Ar, J. Chem. Phys., 2012, 137, 104202 CrossRef PubMed.
- Y. Xu, Y. C. Chang, Z. Lu and C. Y. Ng, Absolute Integral Cross Sections and Product Branching Ratios for the Vibrationally Selected Ion–Molecule Reactions: N2+(X2Σg+; v+ = 0–2) + CH4, Astrophys. J., 2013, 769, 72 CrossRef.
- Y. Xu, B. Xiong, Y. C. Chang and C. Y. Ng, Absolute Integral Cross Sections for the State-selected Ion–molecule Reaction N2+ (X2Σg+; v+ = 0–2) + C2H2 in the Collision Energy Range of 0.03–10.00 eV, Astrophys. J., 2016, 827, 17 CrossRef.
- B. Xiong, Y.-C. Chang and C.-Y. Ng, A quantum-rovibrational-state-selected study of the proton-transfer reaction H2+(X2Σg+: v+ = 1–3; N+ = 0–3) + Ne → NeH+ + H using the pulsed field ionization-photoion method: observation of the rotational effect near the reaction threshold, Phys. Chem. Chem. Phys., 2017, 19, 18619 RSC.
- Y. Song, M. Evans, C. Y. Ng, C. W. Hsu and G. K. Jarvis, Rotationally resolved pulsed field ionization photoelectron bands of O2+(X
![[thin space (1/6-em)]](https://www.rsc.org/images/entities/char_2009.gif) 2Π1/2,3/2g, v+ = 0–38) in the energy range of 12.05–18.15 eV, J. Chem. Phys., 1999, 111, 1905–1916 CrossRef CAS.
2Π1/2,3/2g, v+ = 0–38) in the energy range of 12.05–18.15 eV, J. Chem. Phys., 1999, 111, 1905–1916 CrossRef CAS. - Y. Song, M. Evans, C. Y. Ng, C. W. Hsu and G. K. Jarvis, Rotationally resolved pulsed field ionization photoelectron bands for O2+(a4Πu, v+ = 0–18) in the energy range of 16.0–18.0 eV, J. Chem. Phys., 2000, 112, 1306–1315 CrossRef CAS.
- W. Lindinger, D. L. Albritton, M. McFarland, F. C. Fehsenfeld, A. L. Schmeltekopf and E. E. Ferguson, Rate constants for the reactions of O2+(a4Πu) ions with N2, Ar, CO, CO2, H2, and O2 at relative kinetic energies 0.04–2 eV, J. Chem. Phys., 1975, 62, 4101–4110 CrossRef CAS.
- D. W. Vance, Auger Electron Emission from Clean Mo Bombarded by Positive Ions. III. Effect of Electronically Excited Ions, Phys. Rev., 1968, 169, 263–272 CrossRef CAS.
- A. Tabché-fouhaillé, J. Durup, J. T. Moseley, J.-B. Ozenne, C. Pernot and M. Tadjeddine, Laser photofragment spectroscopy of O2+: ã4Πu → 4Πg, Chem. Phys., 1976, 17, 81–89 CrossRef.
- G. D. Flesch and C. Y. Ng, Observation of the formation of N+ and ArN+ in the collisions of Ar+(2P3/2,1/2) with N2, J. Chem. Phys., 1990, 92, 2876–2882 CrossRef CAS.
- K. Tanaka, T. Kato and I. Koyano, State selected ion–molecule reactions by a TESICO technique. III. H2+(v) + Ar → ArH+ + H, Ar+ + H2: observation of enhanced charge-transfer cross sections at near resonance, J. Chem. Phys., 1981, 75, 4941–4945 CrossRef CAS.
- D. Rapp and W. E. Francis, Charge Exchange between Gaseous Ions and Atoms, J. Chem. Phys., 1962, 37, 2631–2645 CrossRef CAS.
- W. Kong and J. W. Hepburn, Rotationally resolved threshold photoelectron spectroscopy of O2 using coherent XUV: formation of vibrationally excited ions in the Franck–Condon gap, Can. J. Phys., 1994, 72, 1284–1293 CrossRef CAS.
- P. C. Cosby, J. B. Ozenne, J. T. Moseley and D. L. Albritton, High-resolution photofragment spectroscopy of the O2+b4Σg− (v′ = 3, 4, 5) ← a4Πu (v′ = 3, 4, 5) First Negative system using coaxial dye-laser and velocity-tuned ion beams, J. Mol. Spectrosc., 1980, 79, 203–235 CrossRef CAS.
- K. P. Huber and G. Herzberg, Molecular Spectra and Molecular Structure, Constants of Diatomic Molecules, Van Nostrand, New York, 1979, vol. 4 Search PubMed.
- Z. Luo, Y.-C. Chang, Y. Pan, K.-C. Lau and C. Y. Ng, Rotationally Resolved State-to-State Photoelectron Study of Molybdenum Monoxide Cation (MoO+), J. Phys. Chem. A, 2016, 120, 4643–4654 CrossRef CAS PubMed.
- Y. C. Chang, Z. Luo, Y. Pan, Z. Zhang, Y.-N. Song, S. Y. Kuang, Q. Z. Yin, K.-C. Lau and C. Y. Ng, Rotationally resolved state-to-state photoionization and the photoelectron study of vanadium monocarbide and its cations (VC/VC+), Phys. Chem. Chem. Phys., 2015, 17, 9780–9793 RSC.
- Z. Luo, H. Huang, Z. Zhang, Y.-C. Chang and C. Y. Ng, Rotationally resolved state-to-state photoelectron study of niobium carbide radical, J. Chem. Phys., 2014, 141, 024304 CrossRef PubMed.
- Z. Luo, Y.-C. Chang, Z. Zhang and C. Y. Ng, Rotationally resolved state-to-state photoelectron study of zirconium monoxide cation (ZrO+), Mol. Phys., 2015, 113, 2228–2242 CrossRef CAS.
- D. W. Turner, C. Baker, A. D. Baker and C. R. Brundle, Molecular Photoelectron Spectroscopy: A Handbook of He 584 Å Spectra, John Wiley & Sons, 1970 Search PubMed.
| This journal is © the Owner Societies 2017 |

