Proton conduction in alkali metal ion-exchanged porous ionic crystals†
Sayaka
Uchida
 *a,
Reina
Hosono
a,
Ryo
Eguchi
b,
Ryosuke
Kawahara
a,
Ryota
Osuga
c,
Junko N.
Kondo
c,
Mitsuhiro
Hibino
b and
Noritaka
Mizuno
b
aDepartment of Basic Science, School of Arts and Sciences, The University of Tokyo, 3-8-1 Komaba, Meguro-ku, Tokyo 153-8902, Japan. E-mail: csayaka@mail.ecc.u-tokyo.ac.jp
bDepartment of Applied Chemistry, School of Engineering, The University of Tokyo, 7-3-1 Hongo, Bunkyo-ku, Tokyo 113-8656, Japan
cLaboratory for Chemistry and Life Science, Institute of Innovative Research, Tokyo Institute of Technology, 4259-R1-10 Nagatsuta, Midori-ku, Yokohama 226-8503, Japan
First published on 6th September 2017
Abstract
Proton conduction in alkali metal ion-exchanged porous ionic crystals A2[Cr3O(OOCH)6(etpy)3]2[α-SiW12O40]·nH2O [I-A+] (A = Li, Na, K, Cs, etpy = 4-ethylpyridine) is investigated. Single crystal and powder X-ray diffraction measurements show that I-A+ possesses analogous one-dimensional channels where alkali metal ions (A+) and water of crystallization exist. Impedance spectroscopy and water diffusion measurements of I-A+ show that proton conductivities are low (10−7–10−6 S cm−1) under low relative humidity (RH), and protons mostly migrate as H3O+ with H2O as vehicles (vehicle mechanism). The proton conductivity of I-A+ increases with the increase in RH and is largely dependent on the types of alkali metal ions. I-Li+ shows a high proton conductivity of 1.9 × 10⁻³ S cm−1 (323 K) and a low activation energy of 0.23 eV under RH 95%. Under high RH, alkali metal ions with high ionic potentials (e.g., Li+) form a dense and extensive hydrogen-bonding network of water molecules with mobile protons at the periphery, which leads to high proton conductivities and low activation energies via rearrangement of the hydrogen-bonding network (Grotthuss mechanism).
Introduction
Proton-conducting solid electrolytes have been extensively studied from the viewpoint of basic science research for practical application.1 Among the candidates, metal–organic frameworks (MOFs) possess highly-ordered porous structures which can be designed to conduct protons efficiently by the appropriate choice of metal ions and ligands:2 high proton conductivities of 10−3–10−2 S cm−1 have been reported at low temperatures (<373 K) and high humidity (>RH 95%, RH = relative humidity) by the utilization of sulfates, sulfonates, phosphanates or amines as ligands, which are conjugate bases (i.e., anions) that can efficiently transfer protons.3The role of water is key to achieve high proton conductivity in solids under humidified conditions. Protons can be transferred via rearrangement of the water-mediated hydrogen-bonding network (i.e., Grotthus mechanism) or as H3O+ with H2O as vehicles (i.e., vehicle mechanism).4 On the other hand, it is well known that ions in water affect the hydrogen-bonding network:5 for example, among the alkali metal ions, Li+ and Na+ with high ionic potentials (r/z, where r and z are ionic radius and charge, respectively) generate high electrostatic fields, enhance the formation of hydrogen bonds, and are “structure-making ions”. On the other hand, K+, Rb+, and Cs+ weaken the hydrogen bonds and are “structure-breaking ions”.
There are only a few studies discussing the proton conduction of crystalline solids containing both water and alkali metal ions. For example, alkali metal ion-exchanged phosphonates showed proton conductivities of 10−5–10−3 S cm−1 depending on the types of alkali metal ions at rt (room temperature) and RH 98%.6 However, the crystal structures of the phosphonates were dependent on the types of alkali metal ions, so that the relationship between the type of ion and proton conductivity was not always clear. It has been recently reported that the existence of Na+ in the micropores of aluminophosphates would enhance water uptake and proton conduction.7
We and other groups have been studying the synthesis, crystal structure, and functions of porous ionic crystals constructed with macroions.8 While ionic crystals generally crystallize into dense and isotropic structures due to the Coulomb interaction, utilization of macroions with specific charges, sizes, shapes, and functional groups can result in the formation of pores. Porous ionic crystals show unique functions in gas and ion sorption/separation and heterogeneous catalysis, which are different from conventional porous crystals such as MOFs and zeolites.8 Particularly, the ionic components create strong electrostatic fields at the internal surfaces of the pores, which are suitable for accommodating polar guests such as water.8d
Based on these considerations, we focused on K2[Cr3O(OOCH)6(etpy)3]2[α-SiW12O40]·8H2O [I-K+] (etpy = 4-ethylpyridine) composed of a polyoxometalate (POM) [α-SiW12O40]4− and a macrocation [Cr3O(OOCH)6(etpy)3]+, which showed a highly selective uptake of CO2 due to the strong electrostatic field generated by the ionic components.9a–c The pore volume of I-K+ could be increased by post-synthetic modification (acid-treatment and ion-exchange) due to the flexibility of the local structure.9c It has been well known that POMs, which are nano-sized anionic metal–oxygen clusters of early transition metals, can efficiently transfer protons since smearing of the negative charge over the external surface oxygens makes the effective surface charge density small.10 According to these considerations, I-K+ was utilized as a model compound to investigate the effects of alkali metal ions on proton conduction of porous ionic crystals.
Experimental
K2[Cr3O(OOCH)6(etpy)3]2[α-SiW12O40]·8H2O [I-K+] (etpy = 4-ethylpyridine) was synthesized according to the previously reported method.9 A2[Cr3O(OOCH)6(etpy)3]2[α-SiW12O40]·nH2O [I-A+] (A = Li, Na, Cs) were formed by the ion-exchange reaction by immersing I-K+ (0.1 g, 2.2 × 10⁻² mmol) in 25 mL of 0.3 mol L−1 ANO3aq (A = Cs, Na, Li; A = 7.5 mmol) followed by stirring at room temperature (rt) for 24 h. Metal nitrates were purchased from Kanto Kagaku and used as received. Atomic absorption spectroscopy (AAS) analysis (Hitachi, ZA3000) was used for the quantitative analysis of Cs, K, Na, and Li in I-A+. Powder X-ray diffraction (PXRD) patterns were measured with a New Advance D8 X-ray diffractometer (Bruker) by using Cu Kα radiation (λ = 1.54056 Å, 40 kV–40 mA) at 2 theta = 3–40 deg and 1.8 deg min−1. PXRD patterns under water vapour were measured with a XRD-DSCII (Rigaku Corporation) by the parallel beam method and Cu Kα radiation (λ = 1.54056 Å, 50 kV–300 mA) at 2 theta = 3–15° at 0.02° point and 3 s step−1. Alternating current (AC) impedance measurements: about 0.1 g of the compounds were compressed at 100 kgf cm−2 into pellets of 10 mm in diameter and ca. 0.6 mm in thickness. AC impedance measurements were carried out in a heat chamber at 303–323 K with a BioLogic VMP3 multi-channel Potentiostat/Galvanostat (Science Instruments) over the frequency range of 5 Hz to 500 kHz and AC amplitudes of 50 or 100 mV. Gold electrodes were attached on both faces of the pellets. Bulk conductivities were estimated by semicircle fitting of Nyquist plots. Water vapor sorption isotherms were measured at 303 K using a Belsorp-max volumetric adsorption apparatus (BEL Japan). Prior to the measurement, about 0.1 g of crystals were ground and treated in vacuo at 373 K for 3 h to remove the water of crystallization. Sorption equilibrium was judged by the following criteria: ±0.3% of pressure change in 500 s. In situ IR spectra under water vapour were measured as follows: each powder sample was deposited on a CaF2 plate (20 mm diameter), which was placed inclined at the center of an IR cell, and treated in vacuo at 373 K for 2 h. IR spectra were obtained at a resolution of 4 cm−1 using a Jasco 6100 FT-IR spectrometer equipped with a MCT detector. The IR spectra of the sample in vacuum were recorded as background spectra. IR spectra of adsorbed water were measured by increasing the water vapor pressure from 5 to 1 × 10³ Pa at rt, and background-subtracted IR spectra showing adsorbed water are presented throughout this paper.Single crystal X-ray diffraction (SXRD) analysis: single crystals of I-Na+ and I-Cs+ were prepared by immersing I-K+ in 0.3 mol L−1 ANO3aq (A = Cs, Na) for >3 days. X-ray diffraction data of I-Na+ and I-Cs+ were collected at 93 K with a CCD 2-D detector by using a Rigaku Saturn diffractometer with graphite monochromated Mo Kα radiation. Structures were solved by the direct method (SHELX97), expanded using Fourier techniques, and refined by full-matrix least-squares against F2 with the SHELXL-2014 package. Silicon, chromium, cesium, and tungsten atoms were refined anisotropically, while carbon, nitrogen, oxygen, and sodium atoms were refined isotropically. Hydrogen atoms were not included in the model. Crystal data of I-Na+: triclinic P![[1 with combining macron]](https://www.rsc.org/images/entities/char_0031_0304.gif) , a = 13.535(3) Å, b = 20.557(5) Å, c = 20.603(5) Å, α = 76.600(8)°, β = 73.782(8)°, γ = 73.784(8)°, V = 5217(2) Å3, Z = 2, 18
, a = 13.535(3) Å, b = 20.557(5) Å, c = 20.603(5) Å, α = 76.600(8)°, β = 73.782(8)°, γ = 73.784(8)°, V = 5217(2) Å3, Z = 2, 18![[thin space (1/6-em)]](https://www.rsc.org/images/entities/char_2009.gif) 655 reflections collected, 856 parameters, R1[I > 2σ(I)] = 0.0716, wR2 = 0.1946, GOF = 0.990. Crystal data of I-Cs+: triclinic P
655 reflections collected, 856 parameters, R1[I > 2σ(I)] = 0.0716, wR2 = 0.1946, GOF = 0.990. Crystal data of I-Cs+: triclinic P![[1 with combining macron]](https://www.rsc.org/images/entities/char_0031_0304.gif) , a = 13.506(3) Å, b = 20.537(5) Å, c = 20.565(5) Å, α = 76.764(9)°, β = 73.713(9)°, γ = 73.912(9)°, V = 5190(2) Å3, Z = 2, 18
, a = 13.506(3) Å, b = 20.537(5) Å, c = 20.565(5) Å, α = 76.764(9)°, β = 73.713(9)°, γ = 73.912(9)°, V = 5190(2) Å3, Z = 2, 18![[thin space (1/6-em)]](https://www.rsc.org/images/entities/char_2009.gif) 507 reflections collected, 744 parameters, R1[I > 2σ(I)] = 0.0724, wR2 = 0.1936, GOF = 0.956. See Table S1 (ESI†) for the details of the crystallographic parameters. CCDC 1559458 and 1559459.†
507 reflections collected, 744 parameters, R1[I > 2σ(I)] = 0.0724, wR2 = 0.1936, GOF = 0.956. See Table S1 (ESI†) for the details of the crystallographic parameters. CCDC 1559458 and 1559459.†
Results and discussion
Compounds I-A+ were formed by an ion-exchange reaction by immersing I-K+ (0.1 g, 2.2 × 10⁻² mmol) in 25 mL of 0.3 mol L−1 ANO3aq (A = Cs, Na, Li; A = 7.5 mmol) followed by stirring at room temperature (rt) for 24 h. The results of elemental analysis of K and A in I-A+ are summarized in Table 1. The calculated values are based on the formula assuming that K+ was completely exchanged with A+. Considering that almost no K was detected in I-A+ and that the amounts of A were close to the calculated values, it can be assumed that the ion-exchange reactions were carried out completely. The 7Li-MASNMR spectrum of I-Li+ gave a single signal at 2.2 ppm (Fig. S2, ESI†), which is close to that of LiCl (0 ppm),11 suggesting that the Li species in I-Li+ are cations (Li+) as in LiCl. IR spectra (Fig. S3, ESI†) and powder X-ray diffraction (PXRD) patterns (Fig. 1) of I-A+ were analogous to each other, showing that the ion-exchange treatment has little effect on the molecular and crystal structures of I-A+.| Formula | K [%] (calc.) | A [%] (calc.) | |
|---|---|---|---|
| Alkali metals were analyzed with atomic absorption spectrometry (AAS). At least 3 different lots were measured and averaged. Amounts of water of crystallization were analyzed with thermogravimetry (Fig. S1, ESI). | |||
| I-K+ | K2[Cr3O(OOCH)6(etpy)3]2[α-SiW12O40]·8H2O | 1.65 | — |
| (1.69) | |||
| I-Li+ | Li2[Cr3O(OOCH)6(etpy)3]2[α-SiW12O40]·11H2O | 0.12 | 0.29 (0.30) |
| (0) | |||
| I-Na+ | Na2[Cr3O(OOCH)6(etpy)3]2[α-SiW12O40]·8H2O | 0.05 | 1.10 (1.00) |
| (0) | |||
| I-Cs+ | Cs2[Cr3O(OOCH)6(etpy)3]2[α-SiW12O40]·5H2O | 0.08 | 5.40 (5.59) |
| (0) | |||
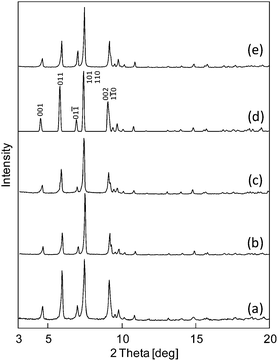 | ||
| Fig. 1 PXRD patterns of (a) I-Li+, (b) I-Na+, (c) I-K+, (d) I-Cs+ (calculated), and (e) I-Cs+ (experimental). | ||
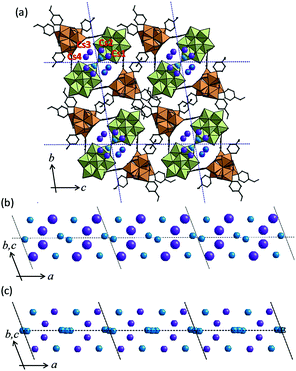
Single crystal X-ray diffraction (SXRD) analysis of I-Cs+ shows that a one-dimensional channel with a minimum aperture of 3.5 Å exists along the a-axis (Fig. 2a). The structure of I-Cs+ is stabilized by the π–π interaction (ca. 3.7 Å) between the etpy ligands of neighboring macrocations ([Cr3O(OOCH)6(etpy)3]+). Two Cs+ per formula existed in the one-dimensional channel and were disordered among four positions Cs1, Cs2, Cs3, and Cs4 with a site occupancy of 0.5. Cs+ exists in the vicinity of polyoxometalates (POM) and macrocations (mac): Cs1–OPOM = 3.063, 3.160 Å, Cs2–OPOM = 3.052, 3.110 Å, Cs3–OPOM = 3.219 Å, Cs3–Omac = 3.352 Å, and Cs4–OPOM = 3.174, 3.333 Å. Water of crystallization (3.5 molecules per formula, O200–O202 with a site occupancy of 1.0 and O203 with a site occupancy of 0.5) were located in the one-dimensional channel of I-Cs+. The water molecules existed in the vicinity of Cs+ (O200–Cs = 2.933, 3.196, 3.334 Å, O201–Cs = 2.909, 3.173, 3.338 Å, O202–Cs = 3.201, 3.438 Å, O203–Cs = 3.231, 3.450 Å) and were in hydrogen bonding distances with each other (O200–O200 = 2.915 Å, O201–O201 = 2.960 Å, O200–O202 = 3.097 Å, and O201–O203 = 3.145 Å). The crystal structure of I-Na+ could be also analyzed by SXRD. The positions of alkali metal ions (Cs+ and Na+) and oxygen atoms of the water of crystallization in I-Cs+ and I-Na+ are shown in Fig. 2b and c: the local structures were very similar to each other.12
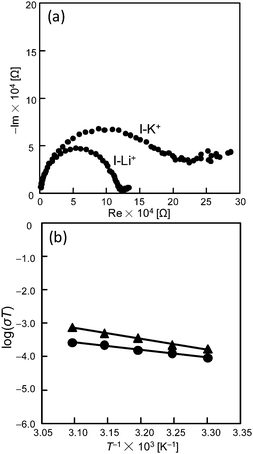
Nyquist plots of the impedance spectra of pelleted samples of I-Li+ and I-K+ were measured at 303–323 K and a relative humidity of 50% (RH 50%). Fig. 3a shows the results at 308 K as an example. Proton conductivities were estimated by the semicircle fitting of Nyquist plots. The proton conductivities of I-Li+ and I-K+ were low and similar to each other (10−7–10−6 S cm−1). Activation energies were estimated from the Arrhenius plots (T−1vs. log(σT)) of the temperature dependent proton conductivities (Fig. 3b), and were 0.63 and 0.45 eV for I-Li+ and I-K+, respectively. It is well known that proton conduction via rearrangement of the water-mediated hydrogen-bonding network (Grotthus mechanism4) is generally lower than 0.2 eV,13 while the vehicle mechanism4 where protons do not migrate as H+ but as H3O+ with H2O as a vehicle shows a higher activation energy.14 Since the activation energies of I-Li+ and I-K+ were much higher than 0.2 eV, proton conduction at RH 50% is probably due to the vehicle mechanism.15
In order to gain insight into the water diffusion and proton conduction mechanisms, the amounts of water sorption in I-Li+ and I-K+ as a function of time at 303 K were measured. Fig. S4 (ESI†) shows the experimental water sorption profiles of I-Li+ and I-K+, which were pretreated at 373 K under dry N2 for 3 h to remove the water of crystallization. The profiles were similar to each other and were fitted with the Fickian diffusion model,16 which has been typically used for diffusion in micropores. The diffusion coefficients for both I-Li+ and I-K+ were in the order of D = 10−10 cm2 s−1 with an average particle size of 3 μm. Notably, the diffusion coefficient of CO2 in I-K+ was ca. D = 10−8 cm2 s−1 and was much larger,9b probably because polar H2O can interact more strongly than CO2 with the ionic components of I-A+ so that the diffusion of H2O is much slower.
Ionic conductivity σ (proton conductivity in I-A+ at 303 K and RH 50% is about 10−9 [S m−1] = [C2 s kg−1 m−3], see above) can be related to the diffusion coefficient D of the charge carrier (diffusion coefficient of water in I-A+ at 303 K is about 10−14 m2 s−1, see above) by the following Nernst–Einstein equation,17
 | (1) |
 | (2) |
It can be assumed that H3O+ is formed and introduced in I-A+ from the synthetic solution. Since the pH of the synthetic solution was ca. 4, the ratio XB of H3O+ to H2O in the synthetic solution of I-A+ is,
 | (3) |
The fair agreement between XA and XB suggests that the protons in I-A+ at RH 50% migrate as H3O+ with H2O as vehicles.
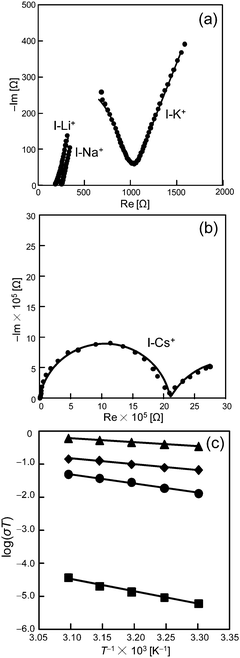
Next, Nyquist plots of the impedance spectra of pelleted samples of I-A+ (A = Cs, Na, K, Li) were measured under high RH. Fig. 4a and b show the results at 308 K and RH 95% as an example. Proton conductivities were estimated by the semicircle fitting of Nyquist plots. Interestingly, the proton conductivities increased with the increase in RH and were largely dependent on the types of alkali metal ions. Therefore, it can be assumed that protons and water molecules largely contribute to the ionic conduction in I-A+. The proton conductivities (323 K) increased in the order of I-Cs+ (1.2 × 10⁻⁷ S cm−1) < I-K+ (1.6 × 10⁻⁴ S cm−1) < I-Na+ (4.4 × 10⁻⁴ S cm−1) < I-Li+ (1.9 × 10⁻³ S cm−1), and I-Li+ showed a exceptionally high proton conductivity. It was confirmed by PXRD and IR measurements that the molecular and crystal structures of I-A+ are stable under AC impedance measurement conditions(Fig. S3 and S5, ESI†).
Activation energies were estimated from the Arrhenius plots (T−1vs. log(σT)) of the temperature dependent proton conductivities (Fig. 4c). The activation energies of I-Cs+, I-K+, I-Na+, and I-Li+ were 0.75, 0.56, 0.33, and 0.23 eV, respectively. The activation energy of I-Li+ was 0.23 eV and the lowest of all the compounds. The low value suggests that protons are conducted efficiently via rearrangement of the water-mediated hydrogen-bonding network (Grotthuss mechanism).4,13 Besides, Li+ conduction in solids generally gives a much higher activation energy (>0.4 eV).18 Therefore, the high ionic conductivity and low activation energy of I-Li+ at high RH suggests that ionic conduction in I-Li+ is mediated by protons and proceeds via the Grotthuss mechanism. Notably, proton conductivities decreased and activation energies increased with the increase in ionic radius of the alkali metal ions (r, 6-coordination: r(Li+) = 0.076 nm < r(Na+) = 0.102 nm < r(K+) = 0.138 nm < r(Cs+) = 0.167 nm),19 which will be discussed further below.
In order to gain insight into the proton conduction mechanism of I-A+ under high RH, water sorption isotherms of I-A+ were measured at 303 K (Fig. 5). Prior to the measurements, I-A+ were evacuated at 373 K for 3 h to remove the water of crystallization. I-Li+ showed the largest amount of water sorption over the entire RH range. The amount of water sorption at RH 95% decreased in the order of I-Li+ > I-Na+ > I-K+ > I-Cs+, which is in line with the ionic potential (r/z, where r and z are ionic radius and charge, respectively) of the alkali metal ions. Considering that the porous structure does not change with the ion-exchange treatment (Fig. 1), ion–dipole interactions between the alkali metal ions and polar water molecules is probably the main parameter affecting the water sorption properties of I-A+.
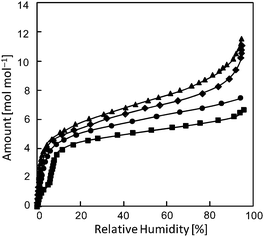 | ||
| Fig. 5 Water sorption isotherms of I-A+ at 303 K. Triangles, diamonds, circles, and squares show the data for I-Li+, I-Na+, I-K+, and I-Cs+, respectively. | ||
It can be summarized for I-A+ under high RH that I-A+ (e.g., A = Li+) with high proton conductivities shows low activation energies and large amounts of water sorption (Table 2). This observation agrees with the trends of “structure making and breaking” of ions in aqueous solutions:5 ions with high ionic potentials (e.g., Li+) form a dense and extensive hydrogen-bonding network of water molecules and are “structure making”. If the hydrogen-bonding network is dense and extensive, proton conduction along the hydrogen-bonding network can occur more easily, which leads to higher proton conductivity and lower activation energy. Besides, the high activation energy of I-Li+ at low RH (0.63 eV at RH 50%) is in line with the strong interaction between Li+ and water, which probably hinders the diffusion of H2O as a proton carrier (H3O+).
| I-Li+ | I-Na+ | I-K+ | I-Cs+ | |
|---|---|---|---|---|
| Proton conductivity [S cm−1] (323 K, RH 95%) | 1.9 × 10⁻³ | 4.4 × 10⁻⁴ | 1.6 × 10⁻⁴ | 1.2 × 10⁻⁷ |
| Activation energy [eV] | 0.23 | 0.33 | 0.56 | 0.75 |
| Water sorption [mol mol−1] at RH 95% | 11 | 10 | 7 | 6 |
Finally, the states of water sorbed in I-A+ was investigated with the ν(OH) bands of the in situ IR spectra (Fig. 6). I-Li+ and I-Cs+ were chosen because they represent the extremes with respect to ionic radius and potential. Upon introduction of water vapor, two bands appeared at ca. 3650 and 3250 cm−1, and the intensities of these bands increased with the increase in water vapor pressure. However, at high water vapor pressures, the intensity of the band at higher frequency (wavenumber) was relatively large for I-Li+ (Fig. 6a) while the opposite trend was observed for I-Cs+ (Fig. 6b).
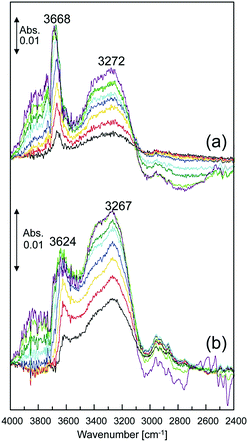 | ||
| Fig. 6 Changes in the IR spectra (298 K) of (a) I-Li+ and (b) I-Cs+ under water vapor pressure from 5 Pa (black) to 1 × 10³ Pa (purple). | ||
It has been reported for alkali metal ion-exchanged zeolite Na-ZSM-5 that water is adsorbed on Na+, and water clusters grow around the Na+ with the increase in water vapor pressure.20 Mainly two bands appeared at ca. 3600 and 3300 cm−1 in the in situ IR spectra of Na-ZSM-5, and the intensities grew with the increase in water vapor pressure.20 The bands at ca. 3600 and 3300 cm−1 have been attributed to unperturbed (free) water molecules at the outside of a water cluster and to perturbed hydrogen-bonded water molecules inside the cluster, respectively. In addition, it has been reported that the intensity of the band at a higher frequency is relatively small for Cs-ZSM-5, which is in line with the trend observed for I-Li+ and I-Cs+ with the explanation as follows: water molecules are hydrogen-bonded to each other rather than absorbing on Cs+ and forming clusters.20 This explanation is supported by the fact that Cs+ has the lowest ionic potential among the alkali metal ions and is “structure-breaking”. According to these results, the set of bands at ca. 3650 and 3250 cm−1 for both I-Cs+ and I-Li+ can be attributed to unperturbed water molecules at the outside of a water cluster and to perturbed hydrogen-bonded water molecules inside the cluster, respectively.
The relationship between proton conductivity and states of water molecules has been discussed from in situ IR spectroscopy. For example, in the case of yttria-doped zirconia, which shows high proton conductivity at intermediate temperatures (473–773 K), proton exchange among free water (ν(OH): 3650 cm−1) occurred even at 323 K.21 It has been reported by analyzing the δ(HOH) band of water adsorbed in Nafion, which is a representative polymer electrolyte, that the protons of weakly hydrogen-bonded water molecules in the water cluster largely contributed to the high proton conductivity.22
According to these results, the relationship between proton conductivity and states of water molecules in I-A+ can be explained as follows: since the relative intensity of the band at a higher frequency was I-Li+ ≫ I-Cs+ and that proton conductivity was I-Li+ ≫ I-Cs+ regardless of RH, it can be reasonably stated that weakly hydrogen-bonded water molecules at the periphery of the water cluster largely contribute to the proton conductivity. In summary, the formation of a dense and extensive hydrogen-bonding network of water molecules by “structure making” ions such as Li+ and the existence of weakly hydrogen-bonded mobile protons at the periphery of the network both contribute to the high proton conductivity in alkali metal ion-exchanged porous ionic crystals.
Conclusion
Proton conduction in alkali metal ion-exchanged porous ionic crystals A2[Cr3O(OOCH)6(etpy)3]2[α-SiW12O40]·nH2O [I-A+] (A = Li, Na, K, Cs, etpy = 4-ethylpyridine) was investigated. I-A+ possesses analogous one-dimensional channels where alkali metal ions (A+) and water of crystallization exist. Under low RH, protons in I-A+ mostly migrate as H3O+ with H2O as vehicles (vehicle mechanism). Proton conductivities of I-A+ increased with the increase in RH and were largely dependent on the types of alkali metal ions. I-Li+ showed a high proton conductivity of 1.9 × 10⁻³ S cm−1 (323 K) and a low activation energy of 0.23 eV under RH 95%. Under high RH, alkali metal ions with high ionic potentials (e.g., Li+) formed a dense and extensive hydrogen-bonding network of water molecules with mobile protons at the periphery, which contributed to the high proton conductivities and low activation energies via rearrangement of the hydrogen-bonding network (Grotthuss mechanism). Since most porous crystals with high proton conductivity contain sulfates, sulfonates or phosphonates, which could be potential sources of contamination, I-Li+ can be an environmentally friendly candidate for solid electrolytes. Most importantly, this is the first comprehensive work discussing the effect of alkali metal ions toward proton conduction in porous crystals.Conflicts of interest
There are no conflicts to declare.Acknowledgements
This work was supported by JST-PRESTO (JPMJPR1312) and Grant-in-Aids for Scientific Research on Innovative Area “Coordination Asymmetry” (JP17H05356) from the Ministry of Education, Culture, Science, Sports, and Technology of Japan. Mr Satoru Miyazawa (Univ. of Tokyo) is acknowledged for checking the contents of the manuscript.Notes and references
- T. Norby, Solid State Ionics, 1999, 125, 1–11 CrossRef CAS.
- (a) X. Meng, H. N. Wang, S. Y. Song and H. J. Zhang, Chem. Soc. Rev., 2017, 46, 464–480 RSC; (b) M. Sadakiyo, T. Yamada and H. Kitagawa, ChemPlusChem, 2016, 81, 691–701 CrossRef CAS; (c) S. Horike, D. Umeyama and S. Kitagawa, Acc. Chem. Res., 2013, 46, 2376–2384 CrossRef CAS PubMed.
- (a) S. Kim, K. W. Dawson, B. S. Gelfand, J. M. Taylor and G. K. H. Shimizu, J. Am. Chem. Soc., 2013, 135, 963–966 CrossRef CAS PubMed; (b) P. Ramaswamy, N. E. Wong, B. S. Gelfand and G. K. H. Shimizu, J. Am. Chem. Soc., 2015, 137, 7640–7643 CrossRef CAS PubMed; (c) N. T. T. Nguyen, H. Furukawa, F. Gándara, C. A. Trickett, H. M. Jeong, K. E. Cordova and O. M. Yaghi, J. Am. Chem. Soc., 2015, 137, 15394–15397 CrossRef CAS PubMed.
- K. D. Kreuer, Chem. Mater., 1996, 8, 610–641 CrossRef CAS.
- Y. Marcus, Chem. Rev., 2009, 109, 1346–1370 CrossRef CAS PubMed.
- M. Bazaga-García, M. Papadaki, R. M. P. Colodrero, P. Olivera-Pastor, E. R. Losilla, B. Nieto-Ortega, M. A. G. Aranda, D. Choquesillo-Lazarte, A. Cabeza and K. D. Demadis, Chem. Mater., 2015, 27, 424–435 CrossRef.
- Y. Sun, Y. Yan, Y. Wang, Y. Li, J. Li and J. Yu, Chem. Commun., 2015, 51, 9317–9319 RSC.
- (a) S. Seino, R. Kawahara, Y. Ogasawara, N. Mizuno and S. Uchida, Angew. Chem., Int. Ed., 2016, 55, 3987–3991 CrossRef CAS PubMed; (b) S. Surinwong, N. Yoshinari, B. Yotnoi and T. Konno, Chem. – Asian J., 2016, 11, 486–490 CrossRef CAS PubMed; (c) J. Martín-Caballero, A. S. J. Wéry, S. Reinoso, B. Artetxe, L. S. Felices, B. E. Bakkali, G. Trantwein, J. Alcañiz-Monge, J. L. Vilas and J. M. Gutiérrez-Zorrila, Inorg. Chem., 2016, 55, 4970–4979 CrossRef PubMed; (d) Y. Ogasawara, S. Uchida and N. Mizuno, J. Phys. Chem. C, 2007, 111, 8218–8227 CrossRef CAS.
- (a) R. Eguchi, S. Uchida and N. Mizuno, Angew. Chem., Int. Ed., 2012, 51, 1635–1639 CrossRef CAS PubMed; (b) R. Eguchi, S. Uchida and N. Mizuno, J. Phys. Chem. C, 2012, 116, 16105–16110 CrossRef CAS; (c) S. Uchida, E. Takahashi and N. Mizuno, Inorg. Chem., 2013, 52, 9320–9326 CrossRef CAS PubMed.
- (a) O. Nakamura, T. Kodama, I. Ogino and Y. Miyake, Chem. Lett., 1979, 17–18 CrossRef CAS; (b) O. Nakamura, I. Ogino and T. Kodama, Solid State Ionics, 1981, 3-4, 347–351 CrossRef CAS.
- J. Zou, H. He, J. Dong and Y. Cang, J. Mater. Chem., 2004, 14, 2405–2411 RSC.
- The positions of Li+ in I-Li+ could not be resolved by SXRD because of the low electron density of Li+.
- (a) B. G. Choi, J. Hong, Y. C. Park, D. H. Jung, W. H. Hong, P. T. Hammond and H. S. Park, ACS Nano, 2011, 5, 5167–5174 CrossRef CAS PubMed; (b) R. K. Pandey, Md. D. Hossian, S. Moriyama and M. Higuchi, J. Mater. Chem. A, 2014, 2, 7754–7758 RSC.
- K. D. Kreuer, A. Rabenau and W. Weppner, Angew. Chem., Int. Ed. Engl., 1982, 21, 208–209 CrossRef.
- Contribution of Li+ conduction in I-Li+ under low RH cannot be ruled out.
- J. Crank, The Mathematics of Diffusion, Oxford University Press, London, 1956 Search PubMed.
- (a) W. D. Kingery, J. Pappis, M. E. Doty and D. C. Hill, J. Am. Ceram. Soc., 1959, 42, 393–398 CrossRef CAS; (b) S. Takai, M. Kamata, S. Fujine, K. Yoneda, K. Kanda and T. Esaka, Solid State Ionics, 1999, 123, 165–172 CrossRef CAS.
- (a) R. Murugan, V. Thangadurai and W. Weppner, Angew. Chem., Int. Ed., 2007, 46, 7778–7781 CrossRef CAS PubMed; (b) P. Knauth, Solid State Ionics, 2009, 180, 911–916 CrossRef CAS.
- R. D. Shannon, Acta Crystallogr., 1976, A32, 751–767 CrossRef CAS.
- A. Jentys, G. Warecka, M. Derewinski and J. A. Lercher, J. Phys. Chem., 1989, 93, 4837–4843 CrossRef CAS.
- S. Miyoshi, Y. Akao, N. Kuwata, J. Kawamura, Y. Oyama, T. Yagi and S. Yamaguchi, Chem. Mater., 2014, 26, 5194–5200 CrossRef CAS.
- K. Kunimatsu, B. Bae, K. Miyatake, H. Uchida and M. Watanabe, J. Phys. Chem. B, 2011, 115, 4315–4321 CrossRef CAS PubMed.
Footnote |
| † Electronic supplementary information (ESI) available: Experimental details. Crystallographic data (Table S1). TG profiles (Fig. S1). 7Li-MASNMR spectrum (Fig. S2). IR spectra (Fig. S3). Amounts of water sorption as a function of time (Fig. S4). PXRD at high temperature and RH95% (Fig. S5). CCDC 1559458 and 1559459. For ESI and crystallographic data in CIF or other electronic format see DOI: 10.1039/c7cp04619g |
| This journal is © the Owner Societies 2017 |

