Augmented pH-sensitivity absorbance of a ruthenium(II) bis(bipyridine) complex with elongation of the conjugated ligands: an experimental and theoretical investigation
Received
25th June 2017
, Accepted 5th September 2017
First published on 15th September 2017
Abstract
An absorbance-based sensor employing ruthenium bipyridyl with a phenanthroline-fused benzoylthiourea moiety formulated as [Ru(II)(bpy)2(phen-nBT)](PF6)2 {bpy = 2,2′-bipyridine, phen = 1,10-phenanthroline, nBT = n-benzoylthiourea} has been synthesized and characterized by elemental analyses, mass spectrometry, and infrared, ultraviolet-visible, luminescence and nuclear magnetic resonance spectroscopy. The changes in the intensity of absorption and emission of the complex induced by functionalization of the benzoylthiourea ligands with amino and carbonyl in their protonated and deprotonated forms were studied experimentally. The absorption and emission properties of the complex exhibit a strong dependence on the pH (1–11) of the aqueous medium. This work highlights the pH-sensitivity augmentation of the absorption band by elongating the conjugation length in the structure of the ruthenium bipyridine complex. The principle of this work was to design the title compound to be capable of enhancing the differences in the absorption sensitivity responses towards pH between the protonated and deprotonated complexes in the absorption measurement. Along with significant and noticeable changes in the absorption spectra, subsequent theoretical investigations specifically on the electronic and absorbance properties of the title compound were carried out in this study. Protonation of the molecule significantly stabilized the lowest-unoccupied molecular orbital (LUMO), whereas the highest-occupied molecular orbital (HOMO) is greatly destabilized upon deprotonation. A time-dependent density functional theory (TDDFT) calculation in the linear-response (-LR) regime was performed to clarify the origin of the experimentally observed linear dependence of absorption intensity upon pH (1–11). The MLCT band exhibits hyperchromic shift at low pH as indicated by the large transition dipole moment and a wider distribution of the response charge of the molecule, which is induced by the stabilization of the electrostatic potential at the carbonyl moiety by protonation. This study provides the possibility of employing theoretical information to gain insight into the origin of the optical absorption obtained experimentally. The ruthenium complex was designed with an elongated ligand conjugation length and exhibited a tremendously large change in the absorption intensity of the protonated and deprotonated forms, which therefore demonstrates its feasibility as an indicator molecule especially for absorbance measurements.
1. Introduction
Ruthenium polypyridine complexes have received extensive interest in the past 45 years due to their strong and broad visible light absorption, high chemical stability, tunable electronic properties, high molar absorptivity, efficient emissions and long emission lifetime.1,2 Their unique characteristics have led to them being used in various potential advantages, making them good candidates for sensitive and efficient receptors for optical sensing applications such as optical pH sensors,3 carbon dioxide sensors, oxygen sensors, temperature sensors4,5 and chemical sensors.6 An optical pH sensor uses the interaction of light with ruthenium(II) polypyridyl complexes to determine the pH and offer better thermal performance and faster response time. The design of the sensor is based on the variations in the physical behaviour of the complexes such as the absorbance and fluorescence properties that can be monitored by an optical detector.3
Protonation or deprotonation of basic or acidic sites in metal complexes, respectively, exhibits a dependence on the pH of the medium. The presence of amino,7 carboxylic,8 hydroxyl9 or imidazole-functionalized ligands10 acting as protonatable and deprotonatable moieties in the Ru(II) complexes could regulate the photophysical properties effectively for a pH-responsive on–off switch, and therefore would be useful in the design of a pH sensor. At the equilibrium point, the protonated and deprotonated forms of the Ru(II) complex exhibit variations in their emission and/or absorption spectra, and the pH of the medium may affect the ground state or the excited state species.11 The transfer of protons is essentially a simple chemical signal for monitoring the pH changes.
Even though extensive studies have been performed and numerous pH sensors based on ruthenium compounds have been reported, the changes in the absorption spectra are rather insensitive to the variations of pH. The ruthenium(II) complexes generally have greater sensitivity in the emission than absorption in response to the pH changes.12 Herein, we define the pH sensitivity as an on–off ratio at a fixed wavelength. The on–off ratio is interpreted as the ratio between the absorption intensity of the protonated form to the deprotonated form (or vice versa) at a fixed wavelength. This paper mainly focuses on the measurements of absorption rather than those of emission, owing to their low cost of ownership and ease of handling and maintenance. In addition, the absorption spectrum can be used to detect additional peaks that reveal the presence of impurities in the molecules.
Herein, we give two examples from previous studies related to pH sensitivity of the absorption spectra of ruthenium complexes. For the sake of comparison, we calculated the on–off ratio of the reported complexes in a water solution only. The first study13 of complex [(dip)2Ru-mopip]2+ (dip = 4,7-diphenyl-1,10-phenanthroline and mopip = 2-phenyl-OCH3-imidazo[4,5-f][1,10]phenanthroline) [Fig. 1(a)] revealed an on–off factor of 2.33 at 500 nm in the absorption spectra. More recently, Baba's group14 presented results of pH-based sensing of bis(1,10-phenanthroline)ruthenium(II) complexes bearing hydroxy-substituted ligands [(phen)2Ru-(phen-OH)]2+ [Fig. 1(b)] that have an on–off factor of 1.60 at 480 nm.
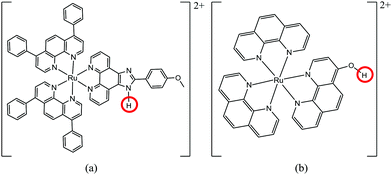 |
| | Fig. 1 Structure of [(dip)2Ru-mopip]2+ (a) and [(phen)2Ru-(phen-OH)]2+ (phen = 1,10′-phenanthroline and phen-OH = 4-hydroxy-1,10-phenanthroline) (b). The red circles show the protonated/deprotonated site of the structures. | |
As a result of these observations on pH sensitivity, we conclude that structurally, the protonatable or deprotonatable moieties of a ruthenium complex that are positioned closer to the ruthenium metal have a remarkably large effect on the pH sensitivity in absorption spectra. Therefore, in our endeavour to achieve greater pH sensitivity in the optical intensities, we have attempted to synthesize and characterize a novel ruthenium complex of the type [Ru(II)(bpy)2(phen-nBT)]2+, where bpy = 2,2′-bipyridine, phen = phenanthroline, and nBT = n-benzoylthiourea. The complex was developed as an on–off switch via the protonation or deprotonation of the BT molecules, and amino and carbonyl moieties are contained in the complex. It was designed with an elongated conjugated length in the structure, in which the protonatable and deprotonatable moieties were at a distance from the ruthenium metal. Such a design became important in finding the pH sensitivity of absorption.
We report the synthesis, characterization and effect of pH on the optical intensities of the complex [Ru(II)(bpy)2(phen-nBT)](PF6)2. The experimental results were analyzed and compared with quantum chemical calculations. The complex's response to protonation and deprotonation depends significantly on the site that was perturbed by the proton transfer. Thus, the assignment of the deprotonation site may be ambiguous in the complex. In addition, the effect also depends on the configuration of surrounding solvent molecules. The local atomic structures should be accurately taken into account in the theoretical models to calculate the absorption spectra of the complex in different environments. Therefore, we performed first-principles molecular dynamics (FPMD) simulations of the protonated, neutral and deprotonated complexes in aqueous solutions in which the solvent molecules were explicitly taken into account. Subsequently, by using the stable geometry taken from the FPMD simulations, we calculated the optical absorption spectra of the complex using time-dependent density functional theory (TDDFT) and compared them with the experimental results. We also calculated the first-order density response by TDDFT calculation in the linear response (-LR) regime to determine the electronic factors that affect the optical absorption intensities by protonation and deprotonation of the complex.
2. Experimental
2.1 Materials and chemicals
All the chemicals used in this study were of analytical-reagent grade and were used as received without further purification. RuCl3·3H2O and lithium chloride (LiCl) were purchased from Merck, 1,10-phenanthroline-5-amine and benzoyl chloride were obtained from Fluka (Malaysia) and 2,2′-bipyridine (bpy) was obtained from Aldrich Chemical Co.
2.2 Spectroscopic analyses
The infrared spectra were recorded on an Agilent Cary 630 spectrophotometer in the range of 4000–600 cm−1 in the ATR Diamond mode. The micro elemental analyses (C, H, N and S) were obtained with a Leco 932 elemental analyzer. The 1H and 13C NMR spectra were collected in deuterated dimethyl sulfoxide using a Bruker Ascend 400 spectrophotometer. The chemical shift values were scaled to parts per million (ppm) with reference to tetramethylsilane (TMS). The mass spectrum was recorded in a DIMS 2010 Shimadzu mass spectrometer. The magnetic susceptibility measurements were determined on a Sherwood Scientific MSB-AUTO, at room temperature (25.5 °C) using HgCo(SCN)4 as a calibrant.
2.2.1 Absorption and luminescence spectra.
The electronic absorption spectra were measured on a Perkin-Elmer Lambda 35 spectrophotometer in the range of 700–200 nm. The steady-state emission spectra were recorded on an Edinburgh FLS920 time-resolved fluorescence spectrometer at 298 K in H2O, using a 1 cm path length quartz cell. Time-correlated single-photon-counting (TCSPC) measurements were used for the luminescence decay of the ruthenium complex at different pHs (1–11). The luminescence quantum yields (φ) were calculated by employing eqn (1),15,16 using [Ru(bpy)3(PF6)2] as the standard.| | 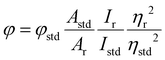 | (1) |
where φ and φstd are the quantum yield of the ruthenium complex and the standard quantum yields, respectively. The φstd of the [Ru(bpy)3(PF6)2] is 0.042. Ar and Astd (<0.1) are the solution absorbance at the excitation wavelength (λex = 455 nm), respectively. Ir and Istd are the integrated emission intensities, and ηr and ηstd are the refractive indices of the solvent. In addition, the radiative lifetime (τr) was also calculated by dividing the measured lifetime (τm) value with φ. The radiative (kr) and non-radiative (knr) rate constants were obtained using eqn (2) and (3).17| |  | (2) |
| |  | (3) |
To investigate the effect of pH on the absorbance and emission intensities, 0.6 mg of [Ru(II)(bpy)2(phen-nBT)](PF6)2 was dissolved in 100 mL of deionized water. The resulting solution was recorded at pH 7 (neutral). Five solutions with various pH values (pH = 1, 3, 5, 9, 11) were then prepared by adding drops of 0.1 M NaOH or 0.1 M HCl to the stock solution. The UV-vis spectra of the samples were recorded in the range of 600–300 nm. The emission spectra were then recorded in the range of 800–500 nm, with the excitation measurement being performed at the absorption maximum for the metal-to-ligand charge transfer (MLCT) transition band.
2.3 Computation details
In FPMD simulations, due to the high computational cost to calculate large numbers of complex clusters in an aqueous solution, the protonated, neutral and deprotonated ligands from their respective Ru(II) complexes were treated to determine their optimal structures. The atomic configurations of the ligands in the aqueous solutions were calculated by using the program package STATE (simulation tool for atom technology), which supports the FPMD within the density functional theory.18,19 A generalized gradient approximation (GGA) for the exchange–correlation potential as proposed by Perdew, Burke and Ernzerhof (PBE)20 was used. We also used the ultrasoft pseudopotentials to describe the electron–ion interactions in the system. Wave functions and the augmentation charge were expanded by a plane wave basis set with cutoff energies of 25 and 225 Ry, respectively. The MD time step was 2.4 femtoseconds (fs), and the total simulation time was 3.82 picoseconds (ps). Increasing the hydrogen mass by a factor of twelve in the calculation steps enables the time step to be increased from 0.5 fs to 2.4 fs.
After obtaining the equilibrium geometries of the ligand, we take the ligand and a number of water solvent molecules near the ligand to form a computational model of the Ru complex with the respective ligand for quantum chemical calculations. Their full geometry optimization and electronic structures were calculated by using the Gaussian 09 software package employing the DFT method with Becke's three-parameter hybrid functional and restricted Lee–Yang–Parr's gradient corrected functional (RB3LYP).21,22 The LANL2DZ basis set was used for Ru atoms and the correlation-consistent basis with polarized valence double zeta (pVDZ) for the remaining atoms. The vibrational frequency calculations were performed to assure that the optimized geometries represented the local minima with only positive eigenmodes. All the orbitals computed were displayed with an isovalue of 0.036 e1/2 Bohr−3/2. In addition, the optical absorption spectra with time-dependent DFT (TDDFT) were calculated following the reported method.23,24 100 singlet excitation energies were calculated with the TDDFT method considering the solvent effect (H2O) with the polarizable continuum model (PCM).25 The vertical excitation energies at the ground state in TDDFT appeared as excitation peaks in the calculated absorption spectra. The absorption spectra of the complex were simulated by using Gaussian broadening of the calculated oscillator strength at the respective excitation energy. Gaussian function with a bandwidth of 45 nm was used to match the experimentally observed absorption band shapes. Furthermore, a TDDFT calculation in the linear-response (-LR) regime was performed to clarify the origin for the experimentally observed linear dependence of absorption intensity upon pH. The excitation energy ωI and oscillator strength are determined from the square root of an eigenvalue of a matrix eigenvalue problem, as shown in eqn (4).
where
FI is an eigenvector to illustrate the contribution of occupied-unoccupied orbital pairs on the excitation and to describe the character of the excited state wave function.
23
2.4 Synthesis
2.4.1 Synthesis of the cis-ruthenium(II) bis(bipyridyl) dichloride, cis-Ru(bpy)2Cl2·H2O.
A cis-Ru(bpy)2Cl2·H2O was synthesized according to a previously reported preparation.26 The apparatus was thoroughly degassed and performed under a gentle stream of argon by using standard Schlenk techniques. RuCl3·3H2O (3.82 mmol) was mixed with bipyridine (7.65 mmol) and lithium chloride (23.59 mmol) in 15 mL of dimethylformamide and the mixture was brought to a refluxing temperature under stirring in a dark environment for 8 hours. The reaction mixture was cooled to room temperature prior to the addition of acetone and the violet reaction mixture was left at 0 °C overnight. A crude complex was recovered by filtration to give a black crystalline solid precipitate that was washed twice with cold distilled water (2 × 15 mL), followed by cold diethyl ether (2 × 15 mL), to yield a pure solid product. Yield: 68%. FTIR (cm−1): ν(C–H)aromatic 3031–3099, ν(C![[double bond, length as m-dash]](https://www.rsc.org/images/entities/char_e001.gif) C)aromatic 1670, 1560, 1458, 1417, 1311, 1265, ν(C–H)bends 765, 726. λmax, nm (CH3CN), ε (L mol−1 cm−1): 240 (19
C)aromatic 1670, 1560, 1458, 1417, 1311, 1265, ν(C–H)bends 765, 726. λmax, nm (CH3CN), ε (L mol−1 cm−1): 240 (19![[thin space (1/6-em)]](https://www.rsc.org/images/entities/char_2009.gif) 175), 297 (45383), 376 (8668), 550 (8987). 1H NMR (400 MHz, DMSO-d6), δ: 9.95 (d, 2H), 8.64 (d, 2H), 8.50 (d, 2H), 8.07 (t, 2H), 7.77 (t, 2H), 7.67 (t, 2H), 7.49 (d, 2H), 7.12 (t, 2H). 13C NMR (400 MHz, DMSO-d6) δ: 160.73, 158.58, 153.58, 152.56, 135.01, 133.90, 125.80, 25.64, 123.20, 122.96.
175), 297 (45383), 376 (8668), 550 (8987). 1H NMR (400 MHz, DMSO-d6), δ: 9.95 (d, 2H), 8.64 (d, 2H), 8.50 (d, 2H), 8.07 (t, 2H), 7.77 (t, 2H), 7.67 (t, 2H), 7.49 (d, 2H), 7.12 (t, 2H). 13C NMR (400 MHz, DMSO-d6) δ: 160.73, 158.58, 153.58, 152.56, 135.01, 133.90, 125.80, 25.64, 123.20, 122.96.
2.4.2 Synthesis of the N-benzoyl-N′(1,10-phenanthrolin-5-yl)-thiourea ligand (phen-nBT).
Ammonium thiocyanate (1.00 mmol) was added to a solution of benzoyl chloride (1.00 mmol) in acetone and the mixture was stirred for 20 minutes. A NH4Cl precipitate was removed by filtration and 1,10-phenanthroline-5-amine (1.0 mmol) in ethanol was added to the filtrate. The resulting solution was then stirred for 5 hours at 80 °C. A yellow precipitate was obtained and the solvents were evaporated under reduced pressure. The precipitate was thoroughly washed with cold acetone (20 mL), followed by cold ethanol (20 mL) to produce a white solid product. Yield: 65%. Anal. calc: C, 67.02; H, 3.94; N, 15.63, S, 8.95. Found: C, 66.61, H, 4.53, N, 15.78, S, 8.73. FTIR (cm−1): ν(N–H) 3332, ν(C–N)heterocyclic 1420, ν(C–H)stretching 3117–3002, ν(CC) 1623–1498, ν(CO) 1700, ν(CS) 1254. ν(C–N)aliphatic 1184, ν(C–H)bends 700–665. λmax, nm (CH2Cl2), ε (L mol−1 cm−1): 231 (74849), 270 (57513). Luminescence, wavelength, nm (CH2Cl2): 365 nm. 1H NMR (400 MHz, DMSO-d6), δ: 12.63 (s, 1H), 11.88 (s, 1H), 9.21–9.09 (m, 2H), 8.20 (s, 1H), 8.08 (m, 2H), 8.52 (dd, 2H), 7.87–7.78 (m, 2H), 7.70 (t, H), 7.59 (t, 2H). 13C NMR (400 MHz, DMSO-d6) δ: 182.49, 168.75, 150.54, 150.48, 137.37, 133.85, 133.71, 132.97, 132.69, 129.33, 128.99, 128.39, 126.32, 125.37, 123.77, 124.29, 124.01. Mass spectrum (m/z): 260.02 (260.05 theory), [phen-NH–CS − Na]+, 381.07 (381.09 theory), [phen-nBT + Na]+, 739.18 (739.18 theory), [2(phen-nBT) + Na]+.
2.4.3 Synthesis of the ruthenium(II) bipyridyl N-benzoyl-N′-(1,10-phenanthrolin-5-yl)-thiourea [Ru(II)(bpy)2(phen-nBT)](PF6)2.
The synthetic route to the ruthenium(II) complexes took a considerably longer time (6–10 hours) and required very drastic conditions such as boiling in ethylene glycol.27–29 Hence, an alternative approach to the Ru(II) complexes with a simple purification procedure was established. The reaction was performed under dark conditions and in inert argon gas. A 10% molar excess of n-benzoyl-n′-(1,10-phenantrolin-5-yl)thiourea (0.072 mmol) was dissolved in 10 mL of hot ethanol and was added to 0.064 mmol of cis-[Ru(bpy)2Cl2·2H2O] dissolved in 5 mL of hot distilled water (H2O). The mixture was heated for 3 hours at 100 °C. The solution was reduced to approximately one third of the original volume to give a precipitate. The solid was filtered off and then an excess amount of NH4PF6 (0.8 mmol) dissolved in cold distilled water was added into the filtrate, yielding a bright brown precipitate. The precipitate was then filtered through a Buchner funnel, washed with cold H2O (3 × 10 mL), followed by cold diethyl ether (3 × 10 mL) and dried in vacuo. Yield: 63%. Anal. calc: C, 45.25; H, 2.85; N, 10.55, S, 3.02. Found: C, 44.42, H, 3.35, N, 9.97, S, 2.58. FTIR (cm−1): ν(NH) 3408, ν(C–Nheterocyclic) 1446, ν(CC) 1587–1484, ν(CO) 1670, ν(CS) 1243. ν(uncoordinated PF6) 829. λmax, nm (H2O), ε (L mol−1 cm−1): 246 (15872), 284 (21870), 451 (4488). Luminescence, wavelength, nm (H2O): 617 nm. 1H NMR (400 MHz, DMSO-d6), δ: 12.88 (s, 1H), 12.05 (s, 1H), 8.92–8.81 (m, 4H), 8.76 (d, 1H), 8.70 (s, 1H), 8.23 (t, 2H), 8.20–8.10 (m, 4H), 8.11–8.05 (m, 2H), 7.97–7.88 (m, 2H), 7.85 (d, 2H), 7.75–7.65 (m, 2H), 7.64–7.58 (m, 4H), 7.57–7.47 (m, 2H), 7.45–7.37 (m, 2H). 13C NMR (400 MHz, DMSO-d6), δ: 182.40, 168.99, 157.29, 157.09, 153.16, 147.59, 146.35, 138.48, 135.48, 133.88, 133.28, 132.49, 130.13, 129.35, 129.02, 128.52, 127.17, 125.73, 125.00. Mass spectrum (m/z): 917.05 (917.10 theory), [Ru(II)(bpy)2(phen-nBT)(PF6)]+, 771.09 (771.10 theory), [Ru(II)(bpy)2(phen)-nBT + H]+.
3. Result and discussion
3.1 General
An outline of the synthetic route to complex Ru(bpy)2Cl2, ligand phen-nBT and [Ru(II)(bpy)2(phen-nBT)](PF6)2 is presented in Fig. 2 and 3 shows the protonated, neutral and deprotonated complex structures. The complex [Ru(II)(bpy)2(phen-nBT)](PF6)2 was obtained by an in situ reaction of cis-[Ru(bpy)2Cl2·2H2O] with ligand benzoyl-n′-(1,10-phenantrolin-5-yl)thiourea. The structures of the ligand and complex were elucidated based on elemental analysis and IR, UV-Vis, mass spectrometry, and 1H and 13C NMR spectroscopic measurements. The ruthenium complexes exhibited the expected magnetic susceptibility value of 0 suggesting that the Ru(II) metal centre adopts a diamagnetic d6 configuration. This observation was in agreement with the previously reported magnetic properties of similar [Ru(bpy)2(thio-based imine)](ClO4)2 complexes.30
 |
| | Fig. 2 Schematic reactions for the synthesis of Ru(bpy)2Cl2 (a), ligand phen-nBT (b) and complex [Ru(II)(bpy)2(phen-nBT)](PF6)2 (c). | |
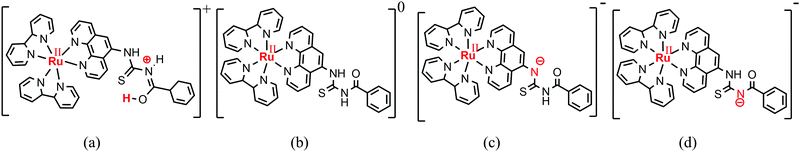 |
| | Fig. 3 Structures of protonated (a), neutral (b) and deprotonated [N1 (c) and N2 (d)] [Ru(II)(bpy)2(phen-nBT)](PF6)2 molecules. | |
3.2 Experiment on absorption and luminescence spectroscopy
The Ru(II) complex displayed strong absorption bands in the ultra-violent region at 246 nm (ε = 15872 L mol−1 cm−1) and 284 nm (ε = 21870 L mol−1 cm−1) that were unambiguously attributed to the π → π* ligand-centred (LC) transitions. This transition basically denotes the excitation of electrons from filled π to vacant π* orbitals of the bpy, phen and nBT moieties.31 The complex also exhibited an absorption band in the visible region at 451 nm (ε = 4488 L mol−1 cm−1) that was attributed to the spin-allowed Ru(II)(dπ)6 → bipy(π*), Ru(II)(dπ)6 → phen(π*) and Ru(II)(dπ)6 → BT(π*) MLCT transitions.32,33 Excitation of the complex at its MLCT wavelength typically leads to visible light emission, which shows an asymmetric band at 617 nm. This emission band was assigned to radioactive transitions from a Ru(II)(dπ)6 → π* (ligand) transition.32 Typically, the emission energy of the Ru(II) complex will be smaller than the energy of the first absorption peak, as the emission of the ruthenium complex is expected to stem from its low-energy triplet state which is phosphorescence, rather than the excited singlet state.34
3.2.1 The effect of pH on the spectroscopic properties.
In acid–base equilibrium, the intensity of emission and/or absorption is influenced by pH variation, irrespective of whether the pH affects the ground state or the excited state. If the excited state of the complex is affected by the pH changes, the emission spectra will notably change with the pH and vice versa.11Fig. 4 depicts the absorption spectra of the ruthenium complex in different pH values and the absorption data of the complex over the pH range of 1 to 11 have been compiled and shown in Table 1. The absorption spectrum of the Ru(II) complex in water exhibits a strong MLCT absorption band at 455 nm that decreases with increasing pH. Four distinct isobestic points were observed which can be divided into two sets – 394 and 505 nm; and 406 and 484 nm. The two sets of isobestic points may suggest that there coexist 2 configurations each for acidic (3–5) and basic (9–11) pH. The result shows that the absorption intensity was high in an acidic medium (low pH) and the intensity was at least twice that of the basic condition (high pH). This sensitivity stemmed from the long-distance transmission of electronic interactions in the complex and these observations will be explained later from the TDDFT-LR calculations.
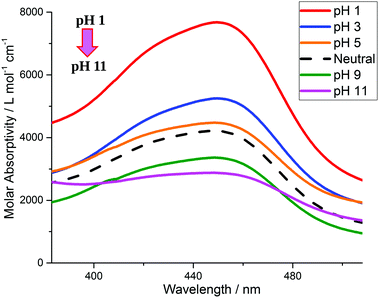 |
| | Fig. 4 Changes in absorption intensity of [Ru(II)(bpy)2(phen-nBT)](PF6)2 in water upon pH changes. The on–off ratio of 2.68 at 455 nm is the highest among those for all of the reported Ru(II) complexes. | |
Table 1 Absorption and luminescence data for Ru(II) complexes in aqueous solution at different pH values
| Complex |
Absorption (298 K), λabs = 455 nm |
Luminescence (298 K), λem = 620 nma |
|
ε (L mol−1 cm−1) |
φ
em
|
τ
r
(μs) |
τ
m
(μs) |
k
r
(μs−1) |
k
nr
(μs−1) |
|
Excitation at 455 nm.
Quantum yield of complex.
Radiative lifetime.
Measured lifetime.
Radiative rate constants.
Non-radiative rate constants.
|
| pH 1 |
7738 |
0.044 |
0.501 |
11.39 |
0.088 |
1.908 |
| pH 3 |
5292 |
0.041 |
0.446 |
10.88 |
0.092 |
2.150 |
| pH 5 |
4508 |
0.039 |
0.419 |
10.74 |
0.093 |
2.294 |
| Neutral |
4488 |
0.038 |
0.391 |
10.29 |
0.097 |
2.460 |
| pH 9 |
3392 |
0.032 |
0.339 |
10.59 |
0.094 |
2.855 |
| pH 11 |
2887 |
0.027 |
0.262 |
9.70 |
0.103 |
3.714 |
We also conducted a luminescence experiment to determine the behaviour of the emission of the complex in water at various pHs (1–11). Fig. 5(a) shows the quenching of the emission spectra of the complex upon pH changes. The maximum peak of the emission intensity is centred at 620 nm and the intensities decreased significantly as the pH increased from 1 to 11, in consonance with the absorption spectral behaviour. The complex shows a stronger emission at low pH and this was attributed to the reduction in the intramolecular reductive quenching effect from the lone-pair electrons of the oxygen atom, as the availability of the lone-pair of electrons for the electron-transfer process is reduced by protonation.35 In addition, there is a significant decrease in the emission lifetime and quantum yields as the pH increases. A longer emission lifetime was observed in a low pH solution due to a deceleration in the thermally activated decay of the low-lying MLCT state to the short-lived metal centre state as a consequence of the stabilization of the MLCT and the destabilization of the metal-centred (MC) state.36 The ruthenium complex is excited to singlet 1MLCT states upon optical excitation and will efficiently cross-over to the light emitting triplet 3MLCT (phosphorescence) state, which then returns to the ground state either by radiative (kr) or non-radiative (knr) decay processes. The values of φ, τr, τm, kr and knr at different pH (1–11) are catalogued and shown in Table 1. The emission quantum yield decreases as the pH increases owing to the increase in knr and decrease in kr. The deprotonated complex decays more efficiently and rapidly to the ground state by a deactivation pathway compared to the protonated complex, resulting in a shorter emission lifetime and shorter quantum yields. The emission decay profile of complexes at different pH (1–11) is shown in Fig. 5(b).
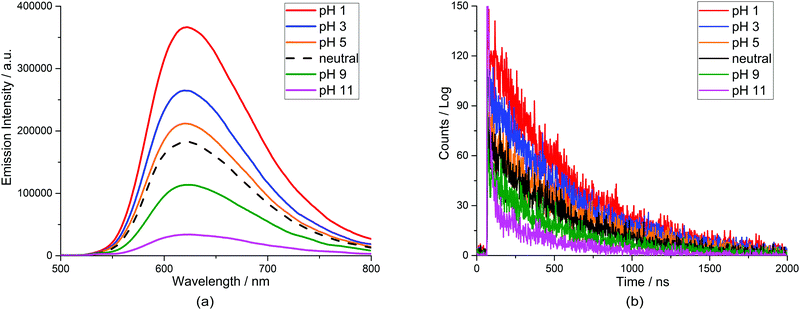 |
| | Fig. 5 (a) Emission spectra of [Ru(II)(bpy)2(phen-nBT)](PF6)2 in water as a function of pH. (b) Emission lifetime decay of the complex in water upon pH changes. | |
3.3 Theoretical calculations
3.3.1 Structural optimization.
To illustrate the electronic structure of the complex under protonated, neutral and deprotonated conditions, DFT and TDDFT calculations were performed. First, the STATE code was used to determine the local geometries of the protonated, neutral and deprotonated ligands in aqueous solution, in which the solvation effect (H2O) was explicitly taken into consideration by including 96 water molecules in a periodic box of 37.8 Å  22.7 Å
  22.7 Å. For the protonated and neutral ligands, the proton dissociation did not occur and the acidic proton remained at the original site during the molecular dynamics simulations. The protonation site in the optimized structure was identified at the carbonyl oxygen atom. However, there are two possibilities for the deprotonation of the ligands in which the deprotonated site might occur at one of the two N atoms in the structure. Hence, we investigated the preferred deprotonation site by considering the two deprotonated ligands. Two deprotonated ligand structures (phen-nBT_N1 and phen-nBT_N2) were introduced in an aqueous solution, respectively [Fig. 6(a) and (b)]. To observe the relative stability of both the ligands, we calculated the total and average energy of the two geometries during the FPMD simulations and illustrated them as a function of time in Fig. 7. A small difference of only 0.04 eV in the average energy was observed and this indicates that both of the deprotonated structures may coexist at the equilibrium.
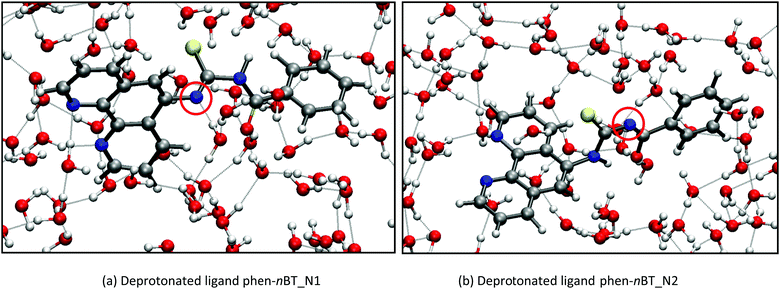 |
| | Fig. 6 Molecular dynamics (MD) simulations of a phen-nBT_N1 (a) and phen-nBT_N2 (b) ligand in aqueous solution. The red circle shows the deprotonated site of the nitrogen atom. | |
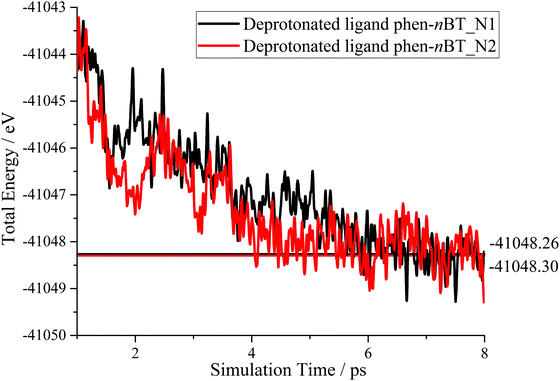 |
| | Fig. 7 Energy level diagrams of the ligands. The horizontal line indicates average energy obtained. | |
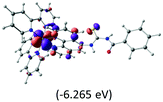
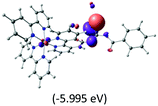
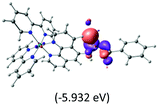
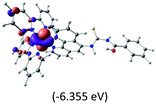
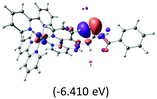
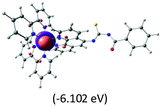
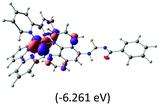
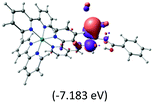
The optimized structures of the protonated, neutral and both deprotonated (phen-nBT_N1 and phen-nBT_N2) ligands with eight neighbouring H2O molecules at the respective minimums of the potential energy surface were used to be bound with ruthenium bipyridine to form the corresponding complexes. The molecular structures of the complexes [Ru(II)(bpy)2(phen-nBT)·8H2O]1+ (protonated), [Ru(II)(bpy)2(phen-nBT)·8H2O]0 (neutral) and [Ru(II)(bpy)2(phen-nBT)·8H2O]1− (deprotonated_N1 and deprotonated_N2) were then optimized by using DFT calculation with the B3LYP exchange–correlation functional. Consequently, the protonation site in the optimized structure was identified at the –CO– atom, whereas deprotonation occurred at the –N– atom in the complex. The optimized molecular structures of the protonated, neutral, deprotonated_N1 and deprotonated_N2 complexes are shown in Fig. 8.
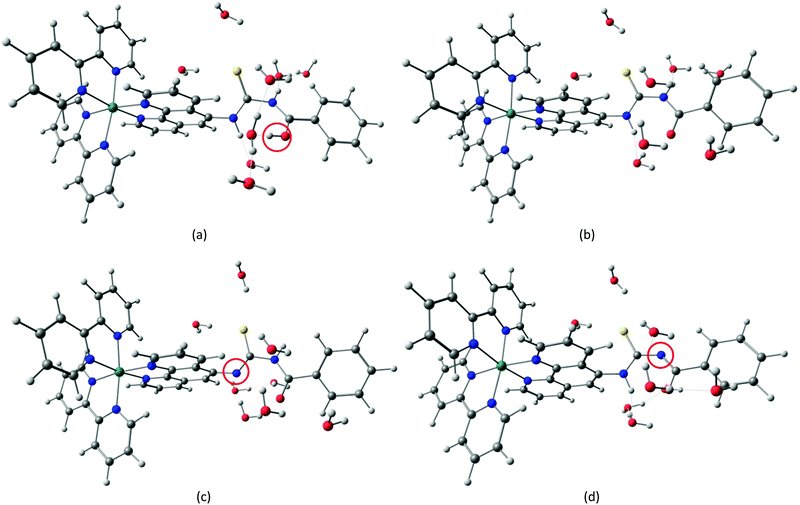 |
| | Fig. 8 Optimized molecular structure of protonated (a), neutral (b), deprotonated_N1 (c) and deprotonated_N2 (d) complexes in aqueous solution. The red circle shows the protonated and deprotonated sites for the complexes. | |
3.3.2 Theoretical absorption spectra.
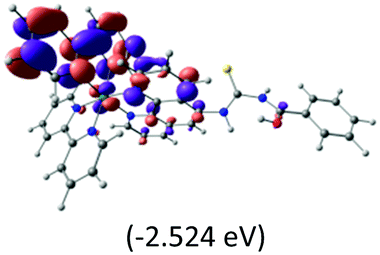
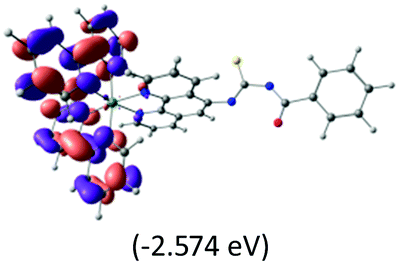
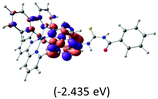
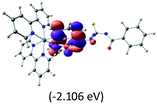
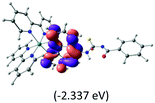
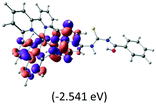
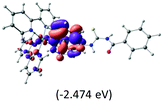
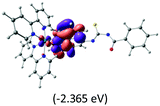
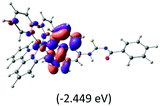
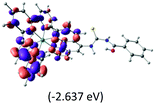
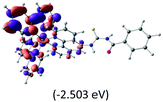
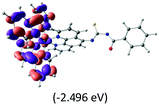
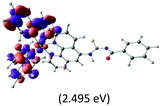
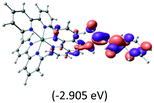
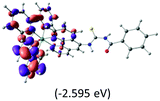
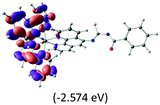
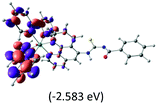
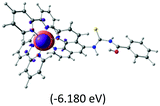
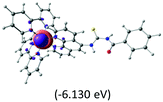
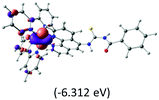
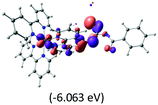
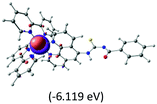
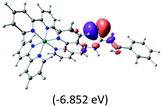
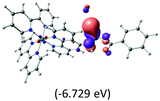
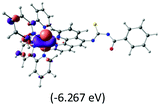
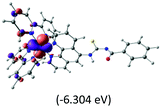
The calculated lowest-energy absorption bands are presented in the visible region (380–440 nm) in Fig. 9. As shown in Fig. 9, the protonated complex has a stronger absorption intensity than the deprotonated one, agreeing well with the experimental observation. Table 2 shows the frontier molecular orbital isosurface of dominant transitions that comprise the lowest-energy absorption bands.
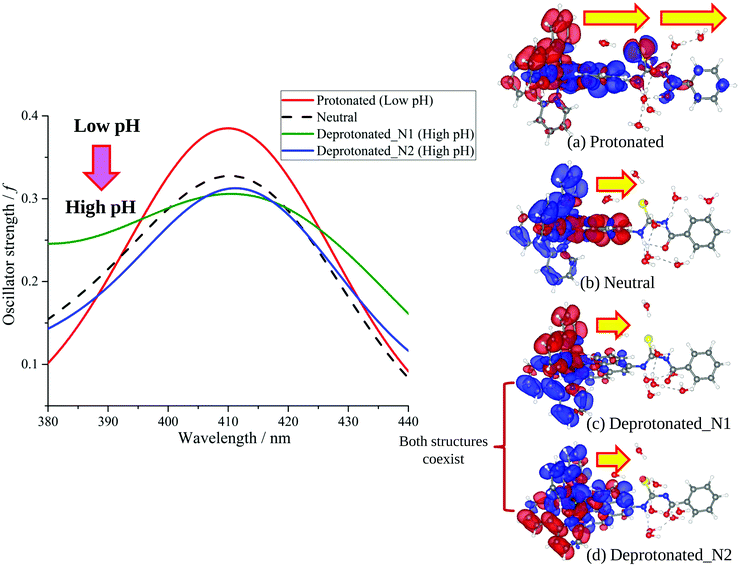 |
| | Fig. 9 Calculated absorption spectra of protonated (a), neutral (b), deprotonated_N1 (c) and deprotonated_N2 (d) complexes and isosurfaces displaying the first-order density response on the basis of the Kohn–Sham orbitals with positive and negative regions shown in blue and red, respectively. The transition dipole of each complex is qualitatively described by the arrows. | |
Table 2 Isosurfaces of frontier molecular orbitals (from HOMO−4 to LUMO+3), which dominate transitions corresponding to the lowest-energy absorption, and the orbital energy values for protonated, neutral and deprotonated (N1 and N2) complexes. Water molecules in complexes are omitted for brevity
| Orbitals |
Protonated |
Neutral |
Deprotonated_N1 |
Deprotonated_N2 |
| LUMO+3 |

|
|
|
|
| LUMO+2 |
|
|
|
|
| LUMO+1 |
|
|
|
|
| LUMO |
|
|
|
|
| HOMO |
|
|
|
|
| HOMO−1 |
|
|
|
|
| HOMO−2 |
|
|
|
|
| HOMO−3 |
|
|
|
|
| HOMO−4 |
|
|
|
|
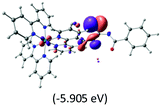
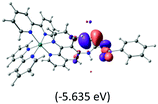
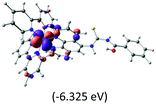
The three highest occupied MOs (HOMO, HOMO−1 and HOMO−2) for the protonated and neutral complexes essentially have ruthenium d(t2g) characteristics. Nonetheless, HOMO and HOMO−1 are mainly composed of the π-orbital of the [–C(S)–N–C(phen)–] and [–C(S)–N–C(O)–] moieties for the deprotonated_N1 and deprotonated_N2 complexes, respectively. This has been attributed to the increase in the electrostatic potential of the carbon atom (phen), carbonyl and thiocarbonyl moieties upon deprotonation of amino group in the complexes. As a result, the π-orbitals of the [–C(S)–N–C(phen)–] and [–C(S)–N–C(O)–] moieties are destabilized. However, different deprotonated sites of the amino group in the complexes made little difference to the energy level of the π-orbital, where the deprotonated_N2 complex shows slightly higher energy (−5.635 eV) compared to the deprotonated_N1 complex (−5.905 eV). As for the protonated complex, the dRu orbitals (dxy, dxz and dyz) are predominantly located in the frontier HOMO−2, HOMO−3 and HOMO−4 orbitals. However, the LUMO is altered from π* (bpy) to π* of the benzoylthiourea moiety by protonation. This is due to the significant stabilization of the π* orbitals by protonation of the carbonyl moiety. In contrast, the LUMO and three subsequent virtual orbitals for the deprotonated and neutral complexes are essentially π* of the bpy and phen moieties, hence, the energy levels of the LUMO orbitals are almost similar. It is interesting to note that protonation strongly affects the LUMO orbitals, whereas deprotonation affects the HOMO orbitals. Thus, the frontier molecular orbitals of the lower-energy occupied orbitals in the protonated complex and the frontier molecular orbitals of the lower-energy unoccupied orbitals in deprotonated complexes are similar to those of the neutral complex.
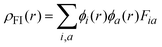
Fig. 9 shows the calculated absorption spectra and the density response mapped over the electronic isodensity surface for the protonated, neutral and deprotonated complexes. As mentioned above, the trend in the calculated spectra agrees very well with the experimental observation. The protonated complex displays a higher intensity in the absorption, whereas both the deprotonated complexes show a relatively lower absorption band of similar intensities. The experimentally observed hyperchromic effect in the absorption spectra at low pH was demonstrated by the theoretical calculation to be related to the large transition dipole moment of the molecules. This is ascribed to the high perturbation electronic density of the molecule oscillators between the electronic states. In accordance with published work by Yanagisawa et al.,37 the first order density response equation [eqn (5)] was revealed to be the most appropriate to illustrate the transition dipole moments.
| |  | (5) |
Eqn (5) describes the density response where ρFI are the final and initial states of the density response, i and a indicate occupied (HOMO) and unoccupied (LUMO) Kohn–Sham orbitals, respectively, and Fia depicts the eigenvector component of the transition between ϕi and ϕa. The density responses of the complexes are calculated on the basis of the highest oscillator strength of the calculated optical spectra. There are smaller albeit noticeable differences in the isosurface structures of the protonated, neutral and deprotonated complexes. We found that the electronic charge was distributed over almost the entire ligand in the protonated complex [see Fig. 9(a)]. In particular, the stabilization of electrostatic potential at the carbonyl moiety upon protonation leads to a higher charge distribution on the protonated molecule. Therefore, a greater distribution of the density response in the protonated complex leads to a larger transition dipole moment and hence a higher absorption intensity. Likewise, the localization of the density response in the neutral and both the deprotonated complexes is in accordance with the destabilization of the electrostatic potential at the carbonyl moiety. The electronic charge is distributed more equally in the neutral complex and leads to a slightly greater absorption intensity compared with the deprotonated complexes. We believed that the position of the protonatable or deprotonatable moiety in the ruthenium complex inevitably exerts an influence on the pH sensitivity of absorption. The stabilization of the electrostatic potential at the carbonyl moiety by protonation accelerates a wider distribution of response charge of the molecule and thus generates a hyperchromic effect on the MLCT absorption band at a low pH.
4. Conclusion
We reported experimental and theoretical investigations on the photophysical properties of novel ruthenium bipyridine complexes bearing a phenanthroline moiety with a benzoylthiourea unit. A simple synthetic route and purification protocol for the ruthenium complexes was demonstrated. Owing to the presence of the functionalised benzoylthiourea with the carbonyl and amino moieties, the complex can exist in three different forms and can readily be protonated and deprotonated under acidic and basic conditions, respectively. The experimental result shows a remarkable improvement in the absorbance response of the complex in the pH range of 1–11. Therefore, a theoretical study using DFT and TDDFT calculations was undertaken on the absorbance behaviour of the complex in the protonated and deprotonated forms to account for the observations. The FPMD simulations revealed that the protonation site in the optimized structure was at the carbonyl oxygen atom, whereas the coexistence of the two deprotonation structures was observed at the equilibrium. The observed trends in the absorption spectra can effectively be reproduced by TDDFT in the linear-response regime using complex geometries optimized using FPMD simulations. Theoretical analyses determined the relationship between the distribution of the electrostatic potential and the absorption intensities under acidic and basic conditions. It was observed that a delocalized distribution of the density response leads to a higher absorption intensity. It is worth underlining that the elongation of the conjugated path length in the structure of the phenanthroline-fused benzoylthiourea moiety in the ruthenium bipyridine complex eventually results in greater pH sensitivity in the absorption spectra. The present communication aims to provide new insights and useful information for the design of new materials for an absorption-based pH sensor.
Conflicts of interest
There are no conflicts to declare.
Acknowledgements
The authors would like to acknowledge financial support by Quantum Engineering Design Course (QEDC) Short-Term Research Program by Japan Student Services Organization (JASSO). This work has partly been supported by Grant-in-Aid for Scientific Research on Innovative Areas “3D Active-Site Science” (No. 26105010 and 26015011) from MEXT, Japan and Ministry of Science Technology and Innovation (06-01-02-SF1001) and Ministry of Higher Education (ERGS/1/2013/TK07/UKM/02/2), Malaysia.
References
- H. J. Kim, Y. C. Jeong, J. Heo, J. Il Rhee and K. Hwang, A Wide-range Luminescent, pH Sensor Based on Ruthenium(II) Complex, Bull. Korean Chem. Soc., 2009, 30, 539–540 CrossRef CAS.
- E. C. Constable, C. E. Housecroft, A. C. Thompson, P. Passaniti, S. Silvi, M. Maestri and A. Credi, pH-sensitive Ru(ii) and Os(ii) bis(2,2′:6′,2′′-terpyridine) complexes: A photophysical investigation, Inorg. Chim. Acta, 2007, 360, 1102–1110 CrossRef CAS.
- H. Nam, M. Jeong, O. J. Sohn, J. Il Rhee, J. Oh, Y. Kim and S. Lee, Synthesis of phenanthroline derivative by Suzuki coupling reaction and the use of its ruthenium complex as an optical pH sensor, Inorg. Chem. Commun., 2007, 10, 195–198 CrossRef CAS.
- G. Liebsch, I. Klimant, B. Frank, G. Holst and O. S. Wolfbeis, Luminescence lifetime imaging of oxygen, pH, and carbon dioxide distribution using optical sensors, Appl. Spectrosc., 2000, 54, 548–559 CrossRef CAS.
- A. S. Kocincova, S. M. Borisov, C. Krause and O. S. Wolfbeis, Fiber-optic microsensors for simultaneous sensing of oxygen and pH, and of oxygen and temperature, Anal. Chem., 2007, 79, 8486–8493 CrossRef CAS PubMed.
- E. Coronado, J. R. Galán-Mascarós, C. Martí-Gastaldo, E. Palomares, J. R. Durrant, R. Villar, M. Gratzel and M. K. Nazeeruddin, Reversible colorimetric probes for mercury sensing, J. Am. Chem. Soc., 2005, 127, 12351–12356 CrossRef CAS PubMed.
- M. G. Lobello, S. Fantacci, A. Credi and F. De Angelis, PH-Sensitive Bis(2,2′:6′,2′′-terpyridine)ruthenium(II) Complexes – A DFT/TDDFT Investigation of Their Spectroscopic Properties, Eur. J. Inorg. Chem., 2011, 1605–1613 CrossRef CAS.
- S. Pizarro, M. Gallardo, C. Leyton, E. Castro, F. Gajardo and A. Delgadillo, Effect of pH in the photoluminescence of a ruthenium complex featuring a derivative of the ligand pyrazine[2,3-f][1,10]-phenanthroline, Spectrochim. Acta, Part A, 2015, 146, 61–65 CrossRef CAS PubMed.
- S. Klein, W. G. Dougherty, W. S. Kassel, T. J. Dudley and J. J. Paul, Structural, Electronic and Acid/Base Properties of [Ru(bpy)2(bpy(OH)2)]2+ (bpy = 2,2′-bipyridine, bpy(OH)2 = 4,4′-dihydroxy-2,2′-bipyridine), Inorg. Chem., 2011, 50, 2754–2763 CrossRef CAS PubMed.
- Z. B. Zheng, S. Y. Kang, X. Yi, N. Zhang and K. Z. Wang, Off–on–off pH luminescence switching and DNA binding properties of a free terpyridine-appended ruthenium complex, J. Inorg. Biochem., 2014, 141, 70–78 CrossRef CAS PubMed.
- J. C. Ellerbrock, S. M. McLoughlin and A. I. Baba, The effect of pH on the emission and absorption spectra of a ruthenium complex, Inorg. Chem. Commun., 2002, 5, 555–559 CrossRef CAS.
- B. Jing, T. Wu, C. Tian, M. Zhang and T. Shen, pH-Dependent Luminescence of Ruthenium(II) Polypyridine Complexes, Bull. Chem. Soc. Jpn., 2000, 73, 1749–1755 CrossRef CAS.
- F. Gao, X. Chen, Q. Sun, J. N. Cao, J. Q. Lin, Q. Z. Xian and L. N. Ji, Boosting the sensitivity of pH responsible luminescent switches of polypyridyl ruthenium(II) complexes by structural design, Inorg. Chem. Commun., 2012, 16, 25–27 CrossRef CAS.
- A. I. Baba, S. Atiga and A. Ocheni, pH dependence of absorption and emission spectra of Ru(phen)2(phenOH)2+(PF6)2 complex, Adv. Nat. Sci., 2016, 9, 10–15 Search PubMed.
- S. Baitalik and U. Flo, Mononuclear and Binuclear Ruthenium (II) Complexes Containing 2,2′-Bipyridine or Spectroscopy, and Proton-Coupled Redox Activity, Inorg. Chem., 1999, 38, 3296–3308 CrossRef CAS PubMed.
- S. Dutta, S. Baitalik, M. Ghosh, U. Flörke and K. Nag, Structural, photophysical and electrochemical studies of [RuN6]2+ complexes having polypyridine
and azole mixed-donor sites, Inorg. Chim. Acta, 2011, 372, 227–236 CrossRef CAS.
- K. Nakamaru, Synthesis, luminescence quantum yields, and lifetimes of trischelated ruthenium(II) mixed-ligand complexes including 3,3′-dimethyl-2,2′-bipyridyl, Bull. Chem. Soc. Jpn., 1982, 55, 2697–2705 CrossRef CAS.
- Y. Morikawa, Adsorption geometries and vibrational modes of C2H2 on the Si(001) surface, Phys. Rev. B: Condens. Matter Mater. Phys., 2001, 63, 033405 CrossRef.
- Y. Morikawa, H. Ishii and K. Seki, Theoretical study of n-alkane adsorption on metal surfaces, Phys. Rev. B: Condens. Matter Mater. Phys., 2004, 69, 41403 CrossRef.
- J. P. Perdew, K. Burke and M. Ernzerhof, Generalized gradient approximation made simple, Phys. Rev. Lett., 1996, 78, 1396 CrossRef.
- A. D. Becke, Density-functional thermochemistry. III. The role of exact exchange, J. Chem. Phys., 1993, 98, 5648 CrossRef CAS.
- C. Lee, W. Yang and R. G. Parr, Development of the Colle-Salvetti correlation-energy formula into a functional of the electron density, Phys. Rev. B: Condens. Matter Mater. Phys., 1988, 37, 785–789 CrossRef CAS.
- C. Jamorski, M. E. Casida and D. R. Salahub, Dynamic polarizabilities and excitation spectra from a molecular implementation of time-dependent density-functional response theory: N2 as a case study, J. Chem. Phys., 1996, 104, 5134 CrossRef CAS.
- M. E. Casida, C. Jamorski, K. C. Casida and D. R. Salahub, Molecular excitation energies to high-lying bound states from time-dependent density-functional response theory: Characterization and correction of the time-dependent local density approximation ionization threshold Mark, J. Chem. Phys., 1998, 108, 4439 CrossRef CAS.
- M. Cossi, G. Scalmani, N. Rega and V. Barone, New developments in the polarizable continuum model for quantum mechanical and classical calculations on molecules in solution, J. Chem. Phys., 2002, 117, 43–54 CrossRef CAS.
- B. P. Sulliva, D. J. Salmon and T. J. Meyer, Mixed Phosphine 2,2′-Bipyridine Complexes of Ruthenium, Inorg. Chem., 1978, 17, 3334–3341 CrossRef.
- G. Orellana and M. L. Quiroga, Spectroscopic, Electrochemical, and Kinetic Characterization of New Ruthenium(II) Tris-chelates Containing Five-Membered Heterocyclic Moieties, Helv. Chim. Acta, 1987, 70, 2073–2086 CrossRef CAS.
- B. Sun, J. Chu, Y. Chen, F. Gao, L. N. Ji and H. Chao, Synthesis, characterization, electrochemical and photophysical properties of ruthenium(II) complexes containing 3-amino-1,2,4-triazino[5,6-f]-1,10-phenanthroline, J. Mol. Struct., 2008, 890, 203–208 CrossRef CAS.
- B. Senthamarai and D. Suresh, Synthesis and Characterization of mono-, di- and trinuclear Ruthenium(II) complexes, Int. J. Sci. Eng. Res., 2014, 5(4), 84–89 Search PubMed.
- D. Bhattacharyya, S. Chakraborty, P. Munshi and G. K. Lahiri, Ruthenium(II/III) bipyridine complexes incorporating thiol-based imine functions. Synthesis, spectroscopic and redox properties, Polyhedron, 1999, 18, 2951–2959 CrossRef CAS.
- C. Dragonetti, L. Falciola and P. Mussini, of substituents on functionalized 1,10-phenanthroline in controlling the emission properties of cationic iridium(III) complexes of interest for electroluminescent devices, Inorg. Chem., 2007, 46, 8533–8547 CrossRef CAS PubMed.
- D. Saha, S. Das, S. Mardanya and S. Baitalik, Structural characterization and spectroelectrochemical, anion sensing and solvent dependence photophysical studies of a bimetallic Ru(II) complex derived from 1,3-di(1H-imidazo[4,5-f][1,10]phenanthroline-2-yl)benzene, Dalton Trans., 2012, 41, 8886–8898 RSC.
- N. A. F. Al-Rawashdeh, S. Chatterjee, J. A. Krause and W. B. Connick, Ruthenium bis-diimine complexes with a chelating thioether ligand: Delineating 1,10-phenanthrolinyl and 2,2′-bipyridyl ligand substituent effects, Inorg. Chem., 2014, 53, 294–307 CrossRef CAS PubMed.
- E. Badaeva, V. V. Albert, S. Kilina, A. Koposov, M. Sykora and S. Tretiak, Effect of deprotonation on absorption and emission spectra of Ru(II)-bpy complexes functionalized with carboxyl groups, Phys. Chem. Chem. Phys., 2010, 12, 8902–8913 RSC.
- F. Yu, C. Shen, T. Zheng, W. K. Chu, J. Xiang, Y. Luo, C. C. Ko, Z. Q. Guo and T. C. Lau, Acid-Base Behaviour in the Absorption and Emission Spectra of Ruthenium(II) Complexes with Hydroxy-Substituted Bipyridine and Phenanthroline Ligands, Eur. J. Inorg. Chem., 2016, 3641–3648 CrossRef CAS.
- L. Troian-Gautier and C. Moucheron, Ruthenium(II) complexes bearing fused polycyclic ligands: From fundamental aspects to potential applications, Molecules, 2014, 19, 5028–5087 CrossRef PubMed.
- S. Yanagisawa, T. Yasuda, K. Inagaki, Y. Morikawa, K. Manseki and S. Yanagida, Intermolecular interaction as the origin of red shifts in absorption spectra of zinc-phthalocyanine from first-principles, J. Phys. Chem. A, 2013, 117, 11246–11253 CrossRef CAS PubMed.
|
| This journal is © the Owner Societies 2017 |

 Open Access Article
 This Open Access Article is licensed under a
  ab,
Susumu
Yanagisawa
ab,
Susumu
Yanagisawa


 22.7 Å
  22.7 Å. For the protonated and neutral ligands, the proton dissociation did not occur and the acidic proton remained at the original site during the molecular dynamics simulations. The protonation site in the optimized structure was identified at the carbonyl oxygen atom. However, there are two possibilities for the deprotonation of the ligands in which the deprotonated site might occur at one of the two N atoms in the structure. Hence, we investigated the preferred deprotonation site by considering the two deprotonated ligands. Two deprotonated ligand structures (phen-nBT_N1 and phen-nBT_N2) were introduced in an aqueous solution, respectively [Fig. 6(a) and (b)]. To observe the relative stability of both the ligands, we calculated the total and average energy of the two geometries during the FPMD simulations and illustrated them as a function of time in Fig. 7. A small difference of only 0.04 eV in the average energy was observed and this indicates that both of the deprotonated structures may coexist at the equilibrium.