 Open Access Article
Creative Commons Attribution 3.0 Unported Licence
Quantifying the exchange coupling in linear copper porphyrin oligomers†
Sabine
Richert
 *a,
Ilya
Kuprov
 b,
Martin D.
Peeks
 c,
Elizaveta A.
Suturina
 b,
Jonathan
Cremers
c,
Harry L.
Anderson
 c and
Christiane R.
Timmel
 *a
*a
aCentre for Advanced Electron Spin Resonance (CAESR), University of Oxford, South Parks Road, Oxford, OX1 3QR, UK. E-mail: christiane.timmel@chem.ox.ac.uk
bDepartment of Chemistry, University of Southampton, Highfield Campus, Southampton, SO17 1BJ, UK
cChemistry Research Laboratory, University of Oxford, Mansfield Road, Oxford, OX1 3TA, UK
First published on 9th June 2017
Abstract
Linear π-conjugated porphyrin oligomers are of significant current interest due to their potential applications as molecular wires. In this study we investigate electronic communication in linear butadiyne-linked copper porphyrin oligomers by electron paramagnetic resonance (EPR) spectroscopy via measurement of the exchange interaction, J, between the copper(II) centers. The contributions of dipolar and exchange interactions to the frozen solution continuous wave (cw) EPR spectra of the compounds with two or more copper porphyrin units were explicitly accounted for in numerical simulations using a spin Hamiltonian approach. It is demonstrated that a complete numerical simulation of the powder spectrum of a large spin system with a Hamiltonian dimension of 26![[thin space (1/6-em)]](https://www.rsc.org/images/entities/char_2009.gif) 244 and beyond can be made feasible by simulating the spectra in the time domain. The exchange coupling in the Cu2 dimer (Cu⋯Cu distance 1.35 nm) is of the order of tens of MHz (Ĥ = −2JS1·S2) and is strongly modulated by low-energy molecular motions such as twisting of the molecule.
244 and beyond can be made feasible by simulating the spectra in the time domain. The exchange coupling in the Cu2 dimer (Cu⋯Cu distance 1.35 nm) is of the order of tens of MHz (Ĥ = −2JS1·S2) and is strongly modulated by low-energy molecular motions such as twisting of the molecule.
1 Introduction
The through-bond inter-electron exchange interaction, J, between two spin centers is a convenient measure of long-range electronic communication. It relies on orbital overlap and can therefore be regarded as a measure of the extent of electron spin delocalization.1 Its magnitude reflects the orbital structure of complex molecules as well as their conformational state. Depending on the conjugation of the electronic π-system, significant exchange couplings have been detected for distances as large as 3.6 nm.2,3Understanding the factors influencing the coupling between two spin centers, and therefore electronic communication, is of paramount importance for numerous applications in the fields of spintronics, molecular electronics and photovoltaics.4–7 Depending on the magnitude of the interaction, different techniques can be used for its characterization, including the measurement of the magnetic susceptibility and electron paramagnetic resonance (EPR) spectroscopy. Compared to magnetic susceptibility measurements, EPR is considerably more sensitive. The lower limit for the detectable magnitude of the exchange interaction in magnetic susceptibility measurements is generally of the order of kBT, implying that the interaction cannot be smaller than about 1 cm−1 (∼3 × 10⁴ MHz = 1.4 K) unless the experiment is performed at very low temperatures.8 In contrast, EPR can probe exchange interactions of the order of 10−3 cm−1 and lower.2,3,9,10
In this study, we investigate electronic communication in linear copper porphyrin oligomers designed as molecular wires11–13 by EPR spectroscopy via measurement of the exchange coupling between the copper centers. The copper oligomers chosen for this case study represent very large spin systems with Hamiltonian dimensions exceeding the capabilities of commonly used simulation approaches. Here we introduce an approach that allows us to simulate the EPR spectra of such systems in the time domain and present the relevant simulation strategies. The studied linear copper porphyrin oligomers with one, two, and three porphyrin units are referred to as P1Cu, P2Cu2, and P3Cu3, respectively, and are shown in Fig. 1.
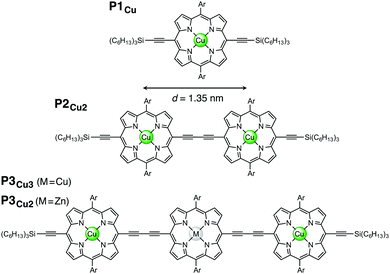 | ||
| Fig. 1 Chemical structures of P1Cu, P2Cu2, P3Cu3: M = Cu, and P3Cu2: M = Zn (Ar = 3,5-bis(trihexylsilyl)phenyl). | ||
If the isotropic tumbling limit can be reached in liquid solution, a separation of the individual contributions of D (dipolar coupling) and J (exchange coupling) to the shape of the cw EPR spectrum is straightforward because the anisotropic contribution (D) is averaged to zero.14–17 Many examples can be found where the magnitude of J was determined by numerical simulation of the isotropic liquid solution cw EPR spectrum. For copper compounds with inter-copper distances between 1.0 and 1.3 nm, J couplings of the order of 10−4 to 10−3 cm−1 could be measured, and a strong dependence of the magnitude of J on the nature of the linker and the relative orientation of the two copper centers was observed.16,18 In the effective absence of anisotropic interactions, such spectral simulations are relatively straightforward and computationally inexpensive. A number of different groups have made simulation programs available which can be used for this purpose.19–22 However, the comparison of the room temperature cw EPR spectrum of P1Cu with that of 5,10,15,20-tetraphenyl-21H,23H-porphine copper(II) (both shown in the ESI,† Fig. S8) indicates that the isotropic tumbling limit cannot be reached at room temperature in toluene with the compounds investigated here. The marked differences in the temperature dependence of the cw EPR spectra of the two compounds are ascribed to the bulky side and end groups in P1Cu, introduced to increase solubility and prevent aggregation in the longer oligomers. Since the anisotropic contributions to the spectra of these molecules do not average out in solution, a straightforward separation of D and J is not possible.
In those rare cases where the magnitude of J is large (distances well below 1 nm), the intensity of the half-field lines can be used to obtain information about J,23 as was shown, for instance, for copper centers separated by about 0.5 nm.24 In the present study, the separation distance between the two copper centers in P2Cu2 is 1.35 nm, as determined by DFT calculations, and no half-field lines were observed.
Since far too many unknown parameters describing the restricted motion of the molecules would be required to simulate an EPR spectrum in the slow motion regime, a more unambiguous way to extract J is to perform the measurement and the simulation of the spectra in the rigid limit (frozen solution).
2 Results and discussion
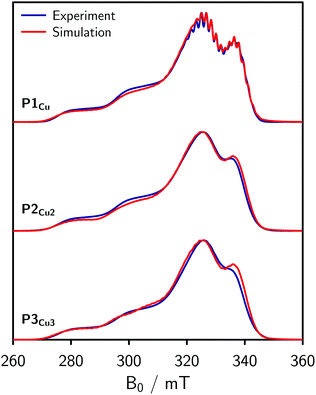
For the EPR measurements, 0.2 mM solutions of the oligomers were prepared in either toluene-d8 or regular toluene. Further details on the synthesis, sample preparation and experimental setup are given in the ESI.†Fig. 2 shows the frozen solution continuous wave (cw) EPR spectra of P1Cu, P2Cu2, and P3Cu3 recorded at 100 K. The spectrum of P1Cu strongly resembles the spectrum of a typical copper porphyrin monomer.25,26 A direct comparison between the spectra of P1Cu and P2Cu2 suggests that the hyperfine coupling constants and g-factors are similar in both compounds, since the positions of the most prominent transitions are virtually identical. Compared to the spectrum of P1Cu, the spectrum of P2Cu2 is significantly broadened; the intensity of the two copper transitions, resolved at the low-field side of the spectrum, appears to be enhanced (relative to the intensity maximum) and the hyperfine structure is less well resolved. The observed broadening in the spectrum of P2Cu2 is expected to be due to D and J, both arising from intramolecular interactions between the copper centers.
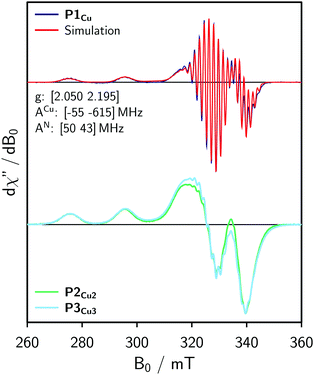 | ||
| Fig. 2 Continuous wave EPR spectra of P1Cu, P2Cu2, and P3Cu3 recorded in frozen toluene at 100 K and numerical simulation of the spectrum of P1Cu (top) using the parameters indicated in the figure. | ||
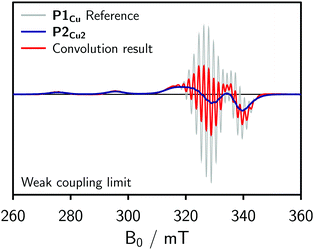
To obtain an initial idea whether the contribution of J to the spectrum of P2Cu2 is significant compared to D, dipolar convolution was applied. Applying this method, J cannot be included in the simulations, but its influence on the spectrum can be assumed to be substantial if the spectral shape cannot be fully reproduced when only accounting for the dipolar interaction between the spin centers. In the procedure, the spectrum of P1Cu was used as a reference and convoluted with a Gaussian distribution of Pake patterns corresponding to the expected distance distribution with a single distance peak centered at 1.3 nm and a width of σr = 0.04 nm. Variations of the width of the distribution within reasonable limits were found not to have any marked impact on the final convolution result. The simulations for the weak coupling regime are shown in Fig. 3.
In the weak coupling regime, negligible exchange coupling is assumed and only the influence of dipolar broadening on the spectrum is accounted for. As compared to the reference spectrum of P1Cu, the spectrum resulting from the convolution is only slightly broadened and therefore does not reproduce the spectrum observed experimentally for P2Cu2. We can thus conclude that a significant exchange coupling is most likely responsible for the spectral broadening observed for P2Cu2, i.e. that J > D.
At the second stage, a quantum mechanical simulation of the frozen solution spectrum that takes the influence of D and J explicitly into account, was performed. The parameters entering such simulations are the electron g-tensors, hyperfine coupling tensors, relaxation rate anisotropy parameters, as well as D and J, with an ensemble average over their distributions, if appropriate.
Experimental results from cw EPR and ENDOR (cf. ESI,† Fig. S10) suggest that the hyperfine parameters are the same for the copper porphyrin monomer and dimer. This observation is also supported by DFT calculations of the hyperfine coupling parameters for P1Cu and P2Cu2 carried out using ORCA27 and shown in the ESI.† Consequently, the g- and hyperfine tensors to be used in the simulation of the spectrum of P2Cu2 were determined by fitting the spectrum of P1Cu using EasySpin.22 The result of the fit is compared to the experimental data in Fig. 2 (top). The nitrogen hyperfine couplings were subsequently assumed to be isotropic since the experimentally observed anisotropy is much smaller than the electronic relaxation rates used in the simulations (determining the linewidth).
To reduce the number of fitting parameters for the simulation of the spectrum of P2Cu2 further, the dipolar interaction was estimated from the DFT spin density distribution in P1Cu. A visualization is shown in the ESI† (Fig. S13). About 70% of the spin density is located on copper; the remaining 30% is equally distributed between the four in-plane nitrogen atoms, in line with the expectation that the unpaired electron occupies the dx2−y2 orbital in copper porphyrins. In the simulations, an effective Cu⋯Cu distance of 1.3 nm was adopted, corresponding to a dipolar coupling constant of approximately 24 MHz (also weakly depending on the relative orientation of the two g-tensors). The effective distance was kept constant so that the only variable parameters in the simulation are the exchange interaction J and its dependence on the dihedral angle between the two porphyrin macrocycles.‡
The hyperfine couplings to both nitrogen and copper nuclei contribute significantly to the shape of the EPR spectrum and cannot be neglected in the simulation. The Hamiltonian matrix dimension for the porphyrin dimer therefore becomes so large§ that conventional EPR simulation packages are unable to handle them because they simulate the spectra in the frequency domain and rely on either matrix factorizations in Hilbert space or matrix inverse-times-vector operations in Liouville space.22,29 Both approaches are impractical for the matrix dimensions in question.
In the time domain, however, considerable improvements in the simulation methods have recently been made,30 offering an alternative approach. Therefore, by employing the similarity between field-swept and frequency-swept EPR spectra, the simulation and fitting of large spin systems can be made computationally feasible. The simulations presented here have been carried out using Spinach.31 The state space restriction strategy32 used to make the simulation manageable is described in the ESI.†
For simple spin-½ electron systems at high field, frequency swept EPR spectra are very similar, but not identical to field-swept spectra. The spin Hamiltonian parameters of the monomer therefore had to be adapted by re-fitting the spectrum to a frequency-swept simulation. Taking the parameters indicated in Fig. 2 as an initial guess, the hyperfine couplings of copper and nitrogen as well as the g-factors were fitted until a good agreement between the Spinach simulation and the experimental EPR spectrum was reached. The best fit, shown in Fig. 4 (top), was obtained for g = [2.051 2.180], ACu = [−71 −575] MHz and AN = 46 MHz. The difference from the true parameters is minor and inconsequential for the purpose of evaluating J, since the spectral broadening is evaluated with respect to the monomer spectrum simulated in the same way.
Since the barrier to rotation of the two porphyrin units about the butadiyne linker in P2Cu2 is below 1 kcal mol−1,33,34 a wide range of conformations of the molecule are expected to be populated at the freezing point of the solvent (∼180 K) and thus to contribute to the frozen solution spectrum. For simplicity, we assume that all dihedral angles are populated approximately equally. The simulation was therefore averaged with respect to the dihedral angles between the porphyrin planes.
Apart from the rotation of the two porphyrin units about the triple bonds, also other low energy molecular motions, such as bending of the molecule, are likely to be feasible and to modulate the exchange coupling. An overview of possibly contributing molecular motions is given in the ESI,† together with estimates of the expected variations in J obtained using DFT. Any distortion of the porphyrin macrocycles that changes their relative orientation affects J (Table S2, ESI†). However, the rotation about the triple bonds is expected to be the principal contribution.
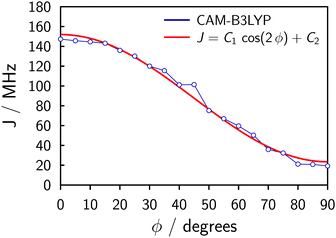
The symmetry of the system and a relaxed DFT dihedral angle scan suggest that the exchange coupling can be described by the following equation:
J = C1![[thin space (1/6-em)]](https://www.rsc.org/images/entities/char_2009.gif) cos(2ϕ) + C2, cos(2ϕ) + C2, | (1) |
The fitting of the experimental data for P2Cu2 using Spinach (cf.Fig. 4) produces C1 ≈ 15 MHz and C2 ≈ 25 MHz (the simulation is insensitive to the overall sign of J), with uncertainties perhaps as large as 50%. The uncertainties stem from the physical and algebraic assumptions made above, as well as from the rather featureless character of the experimental spectrum of P2Cu2, which precludes a more precise quantification.¶
Compared to the spectrum of P2Cu2, only minor further broadening is observed in the experimental spectrum of P3Cu3 (cf.Fig. 2). Since the dipolar interaction between two copper centers separated by over 2.7 nm is negligible on the scale of other interactions present, the small additional broadening in the spectrum of P3Cu3 is likely to indicate a slight increase in J, suggesting increased π-conjugation. However, the small difference between P2Cu2 and P3Cu3 confirms that the exchange coupling in these linear compounds is dominated by nearest neighbor interactions as would be expected from the exponential dependence of J on distance.
For the simulation of the spectrum of P3Cu3, the same parameters as for P2Cu2 were employed, except that the averaging was this time performed over two independent dihedral angles. The J coupling between the outer two porphyrin units was assumed to be negligible. This assumption may be justified on the basis of the EPR spectrum of a porphyrin trimer with two terminal copper centers and a central zinc center. The EPR spectrum of this molecule, referred to as P3Cu2, is shown in the ESI† (Fig. S9) and is virtually identical to the spectrum of a copper porphyrin monomer. This suggests that the exchange coupling between the two outer porphyrin units in a linear trimer is indeed negligible.
3 Conclusions
Based on the results from EPR spectroscopy and simulations, we can conclude that the exchange coupling in linear porphyrin oligomers with more than two units is not increased significantly compared to P2Cu2, showing that, as expected, the intra-molecular exchange coupling in these systems is dominated by nearest neighbor interactions. This result was confirmed by measuring the EPR spectrum of a linear porphyrin trimer with two copper units separated by a central zinc unit, indicating negligible exchange coupling between the outer porphyrin units. The exchange coupling in a linear butadiyne-bridged copper porphyrin dimer could be determined to be of the order of a few tens of MHz. The relatively featureless character of the EPR spectrum precludes a more precise quantification.The location of the unpaired electron spin in the dx2−y2 orbital in Cu(II) porphyrins results in a poor d–π orbital overlap. Potentially, the coupling between the spin centers could be enhanced by selecting Co(II) as the central atom, with an unpaired spin in the dz2 orbital.
Apart from the rotation of the porphyrin units about the triple bond linkers, which is expected to be the main source of the modulation in J and was explicitly considered in the simulations, many energetically accessible molecular twisting and bending motions of the porphyrin chains are also likely to be feasible and to modulate the exchange coupling, as indicated by the DFT calculations presented in the ESI.†
This case study demonstrates that a quantum mechanical simulation of the frozen solution EPR spectrum of an exceptionally large EPR spin system with the Hamiltonian dimension of 26![[thin space (1/6-em)]](https://www.rsc.org/images/entities/char_2009.gif) 244 can be made feasible to the extent that spectral fitting can be performed on a desktop computer. The nature of the state space restriction approximation37,38 implies that the increase in the simulation complexity for larger systems of the same class would be polynomial rather than exponential, with respect to their size – the notorious “exponential scaling wall” in the simulation of EPR spectra has now been overcome.
244 can be made feasible to the extent that spectral fitting can be performed on a desktop computer. The nature of the state space restriction approximation37,38 implies that the increase in the simulation complexity for larger systems of the same class would be polynomial rather than exponential, with respect to their size – the notorious “exponential scaling wall” in the simulation of EPR spectra has now been overcome.
Acknowledgements
We thank the EPSRC (EPL011972/1) and the ERC (grant 320969) for financial support. The authors would like to acknowledge the use of the University of Oxford Advanced Research Computing (ARC) facility in carrying out this work (http://dx.doi.org/10.5281/zenodo.22558). The authors also acknowledge the use of the IRIDIS High Performance Computing Facility, and associated support services at the University of Southampton, in the completion of this work. We thank the EPSRC UK National Mass Spectrometry Facility at Swansea University for MALDI spectra.References
- G. R. Eaton and S. S. Eaton, Acc. Chem. Res., 1988, 21, 107–113 CrossRef CAS.
- P. Wautelet, A. Bieber, P. Turek, J. Le Moigne and J.-J. André, Mol. Cryst. Liq. Cryst., 1997, 305, 55–67 CrossRef CAS.
- S. Richert, J. Cremers, I. Kuprov, M. D. Peeks, H. L. Anderson and C. R. Timmel, Nat. Commun., 2017, 8, 14842 CrossRef CAS PubMed.
- S. A. Wolf, D. D. Awschalom, R. A. Buhrman, J. M. Daughton, S. von Molnár, M. L. Roukes, A. Y. Chtchelkanova and D. M. Treger, Science, 2001, 294, 1488–1495 CrossRef CAS PubMed.
- A. R. Rocha, V. M. García-Suárez, S. W. Bailey, C. J. Lambert, J. Ferrer and S. Sanvito, Nat. Mater., 2005, 4, 335–339 CrossRef CAS PubMed.
- S. Sanvito, Chem. Soc. Rev., 2011, 40, 3336–3355 RSC.
- A. Rao, P. C. Y. Chow, S. Gélinas, C. W. Schlenker, C.-Z. Li, H.-L. Yip, A. K.-Y. Jen, D. S. Ginger and R. H. Friend, Nature, 2013, 500, 435–440 CrossRef CAS PubMed.
- A. Bencini and D. Gatteschi, EPR of Exchange Coupled Systems, Dover Publications, New York, 2012 Search PubMed.
- S. A. Dzuba, P. Gast and A. J. Hoff, Chem. Phys. Lett., 1995, 236, 595–602 CrossRef CAS.
- R. Carmieli, X. Mi, A. Butler Ricks, E. M. Giacobbe, S. M. Mickley and M. R. Wasielewski, J. Am. Chem. Soc., 2009, 131, 8372–8373 CrossRef CAS PubMed.
- G. Sedghi, V. M. García-Suárez, L. J. Esdaile, H. L. Anderson, C. J. Lambert, S. Martín, D. Bethell, S. J. Higgins, M. Elliott, N. Bennett, J. E. Macdonald and R. J. Nichols, J. Am. Chem. Soc., 2011, 133, 17262–17273 CrossRef PubMed.
- A. Nitzan, Annu. Rev. Phys. Chem., 2001, 52, 681–750 CrossRef CAS PubMed.
- H. L. Anderson, Chem. Commun., 1999, 2323–2330 RSC.
- T. D. Smith and J. R. Pilbrow, Coord. Chem. Rev., 1974, 13, 173–278 CrossRef CAS.
- N. Toyama, M. Asano-Someda, T. Ichino and Y. Kaizu, J. Phys. Chem. A, 2000, 104, 4857–4865 CrossRef.
- M. Asano-Someda, N. Toyama and Y. Kaizu, Mol. Cryst. Liq. Cryst., 2002, 379, 165–170 CrossRef CAS.
- R. Calvo, Appl. Magn. Reson., 2007, 31, 271–299 CrossRef CAS.
- N. Toyama, M. Asano-Someda and Y. Kaizu, Mol. Phys., 2003, 101, 733–742 CrossRef CAS.
- S. S. Eaton, D. L. DuBois and G. R. Eaton, J. Magn. Reson., 1978, 32, 251–263 CAS.
- K. M. More, G. R. Eaton and S. S. Eaton, Inorg. Chem., 1986, 25, 2638–2646 CrossRef CAS.
- G. R. Hanson, K. E. Gates, C. J. Noble, M. Griffin, A. Mitchell and S. Benson, J. Inorg. Biochem., 2004, 98, 903–916 CrossRef CAS PubMed.
- S. Stoll and A. Schweiger, J. Magn. Reson., 2006, 178, 42–55 CrossRef CAS PubMed.
- S. S. Eaton, K. M. More, B. M. Sawant and G. R. Eaton, J. Am. Chem. Soc., 1983, 105, 6560–6567 CrossRef CAS.
- S. S. Eaton, G. R. Eaton and C. K. Chang, J. Am. Chem. Soc., 1985, 107, 3177–3184 CrossRef CAS.
- S. P. Greiner, D. L. Rowlands and R. W. Kreilick, J. Phys. Chem., 1992, 96, 9132–9139 CrossRef CAS.
- C. Finazzo, C. Calle, S. Stoll, S. Van Doorslaer and A. Schweiger, Phys. Chem. Chem. Phys., 2006, 8, 1942–1953 RSC.
- F. Neese, Wiley Interdiscip. Rev.: Comput. Mol. Sci., 2012, 2, 73–78 CrossRef CAS.
- J. E. Lovett, M. Hoffmann, A. Cnossen, A. T. J. Shutter, H. J. Hogben, J. E. Warren, S. I. Pascu, C. W. M. Kay, C. R. Timmel and H. L. Anderson, J. Am. Chem. Soc., 2009, 131, 13852–13859 CrossRef CAS PubMed.
- G. Moro and J. H. Freed, J. Chem. Phys., 1981, 74, 3757–3773 CrossRef CAS.
- L. J. Edwards, D. V. Savostyanov, Z. T. Welderufael, D. Lee and I. Kuprov, J. Magn. Reson., 2014, 243, 107–113 CrossRef CAS PubMed.
- H. J. Hogben, M. Krzystyniak, G. T. P. Charnock, P. J. Hore and I. Kuprov, J. Magn. Reson., 2011, 208, 179–194 CrossRef CAS PubMed.
- H. J. Hogben, P. J. Hore and I. Kuprov, J. Chem. Phys., 2010, 132, 174101 CrossRef CAS PubMed.
- M. D. Peeks, P. Neuhaus and H. L. Anderson, Phys. Chem. Chem. Phys., 2016, 18, 5264–5274 RSC.
- M. U. Winters, J. Kärnbratt, M. Eng, C. J. Wilson, H. L. Anderson and B. Albinsson, J. Phys. Chem. C, 2007, 111, 7192–7199 CAS.
- E. Ruiz, J. Comput. Chem., 2011, 32, 1998–2004 CrossRef CAS PubMed.
- N. A. G. Bandeira and B. Le Guennic, J. Phys. Chem. A, 2012, 116, 3465–3473 CrossRef CAS PubMed.
- I. Kuprov, J. Magn. Reson., 2008, 195, 45–51 CrossRef CAS PubMed.
- I. Kuprov, N. Wagner-Rundell and P. J. Hore, J. Magn. Reson., 2007, 189, 241–250 CrossRef CAS PubMed.
Footnotes |
| † Electronic supplementary information (ESI) available: Synthetic procedures, description of the sample preparation, experimental setup, simulation procedures and DFT calculations. See DOI: 10.1039/c7cp01787a |
| ‡ The inter-electron distance also has a certain distribution which, in principle, needs to be considered. However, the variations in D are small compared to the expected variations in J and are therefore neglected in the analysis to reduce the number of variable parameters. At most, a variation in distance between 1.2 nm (∼31 MHz) and 1.35 nm (∼22 MHz) is expected, caused by the possibility of a slight bending of the structure.28 |
§ A system with two electrons, two copper nuclei and eight 14N nuclei has a Hamiltonian dimension of 26![[thin space (1/6-em)]](https://www.rsc.org/images/entities/char_2009.gif) 244 in Hilbert space and 688 244 in Hilbert space and 688![[thin space (1/6-em)]](https://www.rsc.org/images/entities/char_2009.gif) 747 747![[thin space (1/6-em)]](https://www.rsc.org/images/entities/char_2009.gif) 536 in Liouville space. 536 in Liouville space. |
| ¶ The indicated numeric values refer to the spin Hamiltonian Ĥ = −2JS1·S2. A variation of the fitting parameters within an interval of ±20% produces similar quality fits. However, a significant exchange coupling contribution to the spectra of the order of a few tens of MHz has to be assumed as is shown in Fig. S12 in the ESI.† |
| This journal is © the Owner Societies 2017 |

