 Open Access Article
Creative Commons Attribution 3.0 Unported Licence
Slip on a particle surface as the possible origin of shear thinning in non-Brownian suspensions
Martin
Kroupa
 ,
Miroslav
Soos
* and
Juraj
Kosek
*
University of Chemistry and Technology Prague, Department of Chemical Engineering, Technicka 5, 16628 Prague 6, Czech Republic. E-mail: Miroslav.Soos@vscht.cz; Juraj.Kosek@vscht.cz; Tel: +420 220 443 296
First published on 25th January 2017
Abstract
Concentrated suspensions of non-Brownian particles exhibit a decrease in their viscosity with the increasing shear rate, a phenomenon called shear thinning. We present a possible explanation for this long-standing problem based on recent advances in the connection between the slip on the surface of the particles and the suspension viscosity. By expressing the energy dissipation between a pair of particles as a function of the local shear rate, it is possible to directly link the decrease of the viscosity with the shear rate to the slip of solvent molecules on the particle surface. Good agreement with various experimental data suggests that the surface slip might be important for the rheology of suspensions. The implications of this idea are relevant for a broad spectrum of applications as they show that not only the bulk properties, but also the properties of the solid–liquid interface are crucial for the flow in crowded systems.
Introduction
The shear thinning behavior in non-Brownian hard-sphere suspensions is a puzzling phenomenon that has not yet been satisfactorily explained.1,2 The experimental evidence of this effect goes back to Krieger (1972) or de Kruif et al. (1985) with more recent experimental works confirming the decrease in viscosity with the shear rate under carefully controlled conditions.3–6Theoretical descriptions of shear thinning often consist merely in using the classical equations of Krieger and Dougherty (1959) or Maron and Pierce (1956) and plugging in different values of the maximum packing fraction ϕmax for the low-shear and the high-shear viscosity.7,8 The same approach is used also in the more recent theory based on the differential viscosity model.9 The main disadvantage of this approach is that it does not contain any underlying physical mechanism to explain the shear-thinning behavior.
For the case of colloidal hard-sphere suspension, i.e., particles that are subject to the Brownian motion, the presence of shear thinning is often explained by shear-induced changes in the microstructure.10–13 For small values of the shear rate, the structure of the suspension is random owing to the Brownian motion. With increasing shear rate, the thermal motion is not sufficient to preserve the random configuration and particles start to align with the flow decreasing their resistance and therefore the suspension viscosity also decreases. When the shear rate is increased even more, the particles start to form hydroclusters, which leads to the increase of the viscosity, i.e., shear thickening.14
When it comes to the explanation of shear thinning in non-Brownian hard-sphere suspensions, the decrease of the viscosity with the shear rate clearly cannot be ascribed to the competition between the Brownian motion and hydrodynamic forces, because for particles larger than roughly 10 μm the random motion is negligible. In the literature, the loss of symmetry (e.g., upon reversal of the flow) at high concentrations caused by the chaotic nature of particle flow15 or the presence of many-body interactions16 is often quoted as the possible explanation. The relation between the microstructure and the rheology in noncolloidal suspensions was modeled by Sierou and Brady (2002) revealing a strongly non-Newtonian behavior in terms of the normal stresses as a result of anisotropy.17 These findings are very important for the understanding of the complicated issue of hydrodynamics at high particle volume fractions. However, the microstructure in concentrated suspensions is quite difficult to measure.18 Furthermore, it is difficult to actually use these results for the prediction of viscosity or for the comparison with experimental data.
We suggest a different mechanism responsible for the shear thinning behavior and this mechanism is the slip of solvent molecules on the surface of the particles, particularly the shear-rate dependence of the slip length b, which is the measure of the extent of the slip. In the following, we first provide arguments highlighting the possible importance of the slip for the suspension rheology, then we derive the governing equations for the proposed model and finally we compare the predictions of the model with experimental data and draw some major conclusions from our observations.
Surface slip
The classical description of the solid–liquid interface in the fluid mechanics relies on the no-slip boundary condition. This condition was however often found not to be valid on the micro- and nanometer scale due to various effects, such as the surface roughness or the presence of a lubricating gas film on the surface.19 The presence of the partial slip has important consequences for microfluidics or micro- or nano-structured materials (super-hydrophobicity). However, there is a potentially important consequence of the partial slip on the particle surface to the rheology of suspensions and this idea has not yet been addressed in the literature.There are multiple reasons why the surface slip should be important in concentrated suspensions. Firstly, several studies have found the slip length to increase with the surface roughness.19–22 Since only a very small fraction of materials exhibit molecular smoothness,23 this effect is likely to be important for typical suspensions. Secondly, the surface slip was observed to be more pronounced for hydrophobic surfaces, although non-negligible values of the slip length were observed also for hydrophilic materials.19–21,23,24 This is of particular importance for latexes as they are commonly used as model systems for rheological measurements. Finally, a large number of studies showed the slip length to increase with the increasing shear rate.20,21,24–28 As we demonstrate later, for concentrated suspensions, the local shear rate γ between a pair of particles can be much larger (by orders of magnitude) than the imposed shear rate G (e.g., in a simple shear flow). Together with our recent finding that the increasing slip length causes the suspension viscosity to decrease,29 this suggests that the surface slip might be responsible for the viscosity decrease with the increasing shear rate.
It is difficult to quantify the extent of the surface slip for given conditions and attribute it to a particular cause, as more effects usually take place at the same time. Also, direct measurements using an AFM colloidal probe often show significant scatter.21,30 While the presence of a lubricating gas layer is improbable due to the large shear rate, the combined effect of surface roughness and hydrophobicity can lead to a significant slip as reported by the aforementioned experimental studies.
It was recently pointed out that the rich experimental evidence of the slip length increasing with the shear rate is incorrect due to inaccurate interpretation of AFM colloidal probe experiments.31 The authors argue that b must decrease with G because otherwise the slip velocity would diverge upon the contact of particles, in the framework of the lubrication theory. However, the usage of this continuum-based approach is highly questionable in this limiting case of a molecularly-thin lubrication layer and other mechanisms originating from the discrete nature of solvent molecules are likely to play an important role. Furthermore, the evidence of b increasing with G was observed not only in AFM colloidal probe measurements, but also in a cone-plate rheometer21 and micro-channel flow.21,27
Theory
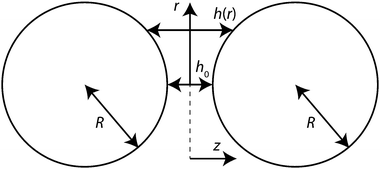
We begin the derivation of the model equations with a simplified consideration of a flow between two isolated particles. Let us consider the case of two equal-sized particles approaching each other. We define a cylindrical coordinate system (r,z) as shown in Fig. 1 with the angular coordinate not important due to the symmetry of the system. In this setup, h0 is the distance of the closest separation between the particle surfaces and R is the radius of the particles. The r-dependent distance between the particle surfaces is defined as follows: | (1) |
With the assumption of a creeping flow, the gradient of the fluid pressure between the spheres in the framework of the classical lubrication theory is defined as:31
 | (2) |
At the surfaces of the particles  , we define the local shear rate:
 | (3) |
 | (4) |
The solution of eqn (2) with the boundary conditions given by eqn (4) is:31
 | (5) |
 , assuming that the gradient does not vary with z. Finally, the local shear rate at the surface is:
 | (6) |
Let us now focus on the case of the two spheres moving towards each other, the velocity is expressed as the change of separation ḣ (ḣ < 0 for approach and ḣ >0 for retraction). Applying the mass conservation of the fluid, the rate of change of the volume of a cylinder with radius r must be equal to the rate of fluid flow across the side walls of the cylinder:32
 | (7) |
 | (8) |
Plugging eqn (8) into eqn (7), we obtain a quadratic equation for p′(r) with the following solution:
 | (9) |
 | (10) |
 | (11) |
 | (12) |
In eqn (9), the plus sign applies to the retraction (p′(r) > 0) and the minus sign to the approach (p′(r) < 0). The shear rate γ(r) is obtained from eqn (6).
For the determination of the viscosity of the suspension, let us develop the following consideration. We define ϕ as the particle volume fraction of equal-sized spheres and ϕmax as the maximum achievable ϕ, at which the spheres touch each other. We assume that we can arrive to an arbitrary ϕ by starting at ϕmax (i.e., a jammed system) and then by shrinking all the spheres (i.e., decreasing R) equally until the desired ϕ is reached. In that case, the mean distance between two spheres in the system is:
 | (13) |
When this expression is plugged into eqn (1), we get after the procedure detailed above the local r-dependent shear rate γ(r) as a function of particle volume fraction.
Further, considering a pair of spheres in a simple shear flow with global shear rate G, we can express the approach rate of these spheres as:
| ḣ = −GR. | (14) |
This, of course, assumes certain orientation of the spheres in the flow, but it can serve as a good approximation for the argument presented in this work. For the retraction, the solution would be entirely analogical due to the fore-aft symmetry of the creeping flow. Using this expression together with eqn (6) and (9) one can obtain the local shear rate γ(r) as a function of both particle volume fraction ϕ and the applied shear rate G, which is a typical example in a rheological measurement.
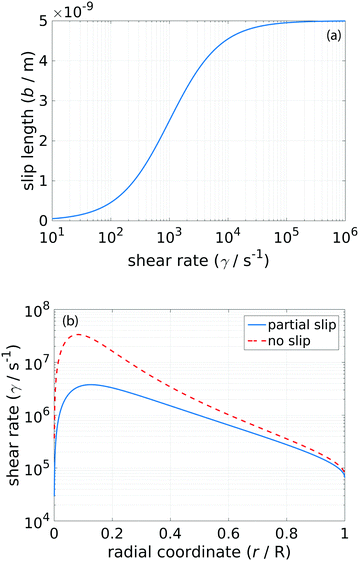
Interestingly, this local shear rate γ(r) varies quite significantly with both the radial coordinate r and the separation distance h0. For small h0, it can reach much higher values than the value of the applied shear rate G (see Fig. 2b for a comparison with the no-slip boundary condition).
Finally, the local shear rate γ(r) between the particles can be viewed as an additional source of energy dissipation that originates from the presence of particles. As such, it should lead to an increase of the viscosity. We denote the maximum local shear rate with respect to r as γmax = max|γ(r)| and we make an assumption that it is this maximum local shear rate that contributes most to the increase in viscosity. Then, we can express the total shear stress σ as follows:
| σ = σ0 + σp = η0G + η0γmax(ϕ,G). | (15) |
If we divide the whole equation with the global shear rate G, we arrive to the expression for the suspension viscosity:
 | (16) |
Note that the maximum local shear rate γmax is a function of ϕ and G and that it depends on the parameters bmin, bmax, γc and ϕmax.
Results and discussion
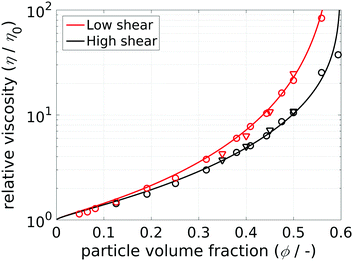
The viscosity predicted by eqn (16) is compared with the experimental data for a hard sphere system in both the low-shear limit and the high-shear limit in Fig. 3. It is clear that there is a very good agreement between the predictions of our model and the experimental data. | ||
| Fig. 3 Suspension viscosity as a function of particle volume fraction ϕ in the low-shear and high-shear limit. The symbols represent experimental data of3 (triangles) and4 (circles). The values of parameters were bmin/R = 0, bmax/R = 0.04, γc = 1 × 10³ s−1 and ϕmax = 0.60. | ||
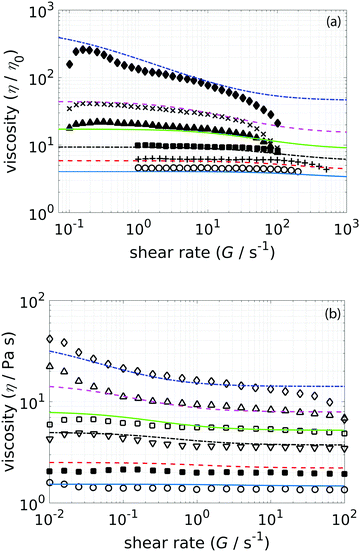
In Fig. 4, we show the comparison with experimental data of5 and6 for the shear-rate dependent viscosity. Our model correctly captures the trend of more pronounced shear-thinning behavior for larger ϕ. Also, the quantitative agreement in terms of the dependence of η on ϕ is good. The sharp decrease of viscosity for values of the shear rate close to G = 1 × 10² s−1 in the experimental data is an artifact caused by the so-called edge fracture1,5,6 and thus it does not represent a disagreement between the experiments and our model.
 | ||
| Fig. 4 Suspension viscosity as a function of shear rate for different values of the particle volume fraction. (a) Both symbols and lines from bottom to top, ϕ = 0.306, 0.356, 0.407, 0.457, 0.507 and 0.557. The symbols represent experimental data of Zarraga et al. 2000.5 The values of parameters were bmin/R = 0, bmax/R = 0.04, γc = 1 × 10³ s−1 and ϕmax = 0.57. (b) Both symbols and lines from bottom to top, ϕ = 0.10, 0.20, 0.30, 0.35, 0.40 and 0.45. The symbols represent experimental data of Dai et al. 2013.6 The values of parameters were bmin/R = 0, bmax/R = 0.04, γc = 2 s−1 and ϕmax = 0.51. | ||
Experimental data from four various measurements were successfully captured by the presented model. The fact that the minimum slip length bmin is equal to zero in all cases suggests that the slip does not occur (or is negligible) for small values of the shear rate. This also effectively reduces the number of parameters of our model. Also, the maximum slip length was the same in all four cases and its value bmax/R = 0.04 is reasonable when compared to direct measurements using an AFM colloidal probe.20,33–35 The critical shear rate was equal to γc = 1 × 10³ s−1 for the measurements reported in ref. 3, 4 and 5. The fact that the value of γc was nearly three orders of magnitude lower for the case of ref. 6 reflects the fact that the shear thinning occurs at much smaller values of the shear rate in this case. It is however not clear, whether this parameter has some actual physical meaning.
It is worth noting that the values of ϕmax resulting from the fitting to various experimental data are smaller than the values commonly used in the literature (usually between ϕmax = 0.63 and ϕmax = 0.743,9). However, one could encounter also values as low as ϕmax = 0.524.36 Other reasons for this discrepancy include the fact that the viscosity in the present model is evaluated based on the energy dissipation between an isolated pair of particles, while in reality the many-body interaction in a concentrated suspension might further increase the dissipation.
In the model, a static configuration of particles is considered for the determination of ![[h with combining macron]](https://www.rsc.org/images/entities/i_char_0068_0304.gif) 0, while in an actual flowing system, there will be a time-dependent distribution of the inter-particle distances. This distribution also differs locally, leading to an anisotropic microstructure of the suspension. For large values of the shear rate, the changes in the microstructure can lead to the formation of hydroclusters and the subsequent increase of the suspension viscosity. As this is a process primarily caused by lubrication forces, the shear-dependent slip may affect it as well. Also, we consider the lubrication as the only source of dissipation in the system neglecting the long-range hydrodynamic interaction. Although this limits our approach to concentrated systems, for which the lubrication is dominant, the agreement with experiments is quite good also for less concentrated suspensions. Nevertheless, even with these simplifications, the model is able to fit various experimental data for non-Brownian hard-sphere suspensions very well and with reasonable values of the model parameters.
0, while in an actual flowing system, there will be a time-dependent distribution of the inter-particle distances. This distribution also differs locally, leading to an anisotropic microstructure of the suspension. For large values of the shear rate, the changes in the microstructure can lead to the formation of hydroclusters and the subsequent increase of the suspension viscosity. As this is a process primarily caused by lubrication forces, the shear-dependent slip may affect it as well. Also, we consider the lubrication as the only source of dissipation in the system neglecting the long-range hydrodynamic interaction. Although this limits our approach to concentrated systems, for which the lubrication is dominant, the agreement with experiments is quite good also for less concentrated suspensions. Nevertheless, even with these simplifications, the model is able to fit various experimental data for non-Brownian hard-sphere suspensions very well and with reasonable values of the model parameters.
Conclusions
The presented model connects the shear thinning behavior in hard-sphere suspensions to the phenomenon of the slip on the surface of particles and its dependence on the local shear rate. To the best of our knowledge, this connection and derivation is presented for the first time. The big advantage of the proposed approach when compared to different models is the fact that it can be well tested experimentally. The preparation of a suspension with different surface properties (hydrophobic vs. hydrophilic) or changing the roughness of the particles is technically possible. The slip length can be measured using an independent technique (such as the AFM colloidal probe) and the predictions of our theory can be subsequently compared to actual rheological measurements. In fact, the study of Moon et al. (2015) showed more pronounced shear-thinning behavior for rougher particles,37 which using our theory can be explained by the increase of the slip length. An open question in this respect is the ratio of the length-scale of the surface roughness to the particle size, i.e., the possible dependence of the viscosity on the size of particles.The possible impact of the main idea of this work is much broader than the field of hard-sphere suspension rheology. The fact that the viscosity of a dispersion might be affected by the slip of the solvent molecules on the surface of the particles is relevant also for the behavior of bio-based systems, such as proteins or biological fluids.
Acknowledgements
The authors are grateful for the support provided by EC SPIRE project RECOBA (H2020-636820) and by Czech Science Foundation (GACR) project 16-22997S. Financial support from specific university research (MSMT No. 20-SVV/2016) is gratefully acknowledged.References
- J. Mewis and N. Wagner, Colloidal Suspension Rheology, Cambridge University Press, 2012 Search PubMed.
- R. I. Tanner, J. Non-Newtonian Fluid Mech., 2015, 222, 18–23 CrossRef CAS.
- I. M. Krieger, Adv. Colloid Interface Sci., 1972, 3, 111–136 CrossRef CAS.
- C. G. de Kruif, E. M. F. van Iersel, A. Vrij and W. B. Russel, J. Chem. Phys., 1985, 83, 4717–4725 CrossRef CAS.
- I. E. Zarraga, D. A. Hill and D. T. Leighton, J. Rheol., 2000, 44, 185–220 CrossRef CAS.
- S. C. Dai, E. Bertevas, F. Z. Qi and R. I. Tanner, J. Rheol., 2013, 57, 493–510 CrossRef CAS.
- I. M. Krieger and T. J. Dougherty, Trans. Soc. Rheol., 1959, 3, 137–152 CrossRef CAS.
- S. Maron and P. Pierce, J.Colloid Sci., 1956, 11, 80–95 CrossRef CAS.
- C. I. Mendoza and I. Santamaria-Holek, J. Chem. Phys., 2009, 130, 044904 CrossRef PubMed.
- J. F. Brady, Journal of Chemical Physics, 1993, 99, 567–581 CrossRef CAS.
- X. L. Xu, S. A. Rice and A. R. Dinner, Proceedings of the National Academy of Sciences of the United States of America, 2013, 110, 3771–3776 CrossRef CAS PubMed.
- J. F. Brady and J. F. Morris, Journal of Fluid Mechanics, 1997, 348, 103–139 CrossRef CAS.
- T. N. Phung, J. F. Brady and G. Bossis, Journal of Fluid Mechanics, 1996, 313, 181–207 CrossRef CAS.
- N. J. Wagner and J. F. Brady, Physics Today, 2009, 62, 27–32 CrossRef CAS.
- G. Drazer, J. Koplik, B. Khusid and A. Acrivos, J. Fluid Mech., 2002, 460, 307–335 CAS.
- D. J. Pine, J. P. Gollub, J. F. Brady and A. M. Leshansky, Nature, 2005, 438, 997–1000 CrossRef CAS PubMed.
- A. Sierou and J. F. Brady, Journal of Rheology, 2002, 46, 1031–1056 CrossRef CAS.
- F. Parsi and F. Gadala-Maria, J. Rheol., 1987, 31, 725–732 CrossRef CAS.
- O. I. Vinogradova and A. V. Belyaev, J. Phys.: Condens. Matter, 2011, 23, 184104 CrossRef PubMed.
- E. Bonaccurso, H.-J. Butt and V. S. J. Craig, Phys. Rev. Lett., 2003, 90, 144501 CrossRef PubMed.
- C. H. Choi and C. J. Kim, Phys. Rev. Lett., 2006, 96, 066001 CrossRef PubMed.
- M. Z. Bazant and O. I. Vinogradova, J. Fluid Mech., 2008, 613, 125–134 Search PubMed.
- S. P. McBride and B. M. Law, Phys. Rev. E, 2009, 80, 060601 CrossRef PubMed.
- S. K. Aghdam and P. Ricco, Phys. Fluids, 2016, 28, 035109 CrossRef.
- V. S. J. Craig, C. Neto and D. R. M. Williams, Phys. Rev. Lett., 2001, 87, 054504 CrossRef CAS PubMed.
- C. Neto, V. S. J. Craig and D. R. M. Williams, Eur. Phys. J. E: Soft Matter Biol. Phys., 2003, 12, S71–S74 CrossRef CAS PubMed.
- H. Y. Hsu and N. A. Patankar, J. Fluid Mech., 2010, 645, 59–80 CrossRef.
- M. Sega, M. Sbragaglia, L. Biferale and S. Succi, Soft Matter, 2013, 9, 8526–8531 RSC.
- M. Kroupa, M. Vonka, M. Soos and J. Kosek, Langmuir, 2016, 32, 8451–8460 CrossRef CAS PubMed.
- C. S. Hodges, J. A. S. Cleaver, M. Ghadiri, R. Jones and H. M. Pollock, Langmuir, 2002, 18, 5741–5748 CrossRef CAS.
- L. W. Zhu, C. Neto and P. Attard, Langmuir, 2012, 28, 3465–3473 CrossRef CAS PubMed.
- J. J. Bikerman, J. Colloid Sci., 1947, 2, 163–175 CrossRef CAS.
- E. Bonaccurso, M. Kappl and H. J. Butt, Phys. Rev. Lett., 2002, 88, 076103 CrossRef PubMed.
- C. D. F. Honig and W. A. Ducker, J. Phys. Chem. C, 2007, 111, 16300–16312 CAS.
- C. Neto, D. R. Evans, E. Bonaccurso, H. J. Butt and V. S. J. Craig, Rep. Prog. Phys., 2005, 68, 2859–2897 CrossRef CAS.
- A. P. Shapiro and R. F. Probstein, Phys. Rev. Lett., 1992, 68, 1422–1425 CrossRef CAS PubMed.
- J. Y. Moon, S. C. Dai, L. Chang, J. S. Lee and R. I. Tanner, J. Non-Newtonian Fluid Mech., 2015, 223, 233–239 CrossRef CAS.
| This journal is © the Owner Societies 2017 |


