 Open Access Article
Creative Commons Attribution 3.0 Unported Licence
A new approach to distance measurements between two spin labels in the >10 nm range
A.
Blank

Schulich Faculty of Chemistry, Technion – Israel Institute of Technology, Haifa, 3200003, Israel. E-mail: ab359@technion.ac.il
First published on 27th January 2017
Abstract
ESR spectroscopy can be efficiently used to acquire the distance between two spin labels placed on a macromolecule by measuring their mutual dipolar interaction frequency, as long as the distance is not greater than ∼10 nm. Any hope to significantly increase this figure is hampered by the fact that all available spin labels have a phase memory time (Tm), restricted to the microseconds range, which provides a limited window during which the dipolar interaction frequency can be measured. Thus, due to the inverse cubic dependence of the dipolar frequency over the labels' separation distance, evaluating much larger distances, e.g. 20 nm, would require to have a Tm that is ∼200 microsecond, clearly beyond any hope. Here we propose a new approach to greatly enhancing the maximum measured distance available by relying on another type of dipole interaction-mediated mechanism called spin diffusion. This mechanism operates and can be evaluated during the spin lattice relaxation time, T1 (commonly in the milliseconds range), rather than only during Tm. Up until recently, the observation of spin diffusion in solid electron spin systems was considered experimentally impractical. However, recent developments have enabled its direct measurement by means of high sensitivity pulsed ESR that employs intense short magnetic field gradients, thus opening the door to the subsequent utilization of these capabilities. The manuscript presents the subject of spin diffusion, the ways it can be directly measured, and a theoretical discussion on how intramolecular spin-pair distance, even in the range of 20–30 nm, could be accurately extracted from spin diffusion measurements.
1. Introduction
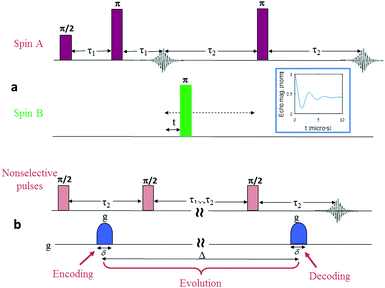
Distance determination between two electron spin labels is arguably one of the most significant applications of modern electron spin resonance spectroscopy. Methods such as double electron–electron resonance technique (DEER),1 double quantum coherence (DQC),2 or single-frequency technique for refocusing (SIFTER),3 aim at measuring the distance distribution and possibly extracting the mean distance between two spin labels positioned on a large molecule or supramolecular structure. This technique has led in recent years to numerous publications, mostly related to issues of advanced structural biology issues.4–10 Furthermore, all these dipolar ESR spectroscopy approaches are constantly being improved, mainly through more optimized pulse sequences,11 better spin labels,12,13 low-γ isotopically enriched molecules and solvents,14 and optimized high-end spectrometers,15 with the goal of increasing the maximum measurable distance between the two labels. However, despite these extensive efforts, DEER and related techniques are limited to the measurement of distances up to ∼10 nm, with not much hope of significantly increasing this barrier. The reason for this limitation can be understood by examining a typical DEER sequence (Fig. 1a). In DEER experiments (and the same is applicable to DQC and other related techniques), the information regarding the intramolecular spin labels’ separation distance is obtained by measuring the frequency of the dipolar interaction between the two spins. This frequency, νdipolar, is directly linked to the intramolecular spin-pair distance, d, via the expression: | (1) |
Here we present and theoretically analyse an alternative approach that has the potential to significantly increase the upper measurable distance limitation to the range of a few tens of nanometers. This approach, as in the case of DEER, is also based on measuring processes that are mediated by the dipolar interaction between the two spin labels. However, the main difference is that it examines processes that occur within T1 and not in the Tm time scale, which for most systems of relevance (e.g., nitroxides, Gd ions, trityls) can be more than 3–4 orders of magnitude longer at the cryogenic temperatures commonly employed in DEER and DQC.19 The physical phenomena that can be monitored and relied upon is spin diffusion. The next section will provide more details about spin diffusion and how it can be measured (relying on our recent work, where for the first time we experimentally measured the spin diffusion of electron spins in a solid sample20). Following this, it will be shown how the information on spin diffusion can directly lead to finding the distance between two spin labels. Several quantitative simulated data are provided to support these claims, as well as a description of the experimental capabilities required to enable spin diffusion and intramolecular spin distance measurements in the range of a few tens of nanometers.
2. Spin diffusion and its measurements
The concept of spin self-diffusion and the spin diffusion coefficient, Ds, was introduced a long time ago by Bloembergen in a seminal paper.21 Spin diffusion is a pure quantum mechanical process where the wavefunction of the spins diffuses across the sample from spin to spin, just as in conventional diffusion, but without any actual spatial motion by the spins. It is based on the fact that two interacting spins with |↑〉 and |↓〉 states can interchange their states to |↓〉 and |↑〉 states, a process commonly referred to as a “flip-flop”. The spin–spin interaction leading to such flip-flop event can occur either via a dipolar or an exchange mechanism, or both, with the former being more relevant to our case of electron spin diffusion. For identical spins, this flip-flop is energy-preserving and occurs stochastically with an average exchange rate, W, that strongly depends on the spin–spin interaction strength. Even if the energies of the two spins are not identical, the flip-flop can still occur very effectively, provided that the dipolar interaction is at least in the order of the energy difference between the spins.22 Calculations or measurements of W are far from trivial, especially in dilute electron spin systems. In principle, Wjk, (the exchange rate between spins j and k) can be calculated from first principles, assuming that the dipole interaction is a small perturbation to the Hamiltonian:21–24 | (2) |
Wjk = Kex2(3![[thin space (1/6-em)]](https://www.rsc.org/images/entities/char_2009.gif) cos2 cos2![[thin space (1/6-em)]](https://www.rsc.org/images/entities/char_2009.gif) θjk − 1)2/djk6 θjk − 1)2/djk6 | (3) |
For the sake of completeness of presentation, we briefly provide here the approximate analytical expression relating W to the spin diffusion coefficient, Ds, (using the approach of Bloembergen21 and those who followed his work). We assume a sample with S = 1/2 spins that are located on a cubic lattice with equal spacing a, and have an equal nearest neighbor flip-flop rate W = Wjk between spins j and k (assuming no other flip-flop events). We denote the polarization p(x,t) = P+(x,t) − P−(x,t), where P+(−)(x,t) is the probability of finding at x and at time t, a |+1/2〉 (|−1/2〉) state. Thus, based on the definition of W, it is possible to write that:
 | (4) |
 | (5) |
 | (6) |
3. Finding the distance between two spin labels via spin diffusion measurements
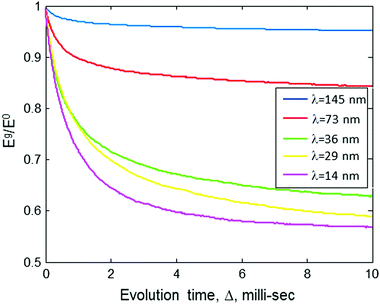
With a PGSE sequence, the measured echo decay due to diffusion can be explored as a function of two different parameters: the evolution time, Δ, and the strength of the pulsed field gradients, g (as reflected by eqn (6)). Interestingly, according to eqn (6), there is no real difference between these two parameters and both would lead to the same phenomenon of echo decay. However, this is misleading, since eqn (6) was originally developed to describe the effect of classical diffusion in real space with a homogenous sample assuming a continuous medium filled with spins. In our case of solid samples with physically fixed electron spins, the behavior of the echo decay due to changes in Δ and g would be quite different and thus the well-known Stekel–Tanner equation must be revisited.In order to qualitatively understand the reasons for deviations from the Stekel–Tanner prediction when treating samples of relevance to our present theme, let us assume the case of a solid solution of doubly-labeled macromolecules, that have a fixed intramolecular spin-pair distance of 20 nm and a mean intermolecular distance of 135 nm (corresponding 4 × 10¹⁴ molecules per cm3, or to a concentration of ∼0.66 μM). We now assume that we apply the pulse sequence of Fig. 1b and observe the echo decay due to spin diffusion as a function of the evolution time, Δ, for two types of gradient pulses, both of them with a duration of δ = 2 μs, but the first one with g = 290 T m−1 and the second one with g = 1460 T m−1. These gradient pulses correspond to values of λ = 2π/q ≈ 100 and 20 nm, respectively (where q is defined as q = γδg29). Based on the predictions of eqn (6), it seems that as we step up Δ, we should observe a meaningful exponential decay of the echo signal. In practice, due to the discreteness of the spins’ locations, and the fact that there are two very different scales of distances in the sample (the intramolecular spin-pair distance of 20 nm and the intermolecular distance of 135 nm) the behavior of the decay curve will be non-exponential, as can be seen in Fig. 2. The results of Fig. 2 are based on a numerical simulation whose details are provided in the Appendix. The “noise” is due to the relatively small number of molecules used in the simulation (100 spin pairs, but with each calculation repeated 1000 times) to keep the calculation time reasonable (about 1 h for each evolution graph in Fig. 2 on an Intel i7 2.7 GHz machine).
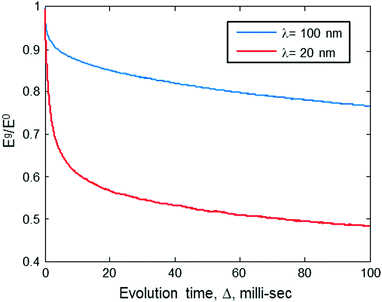 | ||
| Fig. 2 The ratio of the stimulated echo acquired by the sequence in Fig. 1b with gradient Eg, to that without gradient E0, as a function of the evolution time, Δ, for two values of gradients (corresponding to two different λ values). Results are based on numerical simulation (Appendix). The simulation assumes a sample with a molecular concentration of 4 × 10¹⁴ molecules per cm3 (0.66 μM), an intramolecular spin-pair distance of d = 20 nm, and Kex = 3.35 × 10⁵ Hz nm3. | ||
The behavior seen in Fig. 2 can be explained in the following manner: the λ value of the gradient pulses implies that spins must diffuse to a distance of ∼λ/2 so that their phases, due to the gradient pulse, would be different enough to affect the echo signal's magnitude. The first λ = 100 value that we chose is well above 20 nm, meaning that diffusion can be observed only if it is over distances of ∼50 nm or more. Namely, a diffusion to a distance of only 20 nm (as is the spin-pair distance of the doubly spin-labeled molecule) would not generate any appreciable echo decay. Thus, a drop of only ∼5% in the echo signal is observed as a rapid exponential decay during relatively short values of Δ. Furthermore, in solid-state samples (e.g., frozen solutions), spin diffusion occurs only through discrete “jumps” between spin to spin. The rate of these jumps, W, is proportional to 1/r6 (see eqn (2)), and at a spin–spin distance of r = 135 nm it is expected to be much less than 1 Hz. (Please note that our recent results show that W(r = 46 nm) ∼ 10 Hz.20) Thus, during a relatively short evolution time (Δ ≪ 1/W(r = 135 nm)), it is highly unlikely that spins would “jump” all the way to the “extra-molecular” space between molecules. Clearly, under the conditions and gradient values we specified above, it would not be possible to observe any appreciable echo decay in our sample, even for Δ of ∼10 ms. In longer evolution times, the slow exponential decay would be seen because of intermolecular spin diffusion (the molecules are randomly distributed with a mean distance of 135 nm).
Contrary to what occurs at λ ∼ 100 nm, if we increase the value of g, making λ ∼ 20 nm, then even for Δ of ∼10 ms we should be seeing an appreciable echo decay – evidence of the spin diffusion phenomenon (Fig. 2, red curve). In longer evolution times, we experience a similar slow exponential decay as observed at the lower gradient value, since both values of λ ∼ 100 and λ ∼ 20 are smaller than the mean intermolecular distance. This anomalous diffusion behavior (bi-exponential decay) is exactly the phenomena we can make use of to find the intramolecular distance between the spin pairs. Namely, if we choose to use a moderate evolution time 1/W(r = 20 nm) ≪ Δ ≪ 1/W(r = 135 nm), and then start a series of experiments while increasing the gradients g (or δ), at some point λ will start to be in the order of the intramolecular spin-pair distance and we would see a dramatic decrease in the echo magnitude. Based on this observation, we could extract the intramolecular spin-pair distance, d.
This λ-dependent anomalous onset behavior is depicted in Fig. 3, which shows the results of the numerical simulation for another sample concentration, also in the case of a doubly spin-labeled molecule with a fixed intramolecular spin-pair distance d = 20 nm. The results show a clear decay of the echo signal due to spin diffusion. It is evident that at λ ≫ d the gradients have a relatively small effect on the echo signal. When approaching the range of λ ∼ 2d the signal drops in a much more pronounced manner. However, a further increase in the gradients (corresponding to smaller λ values) does not change much the decay curve, with the initial decay limited to Eg/E0 of ∼0.5. This kind of behavior basically conforms to the description provided above, where a relatively short 10 ms evolution period is not enough to allow spin diffusion to cross the relatively large intermolecular distance of ∼200 nm in this example. This prevents any appreciable echo decay during this time frame from intermolecular sources at both small and also large λ values. However, at small λ values there is a significant rapid decay from intramolecular sources with an initial decay down to Eg/E0 of ∼0.5, but not to a lower value, because spin diffusion within the closely-spaced pair is almost completely reversible (flip-flops to both directions), as they are almost completely isolated with polarization leaking out slowly to the intermolecular space. A further reduction in λ cannot change the echo signal significantly since the maximum effects of spin diffusion (distribution of initial spin polarization equally between the two closely-spaced spins) have already been reached with λ ∼ d, and there are no spins that are closer than d and would be further affected by λ reduction.
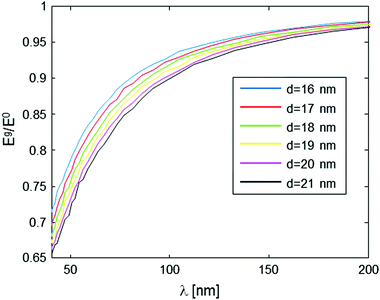
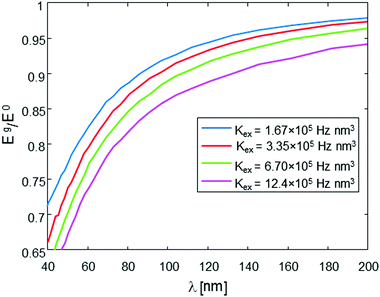
This type of behavior can be exploited in order to deduce the intramolecular spin-pair distance, d, from the experimental data. One possible way to approach this it is to acquire the Eg/E0 data for various values of g (which is inversely proportional to λ), but just for a specific, yet still plausible evolution period (e.g., 10 ms in our present example), and then plot the level of the signal at this evolution time point as a function of λ. This form of data analysis leads to the curves shown in Fig. 4. It is clear that as the intramolecular spin-pair distance on a molecule, d, is reduced, larger gradients (smaller λ values) are required to reach a regime of an appreciable decay.
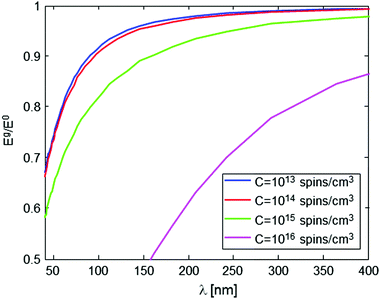
The nature and the form of the type of Eg/E0vs. λ plots shown in Fig. 4 depend only on three parameters: the intramolecular spin-pair distance, d, the sample concentration, C, and the flip-flop rate constant, Kex. This dependence is depicted in Fig. 5 and 6. In a typical experimental procedure the Eg/E0 data would be collected at a fixed Δ value of ∼10 ms, for several values of g(λ), and then the experimental curve of Eg/E0vs. λ would be fitted to the simulated data of Fig. 4. The calculation of such theoretical curves using current-day PCs can take several hours, meaning that the total fitting procedure can take around a day.
In order to properly extract d based on an experimentally-measured curve, it is therefore necessary to have a good knowledge of C and Kex. The knowledge of C (for a homogenous sample) is trivial, and furthermore, if C is small enough its exact value is of negligible importance (see Fig. 5). On the other hand, the value of Kex cannot be calculated accurately22,24 and, as can be seen in Fig. 6, it may affect the nature of the measured plot. Our recent experiments with phosphorus-doped 28Si:P have managed to measure Kex for the first time, and this type of work can be also employed for the present challenge of evaluating d. For example, Kex could be extracted from the decay curves of known samples with known d and C values, and then assumed not to change when switching to the sample with an unknown d, if the same solvent and the same temperature are used for the measurement. Alternatively, it is possible to use experimental Eg/E0vs. λ data on the molecules of interest with known concentration, but with single rather than two spin labels, and subsequently find Kex which provides the best fit of the theoretical curve to the measured data. Clearly, however, much more work is required along this line to develop a better understanding of the nature of this parameter and its dependence on the sample and environmental conditions.
Overall, it can be summarized that the accuracy of the method for determining d relies on two main parameters: the signal-to-noise-ratio (SNR) of the measured Eg/E0 plots vs. λ for a given sample, and the a priori knowledge of Kex. Based on the results shown in Fig. 4, it is clear that an SNR of at least 100 is required to make possible a good differentiation between the plots for two different d values, varying by 1 nm one from the other. This, however, assumes that Kex is well-known for the type of sample measured, or that its values are acquired using the procedure just described above. Any uncertainly in Kex will be translated to uncertainly in the fitting of d. However, based on the results of Fig. 4 and 6 it is evident that even 100% uncertainly in Kex would lead to only ∼1–2 nm uncertainly in the fitted d value, so clearly this aspect is not very critical to the accuracy of the method.
One additional issue to consider is the possibility of having a distribution of several distances, and how this might affect the measured results. Fig. 7 addresses this question, simulating the same conditions as shown in Fig. 4, but assuming that d has Gaussian distribution around its mean value with standard deviation of 1, and 5 nm (Fig. 7a and b, respectively). It is evident that for a small standard deviation (1 nm, Fig. 7a), there are very small differences compared to the original plots, for single d value (Fig. 4). However, for a relatively large standard deviation, of 5 nm (Fig. 7b), there are clear differences, with the larger average d values having smaller signal reduction than in the original plots of Fig. 4. The implication of this behavior is that it would probably be difficult to get accurate (better than ∼10%) readings of the average d in such cases of molecules having very broad distance distribution of the intramolecular spin-pair distance.
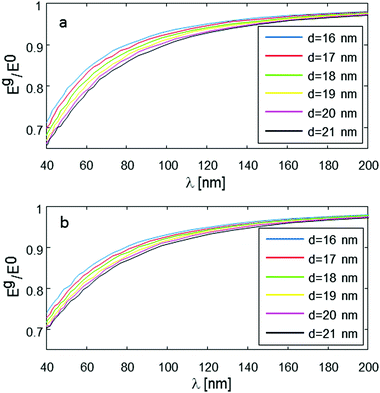 | ||
| Fig. 7 Numerical simulation of Eg/E0 with the same parameters as in Fig. 4, just assuming random distance Gaussian distribution around mean intramolecular spin-pair distance, d, with standard deviation of 1 nm (a) and 5 nm (b). | ||
4. Experimental feasibility
In this section we examine the feasibility of actually measuring spin diffusion and extracting the intramolecular spin-pair distance from it using the above-described experimental approach. There are two significant experimental difficulties that should be considered. The first experimental difficulty is applying the powerful and short magnetic field gradient pulses and subsequently collecting the ESR signal with minimal interferences. As noted above, typical values of the required gradients’ magnitude can range from 100–1000 T m−1, while their duration should be not more than 1–2 μs, in order to be comparable to typical Tm of common spin labels at cryogenic temperatures. Such capabilities have been demonstrated in the past in our laboratory35–37 and, as noted above, also in conjunction with our recent efforts where we succeeded in actually measuring spin diffusion in a solid sample of phosphorus-doped 28Si.20 It should be noted, however, that in order to apply such strong gradients over a short period of time, very compact resonators must be used that allow the involvement of miniature gradient coils with low inductance and high efficiency. Thus, for example, in our recent work with phosphorus-doped 28Si, we employed a miniature dielectric disc resonator at Q-band with inner diameter of ∼0.6 mm, outer diameter of ∼1.1 mm, and height of ∼0.2 mm. This implies that the available sample volume is limited to less than ∼0.05 μl, which in turn limits the concentration sensitivity of the measurement, giving rise to the second significant experimental difficulty. As can be learned from our discussion above, to properly measure distances in the range of d ∼ 20 nm, the sample concentration cannot exceed ∼1015 spins per cm3 (≈1.6 μM). A quantitative estimation of the available concentration sensitivity for trityl-type samples measured at temperature of ∼20–30 K (with T1 ∼ 10 ms) using such Q-band dielectric disc resonator as described above, can be made applying the known expression for spin sensitivity.38,39 Such calculation predicts concentration sensitivity values of ∼1 μM, with a signal-to-noise-ratio of 10 by acquiring signal over a few seconds of averaging time. Thus, the same probe employed for our recent diffusion measurements can in principle be used for the new distance measurement procedure we suggest here. One additional point of relevance with regards to spin sensitivity is that the level of dipolar signal oscillation measured in common DEER experiments can be smaller than the actual full ESR echo signal of the sample by factors ranging from 2 to even 100. Here, however, the spin diffusion measurements take the advantage of looking at the full stimulated echo signal (which is just a factor of 2 smaller than the Hahn echo signal), thereby significantly contributing to the sensitivity of the technique.5. Summary and outlook
A new approach was described for the measurement of the distance, d, between a pair of spin labels on a molecule. The feasibility of this approach for measuring d values of ∼20 nm was presented and discussed based on a theoretical (numerical) simulation of spin diffusion, as well as by analyzing the required experimental capabilities and setup for implementing it. A successful realization of this new approach can extend the available measureable distance between intramolecular labels by a factor of at least ∼2, which can have broad implications in the field of structural biology. A practical experimental demonstration of this approach would require the synthesis of a doubly-labeled macromolecule, with a well-defined intramolecular spin-pair distance, using spin labels that have a relatively narrow line to increase as much as possible the rate of the flip-flop. A good possible candidate for such future experiment is double-stranded DNA, which is very rigid (having a persistence length of ∼50 nm40), labeled with a trityl radical.13Appendix: numerical simulation of the echo magnitude decay due to spin diffusion
The numerical simulation follows many (typically ∼100) bi-radical molecules, randomly located in the 3D sample space, as they evolve throughout the pulse sequence of Fig. 1b. The calculation is repeated ∼1000 times, each time with different random locations of the molecules, and the results are averaged. Our experiments20 can measure the value of the stimulated echo intensity with gradients, Eg, normalized to the echo intensity without gradients, E0, thereby virtually canceling out the effects of T1 and Tm relaxation on the signal. The molecules are first randomly placed in the sample with a mean distance that corresponds to their bulk concentration. Each molecule comprises two spins that are separated by a distance d between them, with random relative orientation. Following this, the simulation applies a pulsed magnetic field gradient that creates a corresponding spatially-dependent phase profile for the spins in the sample along the z-axis (parallel to the applied static field, B0). The spins are then given the opportunity to evolve during the evolution time with small time steps Δt (typically 1–10 μs). In terms of the simulation, this means that at each time step a given spin has a chance to flip-flop with other spins. The flip-flop process between spins j and k during a given short time step, is simulated as a random stochastic Markovian event with a probability of Δt × Kex2(3![[thin space (1/6-em)]](https://www.rsc.org/images/entities/char_2009.gif) cos2
cos2![[thin space (1/6-em)]](https://www.rsc.org/images/entities/char_2009.gif) θjk − 1)2/rjk6, (based on eqn (2), with
θjk − 1)2/rjk6, (based on eqn (2), with  ). This stochastic approach was preferred over a deterministic oscillation between the two states (as can be expected for a purely environmentally-isolated two spin system23), since in our opinion it represents better the average nature of events occurring in such multi-spin interacting system. Similar simulation, using this stochastic approach, but without the interaction of closely-spaced spin pairs, showed good correspondence with the Stekel–Tanner predictions in our previous work.20 Following the evolution time, the spins are then subjected to another gradient pulse that unwinds the phase profile generated by the first pulse. If no significant spin diffusion occurred via flip-flops, the complex sum magnitude of all the spins in the sample should amount to their number. However, if many flip-flop events occurred, the complex sum becomes lower than the maximal value, as measured by our PGSE sequence. To fit the future experimental results (of Eg/E0), two possible adjustable parameters can be used in this numerical simulation: d and Kex. As noted in the text, Kex should be calibrated based on some reference samples to provide a good fit to d.
Acknowledgements
This work was partially supported by grant #310/13 from the Israel Science Foundation (ISF), grant #FA9550-13-1-0207 from the Air Force Office of Scientific Research (AFOSR), grant #3-12372 from the Israeli Ministry of Science, and by the Russell Berrie Center for Nanotechnology at the Technion.Notes and references
- G. Jeschke, Annu. Rev. Phys. Chem., 2012, 63(63), 419–446 CrossRef CAS PubMed.
- P. P. Borbat, H. S. Mchaourab and J. H. Freed, J. Am. Chem. Soc., 2002, 124, 5304–5314 CrossRef CAS PubMed.
- G. Jeschke, M. Pannier, A. Godt and H. W. Spiess, Chem. Phys. Lett., 2000, 331, 243–252 CrossRef CAS.
- O. Duss, E. Michel, M. Yulikov, M. Schubert, G. Jeschke and F. H. T. Allain, Nature, 2014, 509, 588–592 CrossRef CAS PubMed.
- O. Duss, M. Yulikov, G. Jeschke and F. H. T. Allain, Nat. Commun., 2014, 5, 3669 CAS.
- N. S. Alexander, A. M. Preininger, A. I. Kaya, R. A. Stein, H. E. Hamm and J. Meiler, Nat. Struct. Mol. Biol., 2014, 21, 56–63 CAS.
- E. R. Georgieva, P. P. Borbat, C. Ginter, J. H. Freed and O. Boudker, Nat. Struct. Mol. Biol., 2013, 20, 215–221 CAS.
- I. D. Sahu, R. M. McCarrick, K. R. Troxel, R. F. Zhang, H. J. Smith, M. M. Dunagan, M. S. Swartz, P. V. Rajan, B. M. Kroncke, C. R. Sanders and G. A. Lorigan, Biochemistry, 2013, 52, 6627–6632 CrossRef CAS PubMed.
- M. T. Lerch, Z. Y. Yang, E. K. Brooks and W. L. Hubbell, Proc. Natl. Acad. Sci. U. S. A., 2014, 111, E1201–E1210 CrossRef CAS PubMed.
- M. Azarkh, V. Singh, O. Oklre, I. T. Seemann, D. R. Dietrich, J. S. Hartig and M. Drescher, Nat. Protoc., 2013, 8, 131–147 CrossRef CAS PubMed.
- P. P. Borbat, E. R. Georgieva and J. H. Freed, J. Phys. Chem. Lett., 2013, 4, 170–175 CrossRef CAS PubMed.
- G. W. Reginsson, N. C. Kunjir, S. T. Sigurdsson and O. Schiemann, Chem. – Eur. J., 2012, 18, 13580–13584 CrossRef CAS PubMed.
- G. Y. Shevelev, O. A. Krumkacheva, A. A. Lomzov, A. A. Kuzhelev, O. Y. Rogozhnikova, D. V. Trukhin, T. I. Troitskaya, V. M. Tormyshev, M. V. Fedin, D. V. Pyshnyi and E. G. Bagryanskaya, J. Am. Chem. Soc., 2014, 136, 9874–9877 CrossRef CAS PubMed.
- W. Richard, A. Bowman, E. Sozudogru, H. El-Mkami, T. Owen-Hughes and D. G. Norman, J. Magn. Reson., 2010, 207, 164–167 CrossRef PubMed.
- P. A. S. Cruickshank, D. R. Bolton, D. A. Robertson, R. I. Hunter, R. J. Wylde and G. M. Smith, Rev. Sci. Instrum., 2009, 80, 103102 CrossRef PubMed.
- G. Jeschke, in Structural Information from Spin-Labels and Intrinsic Paramagnetic Centres in the Biosciences, ed. C. R. Timmel and J. R. Harmer, Springer Berlin Heidelberg, Berlin, Heidelberg, 2013, pp. 83–120 DOI:10.1007/430_2011_61.
- G. Jeschke, A. Koch, U. Jonas and A. Godt, J. Magn. Reson., 2002, 155, 72–82 CrossRef CAS PubMed.
- Y. W. Chiang, P. P. Borbat and J. H. Freed, J. Magn. Reson., 2005, 172, 279–295 CrossRef CAS PubMed.
- H. Sato, S. E. Bottle, J. P. Blinco, A. S. Micallef, G. R. Eaton and S. S. Eaton, J. Magn. Reson., 2008, 191, 66–77 CrossRef CAS PubMed.
- E. Dikarov, O. Zgadzai, Y. Artzi and A. Blank, Phys. Rev. Appl., 2016, 6, 044001 CrossRef.
- N. Bloembergen, Physica, 1949, 15, 386–426 CrossRef CAS.
- M. Ernst and B. Meier, Stud. Phys. Theor. Chem., Elsevier, 1998, vol. 84, pp. 83–121 Search PubMed.
- A. Abragam, The principles of nuclear magnetism, Clarendon Press, Oxford, 1961 Search PubMed.
- J. Dolinsek, P. M. Cereghetti and R. Kind, J. Magn. Reson., 2000, 146, 335–344 CrossRef CAS PubMed.
- J. E. Tanner, J. Chem. Phys., 1970, 52, 2523–2526 CrossRef CAS.
- H. Y. Carr and E. M. Purcell, Phys. Rev., 1954, 94, 630–638 CrossRef CAS.
- E. O. Stejskal and J. E. Tanner, J. Chem. Phys., 1965, 42, 288–292 CrossRef CAS.
- P. T. Callaghan, A. Coy, D. Macgowan, K. J. Packer and F. O. Zelaya, Nature, 1991, 351, 467–469 CrossRef CAS.
- P. T. Callaghan, Translational dynamics and magnetic resonance: principles of pulsed gradient spin echo NMR, Oxford University Press, Oxford, New York, 2011 Search PubMed.
- H. A. Reich, Phys. Rev., 1963, 129, 630–643 CrossRef CAS.
- J. R. Thompson, E. R. Hunt and H. Meyer, Phys. Lett. A, 1967, A25, 313–314 CrossRef.
- W. R. Zhang and D. G. Cory, Phys. Rev. Lett., 1998, 80, 1324–1327 CrossRef CAS.
- K. W. Eberhardt, S. Mouaziz, G. Boero, J. Brugger and B. H. Meier, Phys. Rev. Lett., 2007, 99, 227603 CrossRef PubMed.
- G. G. Maresch, A. Grupp, M. Mehring, J. U. Vonschutz and H. C. Wolf, J. Phys., 1985, 46, 461–464 CAS.
- Y. Talmon, L. Shtirberg, W. Harneit, O. Y. Rogozhnikova, V. Tormyshev and A. Blank, Phys. Chem. Chem. Phys., 2010, 12, 5998–6007 RSC.
- A. Blank, Y. Talmon, M. Shklyar, L. Shtirberg and W. Harneit, Chem. Phys. Lett., 2008, 465, 147–152 CrossRef CAS.
- L. Shtirberg and A. Blank, Concepts Magn. Reson., Part B, 2011, 39, 119–127 CrossRef.
- Y. Twig, E. Dikarov and A. Blank, Mol. Phys., 2013, 111, 2674–2682 CrossRef CAS.
- L. Shtirberg, Y. Twig, E. Dikarov, R. Halevy, M. Levit and A. Blank, Rev. Sci. Instrum., 2011, 82, 043708 CrossRef PubMed.
- A. Brunet, C. Tardin, L. Salome, P. Rousseau, N. Destainville and M. Manghi, Macromolecules, 2015, 48, 3641–3652 CrossRef CAS.
| This journal is © the Owner Societies 2017 |

