 Open Access Article
Creative Commons Attribution 3.0 Unported Licence
High-pressure crystallization and properties of diamond from magnesium-based catalysts
Yuri N.
Palyanov
*ab,
Igor N.
Kupriyanov
ab,
Alexander F.
Khokhryakov
ab and
Yuri M.
Borzdov
ab
aSobolev Institute of Geology and Mineralogy, Siberian Branch of Russian Academy of Sciences, Koptyug ave., 3, 630090, Novosibirsk, Russia. E-mail: palyanov@igm.nsc.ru; Fax: +7383 3 307 501; Tel: +7383 3 307 501
bNovosibirsk State University, 630090, Novosibirsk, Russia
First published on 29th June 2017
Abstract
The unique properties of diamond make it an appropriate material for various cutting-edge scientific and industrial applications. The progress in the development of new diamond based technologies is inseparably linked to research and development into the synthesis and growth of this material. For instance, developing new routes for the fabrication of diamond containing defects with specific optical, electronic and magnetic properties is crucially important for the emerging quantum technologies. Recently it has been found that diamond synthesis under high-pressure, high-temperature conditions using catalysts based on magnesium demonstrates a number of intriguing characteristics such as an extremely high growth rate, unusual micro- and macro-morphology of crystals, and effective doping of diamond with Si and Ge impurities. In this highlight, we will describe the major features of the growth, morphology, internal structure, and defect-related spectroscopic characteristics of diamonds crystallized using Mg-based catalysts under high-pressure, high-temperature conditions.
1. Introduction
The extraordinary properties of diamond have focused sustained interest over decades in research and development on the synthesis and growth of this material. At present, the main methods used to produce bulk diamond crystals are chemical vapor deposition (CVD)1,2 and growth under high pressure, high temperature (HPHT) conditions.3,4 HPHT diamond synthesis and growth relies on the catalytic ability of some substances to convert graphite into diamond under the conditions of thermodynamic stability of diamond. These substances are commonly termed as solvent-catalysts and most typically are represented by transition-metal melts, especially Fe, Ni, Co and their alloys. The processes of mass crystallization and seeded growth in these systems are fairly well understood and form the basis of modern technologies for the production of diamond abrasive powders and growing large single crystals of high quality.5 In recent decades, active research on the synthesis and growth of diamond under HPHT conditions has been carried out using a variety of solvent-catalysts. The main objectives of these investigations are connected with the fundamental aspects of diamond nucleation and growth, modeling natural diamond-forming processes, as well as with the development of new routes of synthesizing diamond crystals with specific and unusual properties, which are promising for innovative high-tech applications. Through these studies, processes and mechanisms of diamond crystallization have been studied in the melts of carbonates,6,7 sulfides,8 sulfates,9 chlorides,10 nitrides11 and carbonate–silicate media.12–14 Special studies on diamond crystallization were performed with supercritical fluids of C–O–H systems,15–18 as well as in silicate-fluid19–21 and carbonate-fluid systems,7,22 which are of interest as high-pressure analogues of the CVD process and as model environments of natural diamond formation.In the search for new routes of producing diamonds with unusual properties, special attention has been paid to elementary substances, both metals and non-metals, as possible catalysts of diamond synthesis. To date, diamond synthesis has been achieved in the melts of sulfur,23,24 phosphorus,25,26 selenium and tellurium,27 antimony,28 tin,29 germanium30 and copper.31 The use of unusual solvent-catalysts makes it possible to produce and investigate diamonds with unique properties, such as n-type semiconducting diamonds doped with phosphorus,32 superconducting boron doped diamond33 and diamonds containing new optical centers due to germanium30,34 and copper31 impurities.
In recent years, attention has been drawn to diamond crystallization in original but poorly studied systems based on a magnesium solvent-catalyst.35 Recent studies36–39 have shown considerable prospects of these systems in terms of controlled doping of diamond in the growth processes. Investigations of diamond crystallization in a Mg-based system have demonstrated a number of unique features such as extraordinary macro- and micro-morphology of diamond crystals, their extremely high growth rates, and specific characteristics of the growth, internal structure, and defect and impurity composition.37–42 In this highlight, we will describe the major characteristics of the growth, morphology, internal structure, and defect-related spectroscopic features of diamonds crystallized in Mg-based catalysts. The focus will be given on Mg–C, Mg–Si–C and Mg–Ge–C growth systems. The latter two systems are of particular interest since Si and Ge are the same group IV elements as carbon, and optically active silicon-vacancy (Si-V) and germanium-vacancy (Ge-V) centers in diamond are now the subject of intense research,43–46 being promising single-photon emitters.
2. HPHT diamond synthesis technique
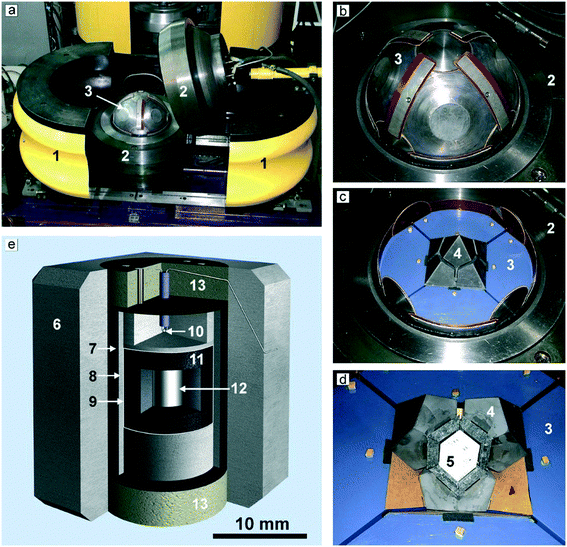
High-pressure synthesis is a powerful and well-known approach to produce advanced materials, including diamond and other superhard materials.47 Nevertheless, high-pressure, high-temperature techniques are not very common in crystal engineering and growth and we believe a brief description of the high-pressure equipment used in our studies on diamond crystallization in Mg-based systems is worth presenting. We used high-pressure multi-anvil equipment of the “split-sphere” type,48,49 also known by the Russian abbreviation BARS. The device weighing about three tons (Fig. 1a) has a spherical block of anvils 300 mm in diameter (Fig. 1b), which is housed in a split casing with a spherical inner cavity held together by a flange type lock. The hydrostatic pressure is created by oil injected by a pump into the space between the semi-spheres and the rubber membranes covering the anvil block. The two-stage multi-anvil block of the 8/6 type consists of 8 truncated steel anvils of the first stage, which form an octahedral cavity in the center (Fig. 1c), and 6 tungsten-carbide anvils of the second stage housed in this cavity (Fig. 1c and d). The WC anvils are truncated so that they form in the center of the multi-anvil block a working chamber in the form of a tetragonal prism, where a high-pressure cell with a size of 19 × 19 × 22 mm is placed. The scheme of the high-pressure cell used for the experiments is shown in Fig. 1e. In the center of thick-walled graphite capsules (6.9 mm in diameter, 6.5 mm high), a cylinder of magnesium or magnesium with other components is placed. The capsules are surrounded with a protective molybdenum foil 0.1 mm thick, and further isolated from the graphite heater with a sleeve from a mixture of MgO and CsCl. The temperature is monitored in each experiment using a PtRh6/PtRh30 thermocouple, whose junction is placed near the crystallization capsule. The pressure in the cell was calibrated at room temperature on phase transitions of Bi and PbSe with subsequent correction at high temperatures with reference to the diamond-graphite equilibrium line. Details of the calibration of the P–T parameters have been presented elsewhere.50,51 The diamond crystals and associated phases produced in the experiments have been studied by optical and electron microscopy, and by a suite of spectroscopic techniques (infrared absorption, Raman scattering, photoluminescence).3. General characteristics of diamond crystallization in the Mg-based systems
We begin by considering the major characteristics of diamond crystallization processes in the basic Mg–C system. The experiments were conducted at a pressure of 7 GPa and temperatures in the range of 1500–1900 °C with run times from 5 min to 20 h. The general scheme of diamond crystallization is illustrated in Fig. 2. With strictly controlled identity of the sample assemblies and high-pressure cells, one can consider the degree of the conversion of graphite to diamond, α, which is defined as α = MDm/(MDm + MGr) × 100, where MDm is the mass of synthesized diamond and MGr is the mass of residual graphite, as an integral characteristic of diamond crystallization processes allowing quantitative estimation of the effect of crystallization conditions. It is established from the experiments that the degree of the graphite-to-diamond conversion strongly depends on temperature (Fig. 3), which is a key factor controlling the overall reaction of diamond synthesis. In addition, diamond crystallization in the Mg–C system demonstrates a pronounced effect of kinetics. It is found that diamond nucleation is preceded by an induction period whose duration drastically changes with temperature. The factor of reaction time becomes increasingly important as the temperature decreases and defines the possibility of diamond crystallization in the Mg–C system at temperatures as low as 1500–1600 °C.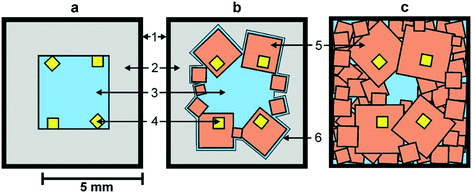 | ||
| Fig. 2 Schemes of diamond crystallization in the Mg–C system: a – initial sample assembly; b and c – crystallization schemes observed at different temperatures (see text for explanation). 1 – molybdenum; 2 – graphite capsule; 3 – magnesium; 4 – diamond seed crystals; 5 – crystallized diamonds; 6 – magnesium melt film. Reproduced from ref. 37 with permission from The Royal Society of Chemistry. | ||
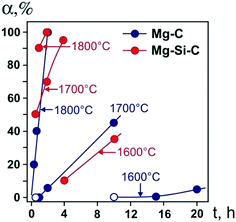 | ||
| Fig. 3 Degree of the graphite-to-diamond transformation in the Mg–C (blue circles) and Mg0.8Si0.2–C (red circles) systems as a function of reaction time at different temperatures. Open symbols refer to experiments where no spontaneous diamond nucleation was observed. Reproduced from ref. 38 with permission from The Royal Society of Chemistry. | ||
Our experiments have shown that the induction period preceding diamond nucleation is negligible at 1900 °C and progressively increases in duration as the temperature decreases. At 1700 °C, it is estimated to be between 30 and 60 min. With the temperature decrease to 1600 °C, the induction period becomes longer than 10 h. At 1500 °C, it takes more than 15 h for spontaneously nucleated diamond to appear in the run products. Conducting experiments with prolonged run times of up to 20 h and understanding the underlying effects of kinetics on the diamond crystallization process have enabled us to decrease significantly (by a few hundred degrees) the minimal temperature of diamond synthesis in the Mg–C system with respect to preceding studies.
An important characteristic reflecting the effect of growth conditions on the diamond synthesis processes is the crystal growth rate. In the case of the Mg–C system, how the diamond growth rate changes with temperature is worth considering. We can estimate the linear growth rates of the synthesized diamond crystals using the data on crystal size and experimental run duration with account of the effects of kinetics. Due to the uncertainty in determining the duration of the induction period at each temperature, calculations of the growth rates cannot be highly precise, so we aimed at estimating the maximum values of the linear growth rate at different temperatures. As shown in Fig. 4, the linear growth rate increases nearly exponentially with temperature from approximately 10 μm h−1 at 1500 °C to as high as 6–8.5 mm h−1 at 1900 °C, i.e. by three orders of magnitude.
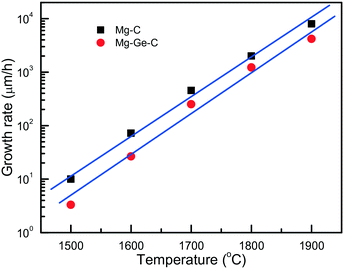 | ||
| Fig. 4 Temperature dependence of the maximum linear growth rate of diamond in the Mg–C (squares) and Mg0.9Ge0.1–C (circles) systems. Reprinted with permission from ref. 39. Copyright 2016 American Chemical Society. | ||
Next, we consider the main features of diamond crystallization in the Mg0.8Si0.2–C system38 studied under the same P–T conditions and using the same assemblies for the high-pressure cells and crystallization capsules as with the Mg–C system. One of the most evident effects of the addition of Si to the growth system is that the morphology of crystallized diamonds abruptly changes from cubic to octahedral, which will be considered in detail in a subsequent section. The overall rate of diamond synthesis is also influenced by the presence of Si. As demonstrated in Fig. 3, the addition of Si has resulted in a significant increase in the graphite-to-diamond conversion degree as compared to the basic Mg–C system. This effect is most evident at medium temperatures in the range of 1600–1800 °C. At 1500 °C, diamond synthesis is sluggish in both the Mg–C and Mg–Si–C systems with the conversion degree being less than unity, indicating their comparable catalytic abilities at this low temperature. At the highest temperature, 1900 °C, the rate of the graphite-to-diamond conversion is very high in both systems and the effect of Si is less obvious. Considering the possible causes for the increasing catalytic ability of the Mg–C system with addition of Si, we can note that one of the critical factors in HPHT catalytic synthesis of diamond is the solubility of carbon in the solvent-catalyst. It is therefore possible that higher rates of diamond synthesis in the Mg–Si–C system are caused by a higher solubility of carbon in the binary melt of two carbide-forming elements, Mg and Si.
Diamond crystallization in the Mg0.9Ge0.1–C system39 has been studied using the same approach and techniques as for the Mg–C and Mg0.8Si0.2–C systems, so these three series of experiments can be adequately compared. It is found that with the addition of germanium the degree of the graphite-to-diamond conversion in the experiments decreases significantly relative to the Mg–C and Mg–Si–C systems over the entire temperature range from 1500 to 1900 °C. Similar to the Mg–C system, the linear growth rate of diamond crystals strongly depends on temperature, showing a nearly exponential dependence (Fig. 4). As for the absolute values, our estimations have shown that, at a given temperature, the diamond growth rate in the Mg–Ge–C system is on average 2–3 times lower than in the Mg–C system. Note that these values are nevertheless still much higher than the typical growth rates of diamond using conventional transition-metal catalysts. In addition, the presence of Ge results in a decrease in the amount of diamond nucleation centers at the interface between the catalyst melt and graphite. Taking these experimental facts together, we may conclude that germanium exerts an inhibitory effect on diamond crystallization processes. The suppression of the diamond synthesis reaction, which is caused by the Ge additive, facilitates preferential diamond growth on seeds and enables production of relatively large, high-quality diamond crystals (Fig. 5).
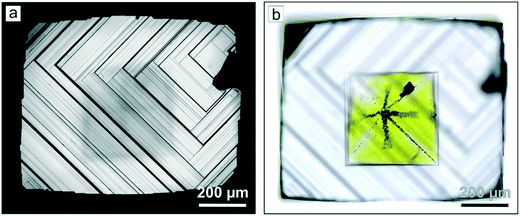 | ||
| Fig. 5 Optical micrographs of a diamond crystal grown on seeds at 1800 °C in the Mg0.9Ge0.1–C system: (a) stepped {100} face with a single growth center (reflected light); (b) the same diamond crystal in transmitted light showing a yellow-colored seed crystal in the central part. Reprinted with permission from ref. 39. Copyright 2016 American Chemical Society. | ||
The effect of Ge additive on diamond synthesis can possibly be explained by a reduced carbon solubility in the Mg–Ge–C system as compared to the Mg–C system. Indeed, it is known that germanium is not a carbide-forming element and carbon solubility in molten germanium is extremely low.52 In the experiments performed with the Mg–Ge–C system, no Mg- and Ge-containing phases other than the quenched melt are detected, indicating that the composition of the Mg–Ge catalyst melt corresponds to that of the initial mixture Mg0.9Ge0.1. We can therefore suppose that the carbon solubility in the Mg–Ge–C system is lower than in the Mg–C system, and in this respect, the effect of germanium on the diamond synthesis is opposite to that of silicon.
4. Morphology and real structure of diamond crystallized in the Mg-based systems
For the conventional transition-metal catalysts commonly used for HPHT diamond synthesis and growth, it is well known that the morphology of diamond crystals changes from cubic to octahedral as the crystallization temperature increases.53 A distinctive feature of the Mg–C system is that the morphology of the crystallized diamonds is dominated by the (100) faces over the entire temperature range from 1500 to 1900 °C (Fig. 6). Minor {111} faces can be present on these crystals, but they do not significantly affect the overall cubic morphology of the crystals. The major elements of the surface relief of the {100} faces are the echelons of rectangular macrosteps oriented along [110] directions. | ||
| Fig. 6 SEM micrographs of diamond crystals produced in the Mg–C system: (a and b) cubic crystals; (c) cubic crystals twinned along {111}. Adapted from ref. 37 with permission from The Royal Society of Chemistry. | ||
An interesting feature of diamonds crystallized in the Mg–C system is their specific coloration, which depends on the growth temperature. At the highest temperature (1900 °C), the crystals are mostly transparent and colorless, although some of them show a pale brown color. As the temperature decreases, crystals with brown coloration become more abundant. Polished cross-section plates frequently show a clear zoning along [100], appearing as the alteration of zones with different colors (Fig. 7a). Very intense dark brown coloration is typical for the boundaries between the adjacent {100} growth sectors (Fig. 7c). The outer parts of the crystals clearly demonstrate that the most colored zones are connected with the macrolayers on the {100} faces and located in the base of a dihedral angle between the {100} face and the end surface of the growing macrolayer (Fig. 7d). Nonsynchronous adjoining of the macrolayers at the {100} growth sector boundaries produces a specific “parquet” pattern (Fig. 7b). At the lowest growth temperatures (1500–1600 °C), most of the crystals have intense reddish brown coloration.
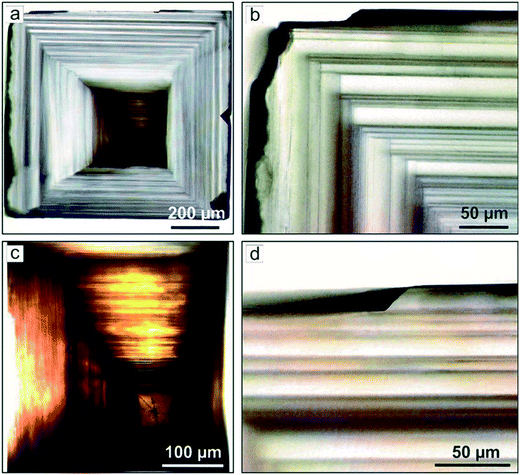 | ||
| Fig. 7 Optical micrographs of a plate prepared from a cubic diamond crystal grown on a seed in the Mg–C system: (a) overall view; (b) zoning along the {100} face; (c) an opaque central part of diamond around the seed crystal; (d) a macrolayer with the {111} end face. Reproduced from ref. 37 with permission from The Royal Society of Chemistry. | ||
Addition of Si and Ge to the Mg–C system leads to increasing development of the {111} faces in the crystal morphology, but to a significantly different extent. Diamond crystals produced in the Mg0.9Ge0.1–C system at relatively high temperatures (1800–1900 °C) have a morphology corresponding to the cube–cuboctahedron series39 (Fig. 8). The surface relief of the crystal faces in this case is similar to that of diamonds from the pure Mg–C system. The {111} faces are mirror smooth, and the {100} faces exhibit rectangular macrosteps with the ends bound by the (111) microfaces. At 1700 °C accumulations of thin growth layers appear on the {100} faces, which form rounded surfaces near the crystal edges. At the minimal synthesis temperatures (1500–1600 °C), the morphology of the crystals is determined by the {100}, {111}, and {110} faces or rounded surfaces appearing in place of these faces (Fig. 8d–f). Most of the {100} faces are not flat but show an irregular cellular surface structure. The {111} faces of the crystals frequently exhibit triangular pyramids characteristic of antiskeletal growth.
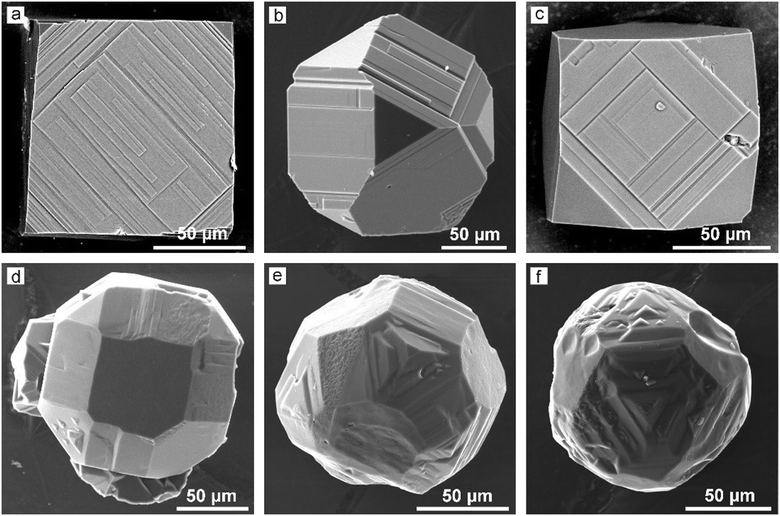 | ||
| Fig. 8 SEM micrographs of spontaneous diamond crystals synthesized in the Mg0.9Ge0.1–C system at (a–c) 1900 °C and (d–f) 1600 °C. Adapted with permission from ref. 39. Copyright 2016 American Chemical Society. | ||
It should be noted that diamond crystals produced in the Mg–C and Mg0.9Ge0.1–C systems at temperatures in the range of 1700–1900 °C sometimes show a very specific surface pattern on the {100} faces. It consists of numerous isolated growth layers, which have a shape of highly elongated rectangles. We shall consider these growth features in detail later in this section.
Diamonds crystallized in the Mg0.8Si0.2–C system have a predominantly octahedral morphology irrespective of the synthesis temperature. Minor {100} faces can sometimes be present. The majority of the crystals have {111} faces with a stepped structure, which is determined by the presence of macrolayers propagating along the [221] directions. Single or multiple sources of the growth macrolayers are located in the central part of the {111} faces. The macrolayers or macrosteps are formed by the accumulation of serrate or curvilinear microlayers. Bunching of macrosteps render the {111} faces convex stepped or polycentric in structure (Fig. 9d and e). In some parts of the {111} faces, as a result of a merger of the macrolayers, specific pyramids are formed, which are bound by the {111}, {hkk} (icositetrahedron), {100}, and {110} faces or solely {111} faces. The morphological features established for diamonds produced in the Mg0.8Si0.2–C system allow us to consider them as antiskeletal crystals formed under the influence of adsorption of impurities.
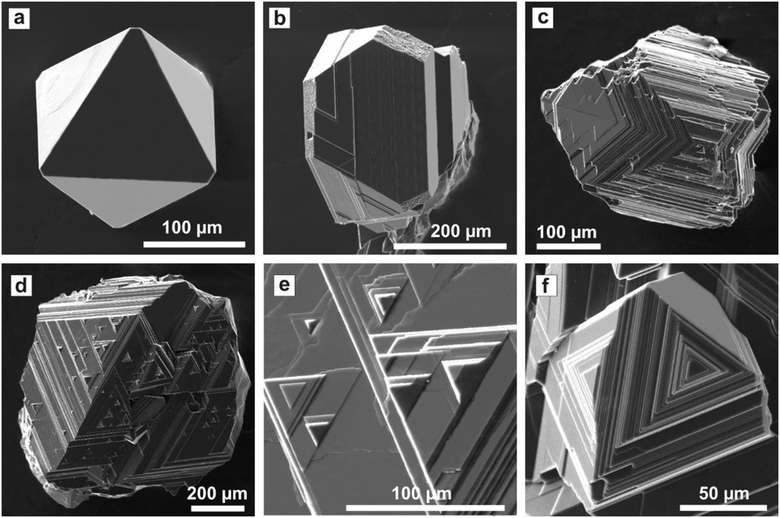 | ||
| Fig. 9 SEM micrographs of diamond produced in the Mg0.8Si0.2–C system: (a) a flat-face octahedral diamond crystal; (b) an octahedron with minor {100} faces; (c) a contact twin of diamond octahedron with faces having a stepped structure ; (d) an octahedron with faces having a polycentric structure; (e) pyramidal features and growth microlayers on the {111} face (an enlarged fragment of (d)); (f) an octahedron with convex stepped {111} faces. Reproduced from ref. 38 with permission from The Royal Society of Chemistry. | ||
Similar phenomena of the impurity action and formation of antiskeletal crystals have been found in a number of Mg-contact systems with addition of significant amounts of Cu, Ag and Ni (50–75 at%).40 At the initial stages of growth in these systems, diamond crystals have a cuboctahedral morphology. However, with increasing run duration, crystals with {311} habit surfaces showing regular striations in the [110] direction are produced (Fig. 10). The striations are formed by a combination of {111} and {100} microfaces. From the analysis of growth zones and sectors, it follows that the growth rate of the {100} faces decreases, and the ends of the {100} growth layers form the stepped surface of the {311} icositetrahedron. As a result, the {100} and {111} faces grow out and the {311} icositetrahedron appears as a form of antiskeletal growth (Fig. 11). It is found that the inhibition of the growth of faces can be related to the diffusion of oxygen into the crystallization capsule and the accompanying partial oxidation of Mg to form periclase (MgO). Periclase crystallizes preferentially at the ends of the growth steps on the {100} faces and blocks their propagation.
 | ||
| Fig. 10 SEM micrographs of diamond crystals grown in the Mg0.45Cu0.55–C system at (a) 1570 °C, (b) 1600 °C, and (c) 1650 °C. Adapted from ref. 40. Copyright 2015, with permission from Elsevier. | ||
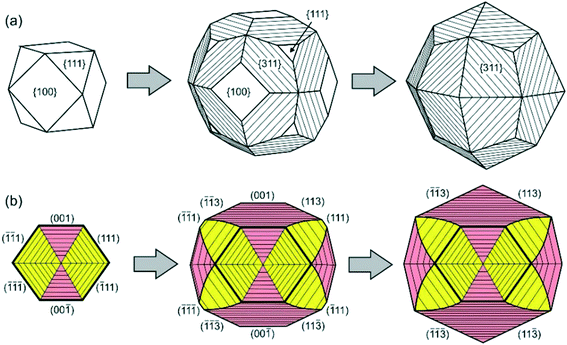 | ||
| Fig. 11 Schemes of transformation of a cube-octahedral diamond crystal to the antiskeletal form during inhibition of growth: (a) external morphology and (b) the cross-sectional view of the internal structure of diamond crystals. The growth sectors of the {100} and {111} faces are shown in pink and yellow, respectively. Reprinted from ref. 40. Copyright 2015, with permission from Elsevier. | ||
Different models have been developed to account for the effects of the crystal growth inhibition by impurities.54,55 The classic theory of Cabrera and Vermilyea54 considers the case of adsorption of large low-mobile impurity particles on the terraces and ledges between the growth layers preventing their tangential propagation. The action of this mechanism, also called the “Cabrera fence”, results in a serrated form of the growth layers and specific outgrowths on the layer ends. Similar micro-morphological features are found for the diamond crystals produced in the Mg0.8Si0.2–C system, suggesting the involvement of the Cabrera–Vermilyea mechanism of the impurity action. Previously, this mechanism was also used to explain the growth of antiskeletal diamond crystals in a metal–carbon system with H2O additives.56,57 Diamond crystals grown in the Mg-contact systems with Cu, Ag, and Ni additives do not show obvious morphological features of blocking of growth layers by the “Cabrera fence” mechanism. It is possible that in this case some other mechanism of the impurity related growth inhibition can be in operation. The deceleration of the growth rate and the change of the micro-morphology of the faces indicate that the adsorbed impurity species act to block both the propagation of the growth layers and the layers' nucleation centers.
For diamond crystals produced in the Mg–C and Mg0.9Ge0.1–C systems, no features indicating impurity adsorption effects have been found. In most cases, the dominating {100} faces have a pronounced stepped structure caused by the echelons of growth steps (Fig. 5a and 6). In addition, as noted above, some crystals produced in these systems at temperatures of 1700–1900 °C demonstrate unusual growth macrolayers on the {100} faces.41 The layers are shaped as rectangles highly elongated in one of the [110] directions with a thickness from 200 nm to 15 μm (Fig. 12). The layer elongation (length to width ratio) is different but does not exceed 23. The ends of the macrolayers in most cases are composed of {111} microfaces, and their growth occurred by layers along these microfaces. The highly elongated layers are present in high amounts on those {100} faces which do not exhibit strong sources of macrostep trains. To elucidate the possible nature of these elongated macrolayers, we applied selective etching, which is an efficient technique to reveal various extended lattice defects emerging on a crystal surface.58 Analysis of the etched crystal surfaces has shown that the elongated macrolayers are not associated with the outcrops of dislocations or planar defects. Consequently, we can infer that these growth features are formed through two-dimensional and possibly three-dimensional nucleation, which is facilitated by a high concentration of carbon at the growing {100} characteristic of the kinetically limited growth regime. The fact that these two-dimensional islands are only rarely present in the faces, which show strong sources of growth layers, can be explained by their easy consumption or burying by the propagating echelons of macrolayers.
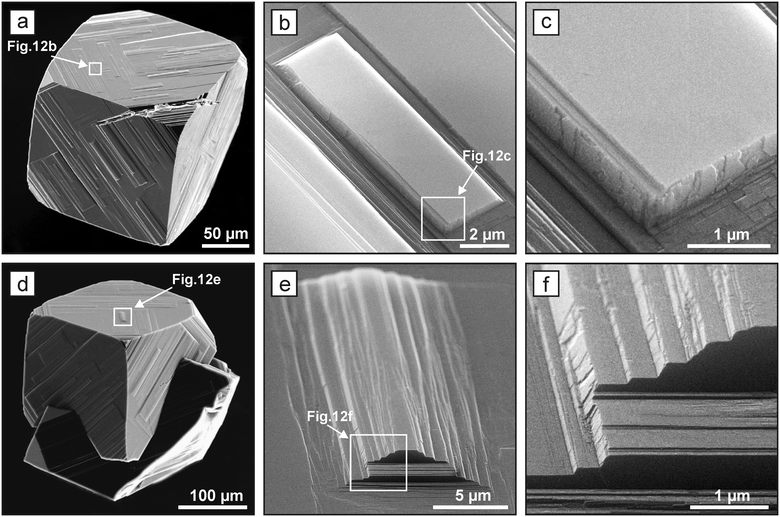 | ||
| Fig. 12 SEM micrographs of highly elongated macro layers on the {100} faces of spontaneous diamond crystals grown in magnesium-based systems. Adapted from ref. 41. Copyright 2016, with permission from Elsevier. | ||
An unusual feature of the structure of the macrolayers and highly elongated layers is worth paying attention to. In accordance with the classical models of crystal growth, it is thought that macrolayers on crystal faces are accumulations of elementary layers. However, the macrolayers present on the {100} faces of diamonds crystallized in the Mg-based systems have ends bound by the {111} faces and do not appear as accumulations of the elementary growth layers. The ends of the steps, at least those with thicknesses from 0.2 to 15 μm, grow by layers along the {111} faces41 (Fig. 12c and f). Similar growth layers with a height of hundreds of nm and ends having a constant slope have been observed previously upon growth of other crystalline materials.59,60 Earlier it has been found that such layers are stable only for kinetically limited growth and their growth rate exceeds that of the elementary layers. Our results show that the macrolayers on the studied diamond crystal forms by the layered growth of their ends by {111} faces. This possibly explains their record growth rates of up to 8.5 mm h−1. There is no satisfactory theory explaining this phenomenon so far, and it obviously requires more attention.
We finish this section by considering the results of studies of seed grown diamond crystals by means of selective etching and X-ray topography.42 It has been found that the crystals contain relatively high amounts of dislocations of two types: full edge dislocations and 45° mixed dislocations. Despite the high dislocation density in the grown layers, the dominating sources of diamond growth layers in the Mg–C system are the localized circular accumulations of the edge dislocations (Fig. 13). It is established that for diamonds grown at 1900 °C the dislocation structure is completely determined by the structure of the seed crystals and the average dislocation density is about 105 cm−2 (Fig. 14d–f). Diamond crystals grown at 1800 °C contain higher amounts of dislocations of the order of 107–108 cm−2 due to the nucleation of dislocations both at the interface between the seed and the growth layer and directly in the growth layers (Fig. 14a–c). The high density of the inherited and newly formed dislocations leads to the misorientation of some blocks up to 1° with formation of the low-angle boundaries in the {100} growth sectors with dislocation densities up to 109 cm−2. The fact that the dislocation structure of crystals grown at high temperatures is mainly determined by the seed crystals opens certain prospects for growing high-quality diamonds in the Mg–C system. The use of seed crystals with a low dislocation content would allow producing diamond crystals with high structural perfection.
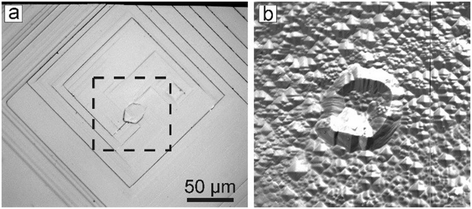 | ||
| Fig. 13 Micrograph images of fragments of the {100} face of a diamond crystal showing growth layer nucleation (a) before and (b) after etching. The image in (b) corresponds to the square shown with dashed lines in (a). Adapted from ref. 42. Copyright 2016, with permission from Elsevier. | ||
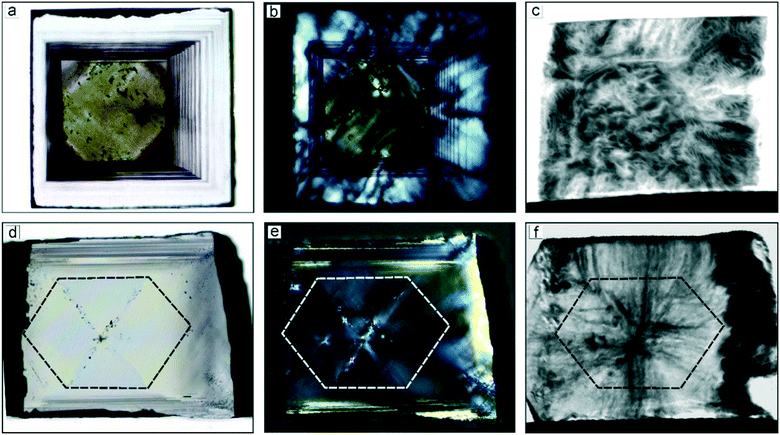 | ||
| Fig. 14 Images of a diamond crystal grown in the Mg–C system at (a–c) 1800 °C (size 0.9 × 0.8 × 0.8 mm) and (d–f) 1900 °C (size 0.85 × 0.63 mm, 0.23 mm thick): (a and d) optical micrograph, transmitted light; (b and e) optical micrograph, transmitted polarized light; (c and f) X-ray topographs. The boundary of the seed crystal is shown with dashed lines. Adapted from ref. 42. Copyright 2016, with permission from Elsevier. | ||
5. The peculiarities of diamond crystallization mechanisms in the Mg-based systems
Summing up the main regularities of diamond synthesis in the Mg–C and Mg-based systems, here, we briefly discuss on the possible mechanisms of diamond crystallization. Analysis of the experimental data provides clear evidence that the predominant mechanism of diamond crystallization in the studied systems is through the chemical potential difference between diamond and graphite, which is frequently referred to as the film growth (FG) mechanism. In this case, diamond spontaneously nucleates at the interface between the graphite source and the molten catalyst and then grows at the expense of carbon diffusing through a thin film of the catalyst melt separating the growing crystal from the graphite source. It is found that the FG process operates in the temperature range of 1700–1900 °C and accounts for the majority of diamonds crystallized from the Mg-based catalysts at these temperatures. A minor part of diamond crystals are found in the central part of the capsules directly in the bulk of the catalyst melt. These diamonds are likely to crystallize via the temperature gradient growth (TGG) process. However, given the short duration of the experiments at high temperatures and the specificity of the crystallization scheme, designed primarily for the implementation of FG process, the TGG process has only subordinate action. At lower temperatures, in the range of 1500–1600 °C, the situation is different and no evidence of the action of FG and TGG processes is established. In this case, diamond crystals, located in the peripheral part of the melt, are found only in experiments with relatively long reaction times. In addition, MgO is detected in the products of these experiments, indicating oxygen diffusion into the crystallization capsules. Based on these facts, we can suggest that at these low temperatures, diamond crystallizes through a redox process. Diffusion of oxygen into the capsule can change the system composition and, accordingly, reduce the melting temperature. The carbon-saturated magnesium melt partly oxidizes to form MgO. As a consequence, the portion of the catalyst melt decreases and carbon oversaturation sufficient for diamond synthesis is created. Recently, a similar redox process has been demonstrated in the experiments on diamond formation through the reactions between molten iron and carbonates.61It should be noted that the FG mechanism of diamond crystallization dominating in the Mg-based systems is in fact the main method of diamond synthesis at HPHT conditions, which is employed for industrial production of diamond crystals from conventional transition-metal solvent-catalysts. Therefore, some distinctive features of diamond crystallization from these two types of the catalysts are worth comparing. In the case of transition-metal catalysts, growth layers nucleate mainly near the edges and corners of the growing crystal face and propagate to the face center. Increasing carbon supersaturation in the melt leads first to the formation of depressions in the central part of the crystal faces, then to the entrapment of large inclusions of the catalyst melt at the site of depressions, and eventually to the formation of skeletal crystals. In addition, diamond crystals synthesized with transition-metal catalysts typically show bands of small metallic inclusions tracing the growth sector boundaries. All these features are indicative of the diffusion-controlled regime of diamond crystal growth.62 When diamond crystallizes from the Mg-based catalysts, growth layers originate at active sources lying on the crystal faces and propagate to the face edges. New growth layers appear before the previous ones reach the face edges and corners. As a result, the produced crystals have either flat or convex stepped faces. Among the hundreds of crystals synthesized in the Mg-based systems, we have not found any crystal demonstrating signs of skeletal growth as well the specific bands of inclusions tracing the growth sector boundaries. In all cases, the sources of growth layers were located arbitrarily on the faces, and the emergence of new layers occurred before the previous layers reached the vertices and edges. As a result, the crystals obtained had either flat or convex stepped faces.
It is found that the maximum linear rate of diamond growth in the Mg–C system almost exponentially depends on temperature and varies from 10 μm h−1 at 1500 °C to 8.5 mm h−1 at 1900 °C, which is 8–10 times higher than the diamond growth rate in conventional metal–carbon systems. The combination of the determined temperature dependences of the crystal morphology and internal structure, as well as the nucleation and growth kinetics, indicates that diamond growth in the Mg–C and Mg-based systems occurs in a kinetically controlled regime.
6. Spectroscopic characteristics of diamonds crystallized in the Mg-based systems
In this section, we will consider the main features of the defect-and-impurity structure of diamonds crystallized in the Mg–C, Mg0.8Si0.2–C and Mg0.9Ge0.1–C systems as revealed by the spectroscopic techniques. Microscopic infrared absorption measurements show that the crystals produced in these systems do not contain nitrogen impurities in amounts detectable with this techniques (<5–10 ppm) and demonstrate either no impurity-related absorption, corresponding to type IIa diamond, or relatively weak absorption features related to boron impurities (type IIb) (Fig. 15). The concentration of the uncompensated boron acceptors, as estimated from the strength of the boron-related absorption peaks, is within 0.1–1 ppm. As is known, nitrogen is the dominant impurity in both synthetic and natural diamonds. With HPHT diamond growth from conventional transition metal solvent-catalysts, the concentration of nitrogen in the grown crystals can be reduced by adding to the system special elements that are able to form nitrides and act as nitrogen getters (typically Al, Ti, Zr). Magnesium is a nitride-forming element, and therefore acts as a nitrogen getter and facilitates growth of type II diamond. Boron, as is known, can be easily incorporated into diamond crystals grown from transition-metal solvent-catalysts.63–66 Investigations into the growth of high-purity type IIa diamonds have demonstrated that if the carbon source material or the melt solvent contains boron impurities, even at concentrations as low as a few ppm, the produced diamond crystals may contain uncompensated boron acceptors of the order of 0.1 ppm.65,66 In addition, it has been found that the concentration of the uncompensated boron acceptors in diamond increases with increasing crystallization temperature.67 According to the producer's specification, the graphite used in our experiments contains about 1 × 10⁻⁴ wt% of boron. It is therefore possible that the relatively high concentrations of boron impurities (up to about 1 ppm) found for diamonds synthesized in the Mg-based systems may be due to the significantly higher crystallization temperatures in our experiments (1700–1900 °C) than those typically used for diamond growth with conventional transition-metal catalysts (1350–1500 °C).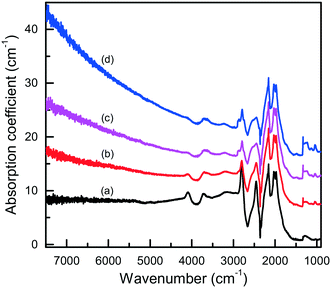 | ||
| Fig. 15 Infrared spectra of diamond crystals synthesized in the Mg–C system. Spectra were measured for samples showing different intensities of brown coloration from (a) near colorless to (d) dark reddish brown. The spectra are displaced vertically for clarity. Reproduced from ref. 37 with permission from The Royal Society of Chemistry. | ||
The IR spectra presented in Fig. 15 also illustrate another interesting feature of the studied diamonds. It can be seen that along with the absorption bands due to the boron acceptors, an absorption steadily increasing toward larger wavenumbers is present in the spectra. Crystals showing this continuous absorption have coloration, which depending on the strength of the continuous absorption varies from light brown to dark reddish brown or even black. In general, brown-colored diamond crystals are more frequent for the Mg–C system than for the Mg–Si–C and Mg–Ge–C systems. Also, there is a tendency that with increasing growth temperature the abundance of brown-colored diamonds in the experiments decreases. Neither the observed continuous absorption, extending from the infrared part of the spectrum to the visible part, nor the specific brown coloration are typical for synthetic diamonds grown from conventional transition metal catalysts and the nature of these features is not very clear at the moment. Some possible parallels can be drawn with the problem of brown coloration of natural plastically deformed diamonds and low quality CVD diamonds, which have been the subject of active research over the past decade.68 It has been generally accepted now that the featureless absorption spectrum of brown diamonds is due to multi-vacancy defects whose inner surfaces comprise π-bonded carbon and where there is strong overlap between nearby sp2 atoms.68,69 Providing the concentration of these defects is high, vibrational signatures of π-bonded carbon, which characteristically lie at around 1500 cm−1 (ref. 70), can possibly be detected by Raman scattering. Therefore, we measured the Raman spectra for a number of diamond crystals synthesized in the Mg–C system and showing different intensities of the brown coloration. Only a peak at 1332 cm−1 due to the zone-center optical phonon of diamond is found in the Raman spectra of colorless and lightly colored samples. For dark brown samples, a number of additional relatively broad bands are detected (Fig. 16), the most intense of which is a band peaking at around 1480 cm−1. The intensity of the 1480 cm−1 band, normalized to the diamond Raman peak, is found to correlate with the strength of the brown coloration. Thus, we can speculate that some defects containing sp2-bonded carbon, such as vacancy clusters, can be present in diamonds synthesized in the Mg-based systems and are responsible for their specific coloration. Obviously, further more detailed investigations involving high-resolution transmission electron microscopy are required to confirm or deny this hypothesis.
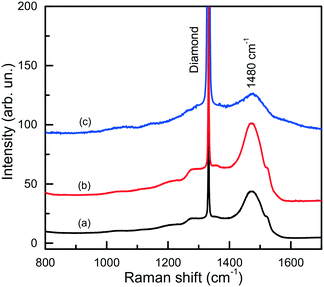 | ||
| Fig. 16 Raman spectra of dark brown diamonds produced in the Mg–C system. The spectra were measured with the 532-nm excitation at (a) 300 and (b) 80 K, and (c) with the 325-nm excitation at 300 K. Spectra (a) and (b) are normalized to the Raman diamond peak intensity, while spectrum (c) is multiplied by a factor of 100. The spectra are displaced vertically for clarity. Reproduced from ref. 37 with permission from The Royal Society of Chemistry. | ||
Next, we consider further remarkable features of diamonds synthesized in the Mg-based systems, which concern their photoluminescence spectra. Irrespective of the synthesis conditions, diamonds produced in these systems typically exhibit photoluminescence due to the well-known 1.68 eV silicon-vacancy (Si-V) centers. The corresponding spectrum comprises a zero-phonon line (ZPL) peaking at 1.680 eV at room temperature and a tail at lower photon energies due to phonon-assisted transitions (Fig. 17a). In the low temperature (about 80 K) spectra, the ZPL splits into a doublet, whose components are separated by about 1.1 meV (Fig. 17b and c). The 1.68 eV silicon-vacancy center is known to be a characteristic feature of diamonds produced by the chemical vapor deposition (CVD). Unintentional doping of CVD diamonds with Si is frequently observed, being a consequence of plasma etching of silicon containing reactor components.71,72
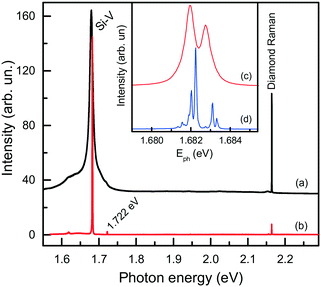 | ||
| Fig. 17 Typical photoluminescence spectra of diamond crystals synthesized in the Mg–C system. The spectra were measured with the 532 nm excitation at (a) 300, (b and c) 80 and (d) 10 K. The spectra are displaced vertically for clarity. The inset shows the ZPL region of the 1.68 eV center at (c) 80 and (d) 10 K. Adapted from ref. 37 with permission from The Royal Society of Chemistry. | ||
For HPHT diamonds grown from conventional transition-metal solvent-catalysts, the Si-V centers are normally not found, but can be produced if the growth system is deliberately doped with Si (typical amounts 5–10 wt% Si).73,74 In the present case, experiments with the Mg–C and Mg–Ge–C systems were conducted without Si additives and it was present only as a trace impurity in the starting reagents (mainly in graphite) in amounts of the order of 100–200 wt ppm. Nevertheless, synthesized diamond crystals exhibit the Si-V centers as the dominant PL feature.
We found that diamonds crystallized via spontaneous nucleation at temperatures of around 1700 °C show the highest intensities of PL from the 1.68 eV Si-V centers. In this case, with the 532 nm laser excitation, the intensity of the 1.68 eV peak is 2–3 orders of magnitude higher than that of the first-order diamond Raman line. These diamonds are also remarkable having very low levels of internal strains, which makes it possible to observe the 12-line fine structure of the 1.68 eV ZPL system (Fig. 17d), corresponding to three silicon isotopes and orbitally degenerate ground and excited states.73 Diamonds crystallized via the seeded growth typically show less intense emission from the 1.68 eV Si-V centers.
Diamond crystals produced in the Mg0.8Si0.2–C system are, as expected, characterized by strong photoluminescence from the 1.68 eV Si-V centers. Comparing crystals produced under similar conditions in the Mg–C and Mg–Si–C systems, we can infer that in the latter case the intensity of the 1.68 eV PL peak is on average higher, but in most cases the ZPL is broadened and does not split into a doublet in the low-temperature spectra. Apparently, this can be due to higher levels of internal strains in these crystals. Interestingly, diamonds synthesized in the Mg0.8Si0.2–C system also show a specific feature in the IR spectra, which is absent in the spectra of diamonds from the Mg–C and Mg0.9Ge0.1–C systems. This is a sharp absorption peak located at 1338 cm−1 (Fig. 18), i.e. at wavenumbers slightly higher than that of the highest energy zone-center phonons of diamond (1332 cm−1). There are several papers75–77 noting that for CVD diamonds deliberately doped with silicon, an absorption peak at around 1338 cm−1 can be observed in the IR spectra. Unfortunately, no details of the measured spectra and Si doping levels are provided in these works, so a comparison with the present results is not possible. Nevertheless, it is reasonable to suppose that the 1338 cm−1 peak reported for Si-doped CVD diamonds and found for the HPHT diamonds from the Mg0.8Si0.2–C system has the same origin and is caused by Si-related defects, e.g. single substitutional silicon. As suggested by theoretical calculations reported by Goss et al. (ref. 75), the 1338 cm−1 peak can be related to a localized mode originating due to the strain surrounding substitutional silicon atoms in the diamond lattice. These strains, in turn, can be responsible for the broadening of the zero-phonon lines of the 1.68 eV Si-V center.
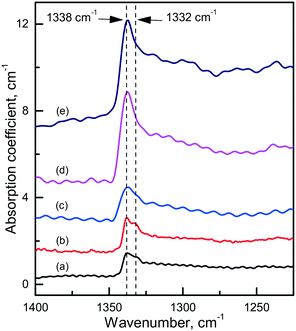 | ||
| Fig. 18 Infrared spectra demonstrating the 1338 cm−1 absorption peak. The spectra were recorded for diamonds synthesized in the Mg0.8Si0.2–C system at (a) 1700 °C, (b and c) 1800 °C and (d and e) 1900 °C. The spectra are displaced vertically for clarity. Reproduced from ref. 38 with permission from The Royal Society of Chemistry. | ||
Considering the diamonds produced in the Mg0.8Si0.2–C system, it is also worth mentioning that in addition to the 1.68 eV center, a peak located at 1.722 eV is present in the PL spectra of the majority of the crystals examined. As a rule, this peak has a much lower intensity than that of the 1.682 eV line. However, in some cases the PL spectra exhibited the 1.682 and 1.722 eV peaks of comparable intensity. Recently, a similar PL band at about 1.72 eV has been observed for Si-doped CVD diamonds grown at somewhat higher than normal temperatures.78 It appears plausible that the center responsible for the 1.722 eV system is related to Si impurities, but its composition and structure are not clear at the moment.
We now consider photoluminescence characteristics of diamond crystals produced in the Mg0.9Ge0.1–C system.39 One of the main ideas behind exploring diamond crystallization from the Mg–Ge–C system is to check if the Mg-based catalysts being favorable for Si incorporation in diamond would also favor the incorporation of Ge. Indeed, it is found that the crystals produced over the entire range of temperatures from 1500 to 1900 °C all show two characteristic features in the PL spectra, comprising the 1.68 eV Si-V centers and 2.06 eV Ge-V centers. The emission intensities of the 1.68 and 2.06 eV systems vary depending on the growth temperature and crystallization mechanism, namely, whether the crystals form via spontaneous nucleation or seeded growth. Fig. 19 demonstrates the representative spectra recorded for spontaneous diamonds synthesized at 1700 °C, which show the highest emission intensities from the Si-V and Ge-V centers of all the diamond samples studied. The spectra recorded at room temperature are dominated by the 1.68 and 2.06 eV ZPL peaks, broadened due to thermal effects, and accompanied by the respective phonon sidebands. In the spectra recorded at 80 K, both the 1.68 and 2.06 eV ZPL peaks become much narrower and show a doublet structure. The intensity of the ZPLs is about two orders of magnitude higher than that of the diamond Raman line. The photoluminescence spectra measured for diamond crystals produced in the same runs at 1700 °C but via the growth on seeds are in general similar to those of spontaneous crystals. The major difference is that the intensity of the 2.06 eV band is considerably lower, being in this case at maximum about 4–5 times higher than the intensity of the diamond Raman line. Diamond crystals produced at higher temperatures, namely, 1800 and 1900 °C, show even lower intensities of PL from the Ge-V centers, suggesting that the efficiency of Ge incorporation into diamond decreases with increasing temperature. With these diamonds, it has been possible to locate individual Ge-V centers and to demonstrate optical and microwave control of the Ge-V center spin state.46
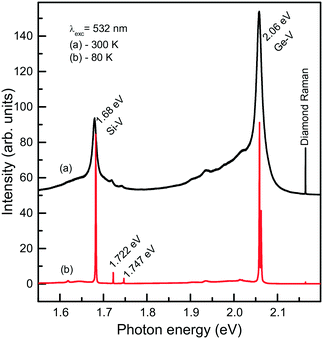 | ||
| Fig. 19 Representative PL spectra measured at (a) 300 and (b) 80 K for spontaneous diamond crystals synthesized in the Mg0.9Ge0.1–C system at 1700 °C. The spectra are displaced vertically for clarity. Reprinted with permission from ref. 39. Copyright 2016 American Chemical Society. | ||
The capabilities of the Mg–Ge–C system were further explored by growing diamond crystals doped with germanium isotopes, namely, 70Ge, 73Ge, 74Ge. High-resolution photoluminescence spectra were measured at about 10 K for spontaneously nucleated diamond crystals, which show a very low level of internal strains (Fig. 20). It is found that when 70Ge is replaced by 74Ge, the components of the ZPL structure of the 2.06 eV center shift by 0.18(2) meV to lower energies, which fairly agrees with previously reported data34 and confirms the involvement of Ge in the defect responsible for this optical center. The 73Ge isotope is the only stable germanium isotope having non-zero nuclear magnetic moment (I = 9/2) and can serve for unambiguous identification of defects containing Ge atoms by electron paramagnetic resonance (EPR). Investigations of diamond crystals doped with 73Ge isotopes reveal a paramagnetic center with spin S = 1/2 and hyperfine structure (HFS) of 10 lines, proving the involvement of one Ge atom in the structure of the defect.79
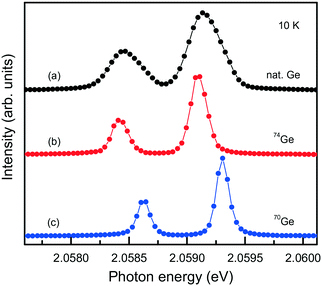 | ||
| Fig. 20 PL spectra showing the ZPL region of the 2.06 eV system measured for diamond crystals synthesized in the Mg0.9Ge0.1–C system with the use of (a) Ge with natural isotopes, (b) 74Ge isotopes and (c) 70Ge isotopes. The spectra are displaced vertically for clarity. Adapted with permission from ref. 39. Copyright 2016 American Chemical Society. | ||
Finally, it is of interest to obtain quantitative estimations of the concentration of the Si-V and Ge-V centers in diamonds crystallized in the Mg-based systems. Usually, this can be achieved by measuring optical absorption spectra in the range of the corresponding zero-phonon lines. Then, from the integrated absorption strength of a ZPL the concentration of the relevant centers can be calculated, providing the calibration factor is known.80 The difficulty with this approach is that most of the diamond crystals produced in the Mg-based systems have small sizes and irregular shapes and, therefore, cannot be easily examined using commercial UV/vis/NIR spectrophotometers. Nevertheless, we attempted at detecting optical absorption due to the Si-V and Ge-V centers with a simple one-beam method employing an optical microscope (an Olympus BX41) attached to a spectrometer (a Horiba J.Y. LabRAM HR 800). The microscope was operated in transmission mode with a halogen lamp as the light source. The absorption measurements were performed at 80 K using a Linkam THMS350V temperature controlled stage attached to the microscope. For the diamond sample shown in Fig. 7, which is produced in the Mg–C system, we measured transmission spectra from several locations over the sample and the calculated absorption spectra are shown in Fig. 21(a). It follows that the strength of the 1.68 eV absorption band, and consequently the concentration of the Si-V centers, are not constant over the sample but decreases from the central parts to the periphery of the sample. A similar tendency is also found from the photoluminescence measurements. To estimate the concentration of the Si-V centers, we used the following calibration equation:81
| A1.68 = [3.6(±0.7) × 10−15] × [Si-V], | (1) |
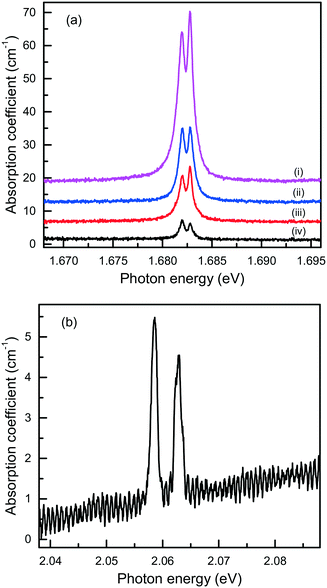 | ||
| Fig. 21 Optical absorption spectra, recorded at 80 K, of diamond crystals produced in the (a) Mg–C and (b) Mg0.9Ge0.1–C systems. The spectra in panel (a) were measured from different locations from the center (i) to the periphery (iv) of the diamond sample shown in Fig. 7, and displaced vertically for clarity. | ||
7. Summary and outlook
Summarizing the results obtained so far on diamond crystallization in Mg-based systems, we can conclude that it demonstrates a number of specific features such as high P–T parameters, a high growth rate up to record levels (8.5 mm h−1), exceeding all known data, and an unusual morphology with its strong dependence on added impurities such as Si, as well as the diffusion of oxygen into the crystallization capsules. Comprehensive investigations of diamond crystallization processes in Mg-based systems and the detailed study of the produced crystals suggest diamond growth in a kinetically limited regime with the participation of a two-dimensional nucleation mechanism.In order to obtain a deeper understanding of the processes and mechanisms of diamond crystallization in the basic Mg–C system, it is of interest to determine the effect of the pressure factor on the processes of nucleation and growth. This is probably one of the main parameters that will help to control the process of spontaneous crystallization of diamond. It is very interesting to investigate the effect of temperature on the crystallization and properties of diamond in the unexplored range of extreme temperatures from 1900 to 2200 °C. In order to produce diamond crystals controllably doped with Si and Ge and understand the effect of Si and Ge additives on the diamond crystallization processes, systematic studies of the Mg–Si–C and Mg–Ge–C systems with variable Mg/Si and Mg/Ge ratios over a wide range of compositions are highly pertinent.
Using growth systems based on a magnesium catalyst, it is possible to produce diamonds doped with impurities that are difficult or impossible to incorporate into diamond during its crystallization in other solvent-catalysts. One of the reasons making it possible to incorporate into diamond impurities such as Si and Ge, in our opinion, is the ultra-reduced nature of these systems. In this regard, further investigations aimed at possible doping of diamond with a range of impurity elements are of great interest. This is particularly important in view of the heated interest in color centers in diamond, which are proving to be a promising platform for the emerging technologies of quantum information processing,86 electromagnetic field sensing,87 and bio-imaging.88
Acknowledgements
This work was supported by the Russian Science Foundation under Grant No. 14-27-00054. The authors are grateful to Y. V. Bataleva, D. V. Nechaev, T. V. Molyavina and A. Y. Mogileva for their assistance in the course of the study and manuscript preparation.Notes and references
- W. G. Eversole, US Pat. 3030187. Synthesis of diamond, 1960, filed 23.07.1958 Search PubMed.
- B. V. Spitsyn and B. V. Deryagin, USSR Pat. 339134, A technique of diamond growth on diamond's face, 1980, filed 10.07.1956 Search PubMed.
- F. P. Bundy, H. T. Hall, H. M. Strong and R. H. Wentorf Jr., Nature, 1955, 176, 51–55 CrossRef CAS.
- H. P. Bovenkerk, F. P. Bundy, H. T. Hall, H. M. Strong and R. H. Wentorf Jr, Nature, 1959, 184, 1094–1098 CrossRef CAS.
- R. J. Wedlake, in: The properties of diamond, ed. J. E. Field, Academic Press, London, 1979, pp. 501–535 Search PubMed.
- M. Akaishi, H. Kanda and S. Yamaoka, J. Cryst. Growth, 1990, 104, 578–581 CrossRef CAS.
- Y. N. Pal'yanov, A. G. Sokol, Y. M. Borzdov, A. F. Khokhryakov and N. V. Sobolev, Nature, 1999, 400, 417–418 CrossRef.
- Y. N. Pal'yanov, Y. M. Borzdov, Y. V. Bataleva, A. G. Sokol, G. A. Palyanova and I. N. Kupriyanov, Earth Planet. Sci. Lett., 2007, 260, 242–256 CrossRef.
- M. Akaishi, H. Kanda and S. Yamaoka, Jpn. J. Appl. Phys., 1990, 29, L1172 CrossRef CAS.
- Y. Wang and H. Kanda, Diamond Relat. Mater., 1998, 7, 57–63 CrossRef CAS.
- Y. M. Borzdov, Y. N. Pal'yanov, I. N. Kupriyanov, V. A. Gusev, A. F. Khokhryakov, A. G. Sokol and A. V. Efremov, Diamond Relat. Mater., 2002, 11, 1863–1870 CrossRef CAS.
- M. Arima, K. Nakayama, M. Akaishi, S. Yamaoka and H. Kanda, Geology, 1993, 21, 968–970 CrossRef CAS.
- Y. N. Palyanov, V. S. Shatsky, A. G. Sokol, A. A. Tomilenko and N. V. Sobolev, Dokl. Earth Sci., 2001, 381, 935–938 Search PubMed.
- Y. N. Palyanov, A. G. Sokol, A. F. Khokhryakov and A. N. Kruk, Russ. Geol. Geophys., 2015, 56, 196–210 CrossRef.
- S. Yamaoka, M. Akaishi, H. Kanda and T. Osawa, J. Cryst. Growth, 1992, 125, 375 CrossRef CAS.
- M. Akaishi, M. S. D. Kumar, H. Kanda and S. Yamaoka, Diamond Relat. Mater., 2000, 9, 1945–1950 CrossRef CAS.
- Y. N. Palyanov, A. G. Sokol, A. F. Khokhryakov, G. A. Palyanova, Y. M. Borzdov and N. V. Sobolev, Dokl. Earth Sci., 2000, 375, 1395–1398 Search PubMed.
- A. G. Sokol, Y. N. Pal'yanov, G. A. Pal'yanova and A. A. Tomilenko, Geochem. Int., 2004, 42, 830–838 Search PubMed.
- Y. M. Borzdov, A. G. Sokol, Y. N. Palyanov, A. A. Kalinin and N. V. Sobolev, Dokl. Akad. Nauk, 1999, 366, 530–533 CAS.
- A. G. Sokol and Y. N. Palyanov, Contrib. Mineral. Petrol., 2008, 155, 33–43 CrossRef CAS.
- A. J. Fagan and R. W. Luth, Contrib. Mineral. Petrol., 2011, 161, 229–236 CrossRef CAS.
- Y. N. Palyanov, I. N. Kupriyanov, A. G. Sokol, Y. M. Borzdov and A. F. Khokhryakov, Lithos, 2016, 265, 339–350 CrossRef CAS.
- K. Sato and T. Katsura, J. Cryst. Growth, 2001, 223, 189–194 CrossRef CAS.
- Y. N. Pal'yanov, Y. M. Borzdov, I. Kupriyanov, V. Gusev, A. Khokhryakov and A. Sokol, Diamond Relat. Mater., 2001, 10, 2145–2152 CrossRef.
- M. Akaishi, H. Kanda and S. Yamaoka, Science, 1993, 259, 1592–1593 CAS.
- Y. N. Palyanov, I. N. Kupriyanov, A. G. Sokol, A. F. Khokhryakov and Y. M. Borzdov, Cryst. Growth Des., 2011, 11, 2599–2605 CAS.
- S. J. Lv, S. M. Hong, C. S. Yuan and Y. Hu, Appl. Phys. Lett., 2009, 95, 242105 CrossRef.
- Y. N. Palyanov, Y. M. Borzdov, I. N. Kupriyanov, Y. V. Bataleva, A. F. Khokhryakov and A. G. Sokol, Cryst. Growth Des., 2015, 15, 2539–2544 CAS.
- Y. N. Palyanov, Y. M. Borzdov, I. N. Kupriyanov, Y. V. Bataleva and A. F. Khokhryakov, Diamond Relat. Mater., 2015, 58, 40–45 CrossRef CAS.
- Y. N. Palyanov, I. N. Kupriyanov, Y. M. Borzdov and N. V. Surovtsev, Sci. Rep., 2015, 5, 14789 CrossRef CAS PubMed.
- I. N. Kupriyanov, Y. M. Borzdov and Y. N. Palyanov, Diamond Relat. Mater., 2016, 69, 198–206 CrossRef CAS.
- H. Kanda and S. Koizumi, in Innovative Superhard Materials and Sustainable Coatings for Advanced Manufacturing, ed. J. Lee and N. Novikov, Springer, Amsterdam, 2005, pp. 233–245 Search PubMed.
- E. A. Ekimov, V. A. Sidorov, E. D. Bauer, N. N. Mel'Nik, N. J. Curro, J. D. Thompson and S. M. Stishov, Nature, 2004, 428, 542–545 CrossRef CAS PubMed.
- E. A. Ekimov, S. G. Lyapin, K. N. Boldyrev, M. V. Kondrin, R. Khmelnitskiy, V. A. Gavva, T. V. Kotereva and M. N. Popova, JETP Lett., 2015, 102, 701–706 CrossRef CAS.
- N. V. Novikov and A. A. Shul'zhenko, in Science and Technology of New Diamond, ed. S. Saito, O. Fukunaga and M. Yoshikawa, KTK Sci. Pub./Terra Sci. Pub., Tokyo, 1990, pp. 217–219 Search PubMed.
- T. V. Kovalenko and S. A. Ivakhnenko, J. Superhard Mater., 2013, 35, 131–136 CrossRef.
- Y. N. Palyanov, Y. M. Borzdov, I. N. Kupriyanov, A. F. Khokhryakov and D. V. Nechaev, CrystEngComm, 2015, 17, 4928–4936 RSC.
- Y. N. Palyanov, I. N. Kupriyanov, Y. M. Borzdov and Y. V. Bataleva, CrystEngComm, 2015, 17, 7323–7331 RSC.
- Y. N. Palyanov, I. N. Kupriyanov, Y. M. Borzdov, A. F. Khokhryakov and N. V. Surovtsev, Cryst. Growth Des., 2016, 16, 3510–3518 CAS.
- A. F. Khokhryakov, A. G. Sokol, Y. M. Borzdov and Y. N. Palyanov, J. Cryst. Growth, 2015, 426, 276–282 CrossRef CAS.
- A. F. Khokhryakov, D. V. Nechaev and Y. N. Palyanov, J. Cryst. Growth, 2016, 455, 76–82 CrossRef CAS.
- A. F. Khokhryakov, D. V. Nechaev, Y. N. Palyanov and K. E. Kuper, Diamond Relat. Mater., 2016, 70, 1–6 CrossRef CAS.
- T. Muller, C. Hepp, B. Pingault, E. Neu, S. Gsell, M. Schreck, H. Sternschulte, D. Steinmuller-Nethl, C. Becher and M. Atature, Nat. Commun., 2014, 5, 3328 Search PubMed.
- L. J. Rogers, K. D. Jahnke, T. Teraji, L. Marseglia, C. Muller, B. Naydenov, H. Schauffert, C. Kranz, J. Isoya, L. P. McGuinness and F. Jelezko, Nat. Commun., 2014, 5, 4739 CrossRef CAS PubMed.
- T. Iwasaki, F. Ishibashi, Y. Miyamoto, Y. Doi, S. Kobayashi, T. Miyazaki, K. Tahara, K. D. Jahnke, L. J. Rogers, B. Naydenov, F. Jelezko, S. Yamasaki, S. Nagamachi, T. Inubushi, N. Mizuochi and M. Hatano, Sci. Rep., 2015, 5, 12882 CrossRef CAS PubMed.
- P. Siyushev, M. H. Metsch, A. Ijaz, J. M. Binder, M. K. Bhaskar, D. D. Sukachev, A. Sipahigil, R. E. Evans, C. T. Nguyen, M. D. Lukin, P. R. Hemmer, Y. N. Palyanov, I. N. Kupriyanov, Y. M. Borzdov, L. J. Rogers and F. Jelezko, 2016, arXiv:1612.02947 [quant-ph], Accepted for publication in Physical Review B, 2017.
- L. Zhang, Y. Wang, J. Lv and Y. Ma, Nat. Rev. Mater., 2017, 2, 17005 CrossRef CAS.
- Y. N. Palyanov, Y. M. Borzdov, A. F. Khokhryakov, I. N. Kupriyanov and A. G. Sokol, Cryst. Growth Des., 2010, 10, 3169–3175 CAS.
- Y. Palyanov, I. Kupriyanov, A. Khokhryakov and V. Ralchenko, in Handbook of Crystal Growth, ed. P. Rudolph, Elsevier, Amsterdam, 2nd edn, 2015, ch.17, vol. 2a, pp. 671–713 Search PubMed.
- Y. N. Pal'yanov, A. G. Sokol, Y. M. Borzdov and A. F. Khokhryakov, Lithos, 2002, 60, 145–159 CrossRef.
- A. G. Sokol, Y. M. Borzdov, Y. N. Palyanov and A. F. Khokhryakov, High Pressure Res., 2015, 35, 139–147 CrossRef CAS.
- R. I. Scace and G. A. Slack, J. Chem. Phys., 1959, 30, 1551–1555 CrossRef CAS.
- R. C. Burns and G. J. Davies, in: The properties of natural and synthetic diamond, ed. J. E. Field, Academic Press, London, 1992, pp. 395–422 Search PubMed.
- N. Cabrera and D. A. Vermilyea, in Growth and Perfection of Crystals, ed. R. H. Doremus, B. W. Roberts and D. Turnbull, Chapman & Hall, London, 1958, p. 393 Search PubMed.
- K. Sangwal, Additives and Crystallization Processes: From Fundamentals to Applications, John Wiley & Sons Ltd, Chichester, England, 2007, p. 451 Search PubMed.
- Y. N. Palyanov, Y. M. Borzdov, I. N. Kupriyanov and A. F. Khokhryakov, Cryst. Growth Des., 2012, 12, 5571–5578 CAS.
- Y. N. Palyanov, A. F. Khokhryakov, Y. M. Borzdov and I. N. Kupriyanov, Cryst. Growth Des., 2013, 13, 5411 CAS.
- A. F. Khokhryakov and Y. N. Palyanov, J. Cryst. Growth, 2006, 293, 469–474 CrossRef CAS.
- T. A. Land, T. L. Martin, S. Potapenko, G. T. Palmore and J. J. DeYoreo, Nature, 1999, 399, 442–445 CrossRef CAS.
- T. N. Thomas, T. A. Land, W. H. Casey and J. J. DeYoreo, Phys. Rev. Lett., 2004, 92, 216103 CrossRef CAS PubMed.
- Y. N. Palyanov, Y. V. Bataleva, A. G. Sokol, Y. M. Borzdov, I. N. Kupriyanov, V. N. Reutsky and N. V. Sobolev, Proc. Natl. Acad. Sci. U. S. A., 2013, 110, 20408–20413 CrossRef CAS PubMed.
- A. A. Chernov, in Modern Crystallography III. Crystal Growth, ed. M. Cardona, P. Fulde and H.-J. Queisser, Springer Verlag, Berlin, 1984, p. 517 Search PubMed.
- R. H. Wentorf and H. P. Bovenkerk, J. Chem Phys., 1962, 36, 1987–1990 CrossRef CAS.
- H. M. Strong and R. M. Chrenko, J. Phys. Chem., 1971, 75, 1838–1843 CrossRef CAS.
- R. C. Burns, V. Cvetkovic, C. N. Dodge, D. J. F. Evans, M.-L. T. Rooney, P. M. Spear and C. M. Welbourn, J. Cryst. Growth, 1990, 104, 257–279 CrossRef CAS.
- H. Sumiya and S. Satoh, Diamond Relat. Mater., 1996, 5, 1359–1365 CrossRef CAS.
- V. D. Blank, M. S. Kuznetsov, S. A. Nosukhin, S. A. Terentiev and V. N. Denisov, Diamond Relat. Mater., 2007, 16, 800–804 CrossRef CAS.
- R. Jones, Diamond Relat. Mater., 2009, 18, 820–826 CrossRef CAS.
- L. Hounsome, R. Jones, P. M. Martineau, D. Fisher, M. J. Shaw, P. R. Briddon and S. Öberg, Phys. Rev. B: Condens. Matter Mater. Phys., 2006, 73, 125203 CrossRef.
- A. C. Ferrari and J. Robertson, Philos. Trans. R. Soc., A, 2004, 362, 2477–2512 CrossRef CAS PubMed.
- J. Barjon, E. Rzepka, F. Jomard, J. M. Laroche, D. Ballutaud, T. Kociniewski and J. Chevallier, Phys. Status Solidi A, 2005, 202, 2177–2181 CrossRef CAS.
- J. Achard, A. Tallaire, R. Sussmann, F. Silva and A. Gicquel, J. Cryst. Growth, 2005, 284, 396–405 CrossRef CAS.
- C. D. Clark, H. Kanda, I. Kiflawi and G. Sittas, Phys. Rev. B: Condens. Matter Mater. Phys., 1995, 51, 16681–16688 CrossRef CAS.
- G. Sittas, H. Kanda, I. Kiflawi and P. M. Spear, Diamond Relat. Mater., 1996, 5, 866–869 CrossRef CAS.
- J. P. Goss, P. R. Briddon and M. J. Shaw, Phys. Rev. B: Condens. Matter Mater. Phys., 2007, 76, 075204 CrossRef.
- C. M. Breeding and W. Wang, Diamond Relat. Mater., 2008, 17, 1335–1344 CrossRef CAS.
- A. M. Edmonds, Ph.D. Thesis, University of Warwick, 2008 Search PubMed.
- V. S. Sedov, V. S. Krivobok, A. V. Khomich, V. G. Ralchenko, A. A. Khomich, A. K. Martyanov, S. N. Nikolaev, O. N. Poklonskaya and V. I. Konov, J. Appl. Spectrosc., 2016, 83, 229–233 CrossRef CAS.
- V. Nadolinny, A. Komarovskikh, Y. Palyanov, I. Kupriyanov, Y. Borzdov, M. Rakhmanova, O. Yuryeva and S. Veber, Phys. Status Solidi A, 2016, 213, 2623–2628 CrossRef CAS.
- G. Davies, Phys. B, 1999, 273–274, 15–23 CrossRef CAS.
- U. F. S. D'Haenens-Johansson, A. M. Edmonds, B. L. Green, M. E. Newton, G. Davies, P. M. Martineau, R. U. A. Khan and D. J. Twitchen, Phys. Rev. B: Condens. Matter Mater. Phys., 2011, 84, 245208 CrossRef.
- U. F. S. D'Haenens-Johansson, A. M. Edmonds, M. E. Newton, J. P. Goss, P. Briddon, J. M. Baker, P. M. Martineau, R. U. A. Khan, D. J. Twitchen and S. D. Williams, Phys. Rev. B: Condens. Matter Mater. Phys., 2010, 82, 155205 CrossRef.
- A. M. Edmonds, M. E. Newton, P. M. Martineau, D. J. Twitchen and S. D. Williams, Phys. Rev. B: Condens. Matter Mater. Phys., 2008, 77, 245205 CrossRef.
- H. Sternschulte, K. Thonke, R. Sauer, P. C. Munzinger and P. Michler, Phys. Rev. B: Condens. Matter Mater. Phys., 1994, 50, 14554 CrossRef CAS.
- E. Neu, D. Steinmetz, J. Riedrich-Moller, S. Gsell, M. Fischer, M. Schreck and C. Becher, New J. Phys., 2011, 13, 025012 CrossRef.
- Quantum Information Processing with Diamond, ed. S. Prawer and I. Aharonovich, Woodhead Publishing, 2014, p. 330 Search PubMed.
- J. M. Taylor, P. Cappellaro, L. Childress, L. Jiang, D. Budker, P. R. Hemmer, A. Yacoby, R. Walsworth and M. D. Lukin, Nat. Phys., 2008, 4, 810–816 CrossRef CAS.
- A. S. Barnard, Analyst, 2009, 134, 1751–1764 RSC.
| This journal is © The Royal Society of Chemistry 2017 |

