 Open Access Article
Creative Commons Attribution 3.0 Unported Licence
Will they co-crystallize?†
Jerome G. P.
Wicker
 a,
Lorraine M.
Crowley
 b,
Oliver
Robshaw
a,
Edmund J.
Little
a,
Stephen P.
Stokes
b,
Richard I.
Cooper
b,
Oliver
Robshaw
a,
Edmund J.
Little
a,
Stephen P.
Stokes
b,
Richard I.
Cooper
 a and
Simon E.
Lawrence
 *b
*b
aChemical Crystallography, Chemistry Research Laboratory, Mansfield Road, Oxford, UK
bDepartment of Chemistry, Analytical and Biological Chemistry Research Facility, Synthesis and Solid-Sate Pharmaceutical Centre, University College Cork, Cork, Ireland. E-mail: simon.lawrence@ucc.ie
First published on 5th July 2017
Abstract
A data-driven approach to predicting co-crystal formation reduces the number of experiments required to successfully produce new co-crystals. A machine learning algorithm trained on an in-house set of co-crystallization experiments results in a 2.6-fold enrichment of successful co-crystal formation in a ranked list of co-formers, using an unseen set of paracetamol test experiments.
Co-crystals are multi-component crystalline materials that can be assembled via hydrogen bonds,1–5 halogen bonds6–8 and/or π⋯π stacking.9,10 Co-crystallization has attracted academic and industrial interest because it allows the physiochemical properties of active pharmaceutical ingredients (APIs) to be altered, for example bioavailability and solubility,11,12 compressibility,13 hygroscopic stability,14 intrinsic dissolution rate,15 and thermal properties.16
The four most common hydrogen bond supramolecular synthons used in the design-phase of co-crystallization studies are shown in Fig. 1.17 For a hydrogen-bonded co-crystal to form, there must be a degree of complementarity between the two components (co-formers), thus, careful co-former selection is crucial.18,19 The hierarchical nature of supramolecular synthons is considered a key factor in accessing heteromeric interactions in the solid state. The work of Margaret Etter is fundamental in our understanding of hydrogen bond hierarchy.20,21
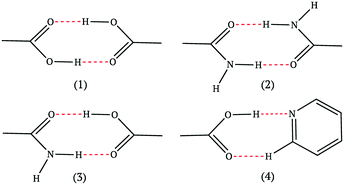 | ||
| Fig. 1 The most common supramolecular synthons observed in co-crystals.17 | ||
In addition to ‘Etter's rules’, Hunter reported a set of numerical guidelines for quantifying the molecular interactions of organic molecules in the solid state, by assigning hydrogen bond strength parameters based on calculations of the molecular electrostatic potential surface to hydrogen bond donors and acceptors.22 Since the strongest donors and acceptors are likely to hydrogen bond with each other,21 a hierarchical list of these can be used to predict the interaction energy for each pairing until all possible contacts have been made, with excess donors or acceptors ignored. The sum of these interaction energies gives a measure of the stability of a co-crystal relative to the pure components without any knowledge of three-dimensional structure.23 This approach provides an estimate of the probability of a co-crystal forming, allowing a set of potential crystal co-formers to be ranked and has been shown to be able to identify new co-crystals.
Previous methods to predict co-crystal formation have focussed on comparison of melting points of the co-crystal and the pure components,16 or co-crystal structure prediction.24 However, such methods are computationally expensive and require significant calculation for each new set of potential co-crystal components, since the method requires generation of trial structures. It has also been reported that effective co-crystal screening can be achieved using a fluid-phase thermodynamics model to calculate the excess enthalpy of the interactions between a mixture of API and co-former relative to the pure components in a virtually supercooled liquid mixture (which can be approximated to the mixed solid phase crystal).25
Experimentally, determination of new co-crystals involves systematic screening with a large range of co-formers, typically analysed via IR, DSC, and powder X-ray diffraction (PXRD), with single crystal X-ray diffraction used if possible. Although this approach is effective, it is costly in both time, effort and laboratory resources, particularly when considering the number of failed attempts in a traditional co-crystal screen.
Statistical analysis of the descriptors of components of co-crystal structures extracted from the Cambridge Structural Database (CSD) has uncovered correlations between the shape and polarity of co-formers,26 but the lack of data on failed co-crystallization experiments mean that no predictive model has been derived from this to date.
A knowledge-based method based on hydrogen bond propensity (HBP) analysis27 of the CSD28 to determine the likelihood of co-crystal formation by assessing the probability of the homo- and hetero-interactions has been shown to successfully identify some co-crystals of paracetamol.29
Machine learning algorithms can be used to produce predictive empirical models from suitable data and have previously been applied to successfully predict whether small organic molecules will or will not crystallize, using molecular descriptors calculated from a two-dimensional representation of a molecule.30 More recently, artificial neural networks have been successfully applied to predict the melting points of co-crystals.31 Such data-driven approaches have not been used to directly predict co-crystal formation.
In this paper, we report the use of a machine learning algorithm to generate a predictive model which can classify pairs of co-formers as successful or unsuccessful with respect to co-crystallization using simple descriptors of the co-former molecules. Estimates of the potential success of a particular pair of co-formers can be used to generate a ranked list that will enrich the identification of experimentally-determined successful co-formers at the top of the list.
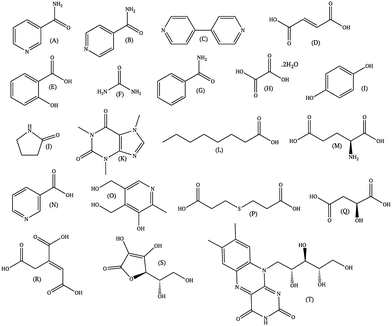
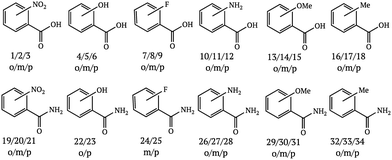
Since the literature contains almost exclusively positive results for co-crystallization studies, it was necessary to generate a landscape of both positive and negative experimental data to support the training of the machine learning algorithm. A set of 20 target molecules was initially selected to be screened against 34 substituted aromatic acid and amide co-formers (Fig. 2 and 3). Careful consideration was given in the selection process to incorporate the potential for the four main supramolecular synthons (Fig. 1). Assessment of co-crystal formation was based upon changes in the PXRD pattern when accompanied in IR by a shift of the characteristic peaks traditionally involved in hydrogen bonding. In some cases, DSC was also used to assess co-crystal formation. Experimental data for all three techniques are in the ESI.†
191 standard molecular descriptors were calculated for each compound using the RDKit cheminformatics toolkit, version Q1 2016.32 The descriptors for certain amine, amide and ether functional groups were slightly modified to uniquely identify the functional groups in more complex molecules, while additional descriptors were added to account for aryl halides. This gave a total of 195 descriptors for each co-former compound, see ESI.† Co-crystal descriptors were created by concatenating the co-former descriptors and the acid or amide descriptors along with an extra descriptor implementing the values developed by Hunter22 This gave a total of 391 descriptors for each potential co-crystal.
The label “1” was assigned to known or experimentally determined co-crystals or salts and the label “0” assigned to those experiments that did not result in a new solid form. Those combinations for which the outcome was uncertain were removed from the dataset, giving a total of 657 training data points (403 unsuccessful, 254 successful). Of these 254 successful data points, 44 were already reported in the literature (39 co-crystals and 5 salts) and the remaining 210 represent novel solid forms. We are confident that this training data is a useful set for predicting co-crystal formation due to the low number of salts found in the CSD, and the low success of salt formation from dry grinding, although the likelihood of co-crystal over salt formation can be assessed by comparing co-former and API pKa values.33
Machine learning algorithms and performance metrics from version 17.0 of the scikit-learn package were used.34 Support vector machines (SVMs) were used as the machine learning algorithm to create the predictive model using the molecular descriptors, having previously been found to give the best performance for a similar classification problem.30 The best-performing parameters for the algorithm were determined by a grid-search of parameters using a five-fold cross-validation on the entire training dataset35 and were subsequently fixed at values of C = 10 and gamma = 0.001. A balanced class weighting was used to account for the potential bias caused by the greater number of unsuccessful co-crystal experiments in the training set.
An external validation set was created from Wood et al., which collated paracetamol studies from a variety of sources.29,36–38 This gave a total of 34 potential co-formers, of which 13 successfully formed co-crystals.‡ The descriptors were calculated in the same way as for the training set.
In addition to the classification accuracy on the validation set, the capability of the approach to “enrich” the number of successful hits in a ranked list was calculated, since this has practical application in reducing the number of experiments required to find co-crystal forms. For the external validation set, the co-crystals were ranked according to the probability estimate given by the predictive model. This was compared to the actual hits in order to quantify how many successful co-crystals were identified by this selection method. From this ranking, an enrichment factor (EF) provides a numerical score that quantifies the observed success rate at the top of the list relative to randomly sampling the list. For the top x% of the ranked list:
The probability estimates from the predictive models were also used to generate a receiver operating characteristic (ROC) curve for the validation set classification, which measures the ability of the model to rank the successful co-crystals relative to the unsuccessful ones.39 The area under the curve (AUC) provides a quantitative measure of the accuracy of the ranking.39,40
The predictive accuracy of the model in classifying the co-formers as forming successful or unsuccessful co-crystals with paracetamol was poor at 64.7%, much lower than the cross-validation accuracy on the training set (75.0% ± 1.4%). The confusion matrix (Table 1) shows that the model has a tendency towards predicting more of the combinations as being successful co-crystals, which reduces the number of false negatives (successful co-crystals that are incorrectly marked as unlikely to form and so would be missed). This may be a result of differences between paracetamol and the co-formers making up the training set, which could affect the reliability of the probability cut-off that the model uses to make its predictions.
| Predicted co-crystal | Predicted no co-crystal | |
|---|---|---|
| Co-crystal formed | 12 true positive | 1 false negative |
| No co-crystal formed | 11 false positive | 10 true negative |
However, Fig. 4 shows that the list of co-formers ranked by the probabilities obtained from the model successfully identifies 9 of the 13 co-crystals of paracetamol within the top 11 suggestions in the list. The AUC of 0.85 is significantly better than the AUC of 0.66 obtained from the HBP method,29 as shown in Fig. 5. This gave an EF25 of 2.6, corresponding to 100% successful prediction in the top 8 (25%). This suggests that although the probability cut-off between successful and failed co-crystals used by the algorithm to perform the binary classification may be wrongly positioned, the probability ranking itself provides a way of identifying co-formers which are likely to form co-crystals, reducing the number of experiments required to successfully identify co-former pairings.
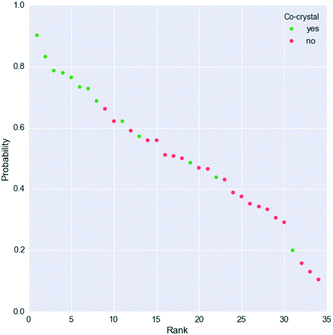 | ||
| Fig. 4 Probability ranking by the model for the paracetamol external validation set. Green dots indicate successful co-crystals, whereas unsuccessful co-formers are represented as red dots. More information is given in the ESI.† | ||
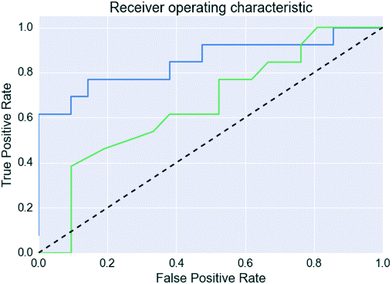 | ||
| Fig. 5 Receiver operating characteristic curves for the paracetamol validation set. The blue line is this work, the green line uses the predictions made in Wood et al.,29 and the dashed line indicates a random classification. | ||
The importance of ensuring that co-former molecules lie in a similar area of chemical space to the molecules used for training the model is illustrated by salsalate, for which the current model predicts the same probability of co-crystal formation regardless of the co-former paired with it. On examination of the scaled descriptors, 39 salsalate descriptors are found to have values greater than 3 standard deviations from the mean of the training set (compared to 5 descriptors for paracetamol). This is an indicator that the distance between salsalate and the training molecules in chemical space is too great for the model to provide a sensible prediction. Consequently the descriptors of test molecules need to be examined carefully after scaling to ensure that the existing model is suitable for use with that particular molecule, and extension of the training set to sample a more appropriate area of chemical space should be considered if this is not the case.
The ability of the model to successfully rank co-formers other than those included in the training dataset indicates that the co-formers and descriptors used to train the model provide enough information to allow the model to be applied to a wide range of co-formers. Increasing the scope of the model can be envisaged by retraining the algorithm using a larger range of APIs and co-formers.
In comparison to other methods used for predicting the ability of molecules to co-crystallize together,26,29 this approach requires a large amount of experimental work to be undertaken to generate the initial training set. Academic and industrial researchers in the field will have access to previous experimental data containing both successful and unsuccessful results, meaning that this will not hinder the implementation of this methodology.
In summary, we have demonstrated that a machine learning algorithm trained on an in-house set of co-crystallization experiments using simple descriptors as the input can be used to guide selection of co-formers for a particular API. This is likely to assist industry by saving both time and resources on experimental screens, particularly in the early stages of co-former selection.
Conflicts of interest
There are no conflicts to declare.Acknowledgements
This publication has emanated from research conducted with the financial support of the Irish Research Council under Grant Number RS/2011/462 (L. M. C.) and J. G. P. W. is supported by a joint EPSRC doctoral training partnership grant EP/L50503/1 and an STFC postgraduate studentship. S. E. L. thanks University College Cork 2013 Research Fund and Science Foundation Ireland under grant no. 07/SRC/B1158 (S. P. S.) and 05/PICA/B802/EC07.Notes and references
- C. B. Aakeroy, A. M. Beatty and B. A. Helfrich, J. Am. Chem. Soc., 2002, 124, 14425–14432 CrossRef PubMed.
- C. B. Aakeröy, B. M. T. Scott and J. Desper, New J. Chem., 2007, 31, 2044–2051 RSC.
- C. B. Aakeröy, M. E. Fasulo and J. Desper, Mol. Pharmaceutics, 2007, 4, 317–322 CrossRef PubMed.
- C. B. Aakeröy, S. Forbes and J. Desper, J. Am. Chem. Soc., 2009, 131, 17048–17049 CrossRef PubMed.
- A. Mukherjee and G. R. Desiraju, Cryst. Growth Des., 2014, 14, 1375–1385 CAS.
- K. S. Eccles, R. E. Morrison, S. P. Stokes, G. E. O'Mahony, J. A. Hayes, D. M. Kelly, N. M. O'Boyle, L. Fábián, H. A. Moynihan, A. R. Maguire and S. E. Lawrence, Cryst. Growth Des., 2012, 12, 2969–2977 CAS.
- K. S. Eccles, R. E. Morrison, C. A. Daly, G. E. O'Mahony, A. R. Maguire and S. E. Lawrence, CrystEngComm, 2013, 15, 7571–7575 RSC.
- D. Cinčić, T. Friščić and W. Jones, CrystEngComm, 2011, 13, 3224–3231 RSC.
- H. Zhang, C. Guo, X. Wang, J. Xu, X. He, Y. Liu, X. Liu, H. Huang and J. Sun, Cryst. Growth Des., 2013, 13, 679–687 CAS.
- H. M. Titi and I. Goldberg, Acta Crystallogr., Sect. C: Cryst. Struct. Commun., 2009, 65, o639–o644 CAS.
- J. F. Remenar, S. L. Morissette, M. L. Peterson, B. Moulton, J. M. MacPhee, H. R. Guzmán and Ö. Almarsson, J. Am. Chem. Soc., 2003, 125, 8456–8457 CrossRef CAS PubMed.
- S. L. Childs, L. J. Chyall, J. T. Dunlap, V. N. Smolenskaya, B. C. Stahly and G. P. Stahly, J. Am. Chem. Soc., 2004, 126, 13335–13342 CrossRef CAS PubMed.
- S. Karki, T. Friščić, L. Fabián, P. R. Laity, G. M. Day and W. Jones, Adv. Mater., 2009, 21, 3905–3909 CrossRef CAS.
- Z. Z. Wang, J. M. Chen and T. B. Lu, Cryst. Growth Des., 2012, 12, 4562–4566 CAS.
- F. Grifasi, M. R. Chierotti, K. Gaglioti, R. Gobetto, L. Maini, D. Braga, E. Dichiarante and M. Curzi, Cryst. Growth Des., 2015, 15, 1939–1948 CAS.
- G. L. Perlovich, CrystEngComm, 2015, 17, 7019–7028 RSC.
- C. B. Aakeröy and D. J. Salmon, CrystEngComm, 2005, 7, 439–448 RSC.
- G. M. Desiraju, J. Am. Chem. Soc., 2013, 135, 9952–9967 CrossRef CAS PubMed.
- S. Fukte, M. Wagh and S. Rawat, Int. J. Pharm. Pharm. Sci., 2014, 6, 9–14 CAS.
- M. C. Etter, J. Am. Chem. Soc., 1982, 104, 1095–1096 CrossRef CAS.
- M. C. Etter, J. Phys. Chem., 1991, 95, 4601–4610 CrossRef CAS.
- C. A. Hunter, Angew. Chem., Int. Ed., 2004, 43, 5310–5324 CrossRef CAS PubMed.
- T. Grecu, C. A. Hunter, E. J. Gardiner and J. F. McCabe, Cryst. Growth Des., 2014, 14, 165–171 CAS.
- N. Issa, P. G. Karamertzanis, G. W. A. Welch and S. L. Price, Cryst. Growth Des., 2009, 9, 442–453 CAS.
- Y. A. Abramov, C. Loschen and A. Klamt, J. Pharm. Sci., 2012, 101, 3687–3697 CrossRef CAS PubMed.
- L. Fábián, Cryst. Growth Des., 2009, 9, 1436–1443 Search PubMed.
- P. T. A. Galek, L. Fabian, W. D. S. Motherwell, F. H. Allen and N. Feeder, Acta Crystallogr., Sect. B: Struct. Sci., 2007, 63, 768–782 CrossRef CAS PubMed.
- C. R. Groom, I. J. Bruno, M. P. Lightfoot and S. C. Ward, Acta Crystallogr., Sect. B: Struct. Sci., Cryst. Eng. Mater., 2016, 72, 171–179 CrossRef CAS PubMed.
- P. A. Wood, N. Feeder, M. Furlow, P. T. A. Galek, C. R. Groom and E. Pidcock, CrystEngComm, 2014, 16, 5839–5848 RSC.
- J. G. P. Wicker and R. I. Cooper, CrystEngComm, 2015, 17, 1927–1934 RSC.
- R. K. Gamidi and Å. C. Rasmuson, Cryst. Growth Des., 2017, 17, 175–182 CAS.
- Version Q1 2016, http://www.rdkit.org.
- A. J. Cruz-Cabeza, CrystEngComm, 2012, 14, 6362–6365 RSC.
- F. Pedregosa, G. Varoquaux, A. Gramfort, V. Michel, B. Thirion, O. Grisel, M. Blondel, P. Prettenhofer, R. Weiss, V. Dubourg, J. Vanderplas, A. Passos, D. Cournapeau, M. Brucher, M. Perrot and É. Duchesnay, J. Mach. Learn. Res., 2011, 12, 2825–2830 Search PubMed.
- C.-W. Hsu, C.-C. Chang and C.-J. Lin, A practical guide to support vector classification, Technical report, Department of Computer Science, National Taiwan University, July, 2003, http://www.csie.ntu.edu.tw/~cjlin/papers/guide/guide.pdf Search PubMed.
- I. D. H. Oswald, D. R. Allan, P. A. McGregor, W. D. S. Motherwell, S. Parsons and C. R. Pulham, Acta Crystallogr., Sect. B: Struct. Sci., 2002, 58, 1057–1066 Search PubMed.
- S. L. Childs, G. P. Stahly and A. Park, Mol. Pharmaceutics, 2007, 4, 323–338 CrossRef CAS PubMed.
- V. K. Srirambhatla, A. Kraft, S. Watt and A. V. Powell, Cryst. Growth Des., 2012, 12, 4870–4879 CAS.
- J. A. Hanley and B. J. McNeil, Radiology, 1982, 143, 29–36 CrossRef CAS PubMed.
- A. P. Bradley, Pattern Recognit., 1997, 30, 1145–1159 CrossRef.
Footnotes |
| † Electronic supplementary information (ESI) available: input and output data files for Python script, data matrix of results and analytical data for one successful co-crystal. CCDC 1538729–1538741. For ESI and crystallographic data in CIF or other electronic format see DOI: 10.1039/c7ce00587c |
| ‡ The CCDC numbers for the 13 crystals that were successfully structurally characterised are: 1538729 (nicotinamide and 4-nitrobenzoic acid), 1538730 (nicotinamide and 4-fluorobenzoic acid), 1538731 (isonicotinamide and 3-methyoxybenzoic acid), 1538732 (urea and 3-nitrobenzoic acid), 1538733 (isonicotinamide and 2-aminobenzoic acid), 1538734 (benzamide and 3-fluorobenzoic acid), 1538735 (nicotinamide and 2-nitrobenzoic acid), 1538736 (nicotinamide and 3-methylbenzoic acid), 1538737 (4,4′-bipyridyl and 2-fluorobenzoic acid), 1538738 (benzamide and 2-nitrobenzoic acid), 1538739 (urea and 2-nitrobenzoic acid), 1538740 (nicotinamide and 2-aminobenzoic acid) and 1538741 (isonicotinamide and 2-nitrobenzoic acid). Crystal data for 1538729: C13H11N3O5, Mr = 289.25, triclinic, P Crystal data for 1538730: C13H11FN2O3, Mr = 262.24, monoclinic, P21/c, a = 13.629(16) Å, b = 7.151(8) Å, c = 13.651(15) Å, β = 115.649(17)°, V = 1199.0(2) Å3, Z = 4, T = 296(2) K, 6819 reflections collected, 2463 unique (Rint = 0.0286), final GooF = 1.029, R1 = 0.0392 [1764 obs. data: I > 2σ(I)], wR2 = 0.1135 (all data). Crystal data for 1538731: C22H22N2O7, Mr = 426.41, triclinic, P Crystal data for 1538732: C8H9N3O5, Mr = 227.18, monoclinic, P21/c, a = 8.084(4) Å, b = 12.756(6) Å, c = 9.490(4) Å, β = 93.543(12)°, V = 976.7(8) Å3, Z = 4, T = 296(2) K, 7065 reflections collected, 1904 unique (Rint = 0.0580), final GooF = 0.997, R1 = 0.0712 [1134 obs. data: I > 2σ(I)], wR2 = 0.2452 (all data). Crystal data for 1538733: C13H13N3O3, Mr = 259.26, monoclinic, P21/c, a = 12.516(5) Å, b = 10.899(4) Å, c = 9.306(3) Å, β = 95.296(12)°, V = 1264.0(8) Å3, Z = 4, T = 300(2) K, 19310 reflections collected, 2225 unique (Rint = 0.1923), final GooF = 1.015, R1 = 0.0853 [1007 obs. data: I > 2σ(I)], wR2 = 0.2536 (all data). Crystal data for 1538734: C14H12FNO3, Mr = 261.25, triclinic, P Crystal data for 1538735: C20H16N4O9, Mr = 456.37, monoclinic, C2/c, a = 27.715(3) Å, b = 7.0371(7) Å, c = 21.947(2) Å, β = 105.132(4)°, V = 4132.0(7) Å3, Z = 8, T = 300(2) K, 22442 reflections collected, 3633 unique (Rint = 0.0431), final GooF = 1.019, R1 = 0.0401 [2875 obs. data: I > 2σ(I)], wR2 = 0.1092 (all data). Crystal data for 1538736: C22H22N2O5, Mr = 394.41, monoclinic, P21/n, a = 10.878(3) Å, b = 12.704(4) Å, c = 15.328(5) Å, β = 107.034(9)°, V = 2025.3(11) Å3, Z = 4, T = 300(2) K, 37173 reflections collected, 3550 unique (Rint = 0.1220), final GooF = 1.036, R1 = 0.0672 [1651 obs. data: I > 2σ(I)], wR2 = 0.2008 (all data). Crystal data for 1538737: C17H13FN2O2, Mr = 296.29, monoclinic, P21/n, a = 11.012(2) Å, b = 4.0528(8) Å, c = 32.335(6) Å, β = 94.648(4)°, V = 1438.3(5) Å3, Z = 4, T = 296(2) K, 21090 reflections collected, 2944 unique (Rint = 0.0370), final GooF = 1.044, R1 = 0.0589 [2002 obs. data: I > 2σ(I)], wR2 = 0.2075 (all data). Crystal data for 1538738: C21H17N3O9, Mr = 455.38, triclinic, P Crystal data for 1538739: C15H14N4O9, Mr = 394.30, monoclinic, P21/n, a = 11.8242(18) Å, b = 10.0350(15) Å, c = 15.060(2) Å, β = 104.953(2)°, V = 1726.4(4) Å3, Z = 4, T = 296(2) K, 22669 reflections collected, 3077 unique (Rint = 0.0288), final GooF = 1.038, R1 = 0.0366 [2530 obs. data: I > 2σ(I)], wR2 = 0.1012 (all data). Crystal data for 1538740: C13H11N3O3, Mr = 259.26, monoclinic, P21, a = 10.479(2) Å, b = 4.9873(9) Å, c = 12.644(3) Å, β = 109.361(5)°, V = 623.4(2) Å3, Z = 2, T = 296(2) K, 9087 reflections collected, 2364 unique (Rint = 0.0278), final GooF = 1.040, R1 = 0.0305 [2141 obs. data: I > 2σ(I)], wR2 = 0.0746 (all data). Refined as a 2-component inversion twin. Crystal data for 1538741: C26H22N6O10, Mr = 578.49, monoclinic, P21/c, a = 8.873(2) Å, b = 34.245(8) Å, c = 9.175(2) Å, β = 105.942(8)°, V = 2680.7(11) Å3, Z = 4, T = 300(2) K, 29445 reflections collected, 4734 unique (Rint = 0.0540), final GooF = 1.046, R1 = 0.0469 [3588 obs. data: I > 2σ(I)], wR2 = 0.1394 (all data). |
| This journal is © The Royal Society of Chemistry 2017 |


![[1 with combining macron]](https://www.rsc.org/images/entities/char_0031_0304.gif) ,
,