 Open Access Article
Creative Commons Attribution 3.0 Unported Licence
Composition inversion to form calcium carbonate mixtures†
Eddie
Peh
 *a,
Clemens
Liedel
 a,
Andreas
Taubert
b and
Klaus
Tauer
*a
aMax Planck Institute of Colloids and Interfaces, D-14424 Potsdam, Germany. E-mail: Eddie.Peh@mpikg.mpg.de; Klaus.Tauer@mpikg.mpg.de
bInstitute of Chemistry, The University of Potsdam, D-14476 Potsdam-Golm, Germany
First published on 2nd May 2017
Abstract
Composition inversion takes place in equimolar solid mixtures of sodium or ammonium carbonate and calcium chloride with respect to the combination of anions and cations leading to the corresponding chloride and calcite in complete conversion. The transformation takes place spontaneously under a variety of different situations, even in a powdery mixture resting under ambient conditions. Powder X-ray diffraction data and scanning electron microscopy micrographs are presented to describe the course of the reaction and to characterize the reaction products. The incomplete reaction in the interspace between two compressed tablets of pure starting materials leads to an electric potential due to the presence of uncompensated charges.
1. Introduction
The state of the art of formation of minerals encompasses the combination of nucleation and growth processes from initially homogeneous conditions (solution or melt), ending however in a heterogeneous state as a suspension in either a liquid or solid continuous phase. The experimental conditions during this kind of reaction crystallization of minerals are controlled in a way that the desired product precipitates from the reaction mixture and unwanted by-products are left behind in the mother liquor.1 This holds not only for industrial crystallization but also for the many biogenic and non-biogenic mineralization processes.Calcium carbonate (CC) is the core of probably the most important biogeochemical cycle on earth2,3 and it is abundant in living and dead matter. In living nature, extremely efficient ways are present to develop calcium carbonate-containing structures with superior functionalities, for example the mechanical properties of nacre.4–7 In our modern life, we use calcium carbonate as an additive in personal care products and cosmetics, and as a filler in a variety of polymer–mineral composites.8,9 However, dissolved calcium is also the main source of water hardness and scale formation.10,11 The formation of such deposits leads to reductions in the efficiency, increases in energy costs, and even damage to industrial plants. All these facts are the reasons for the enormous number of publications dealing with the properties and crystallization of calcium carbonate. A SciFinder search of the topic ‘calcium carbonate’ leads to almost 200![[thin space (1/6-em)]](https://www.rsc.org/images/entities/char_2009.gif) 000 hits indeed, a gigantic amount of knowledge but impossible to completely overlook in detail. Fortunately, the calcium carbonate system has been well documented in several comprehensive works.12–17
000 hits indeed, a gigantic amount of knowledge but impossible to completely overlook in detail. Fortunately, the calcium carbonate system has been well documented in several comprehensive works.12–17
Any chemical transformation goes in the direction of minimizing free energy which means the evolution of the system toward the composition possessing the lower chemical potential of all components on either side. The reaction stops when the difference in the chemical potential ceases to exist. Considering isothermal conditions, differences in the chemical potentials initiate diffusion of matter over a certain spatial distance.18 For nucleation and growth processes, the interaction of solutes with interfaces plays a crucial role as nucleation sites and after that for crystal growth and formation of crystal habits. This is mainly due to the minimization of the free energy for both processes.1,19 However, for solid-state reactions (SSR), that is, the initial components are present as solids (either crystalline or amorphous), the situation is different because a chemical transformation is possible only at the phase boundaries, more precisely, at the direct contact spots between the grains of the different starting materials. In general, SSR are less common in mineralization chemistry, with the important exception in the production of metal alloys, ceramics, bricks, pottery, cement, and glasses. Frequently, SSR require high temperatures in order to accelerate diffusion of the reactants.20–23
Reactions in powdery blends came to the fore in chemistry in the 19th century and it is among the merits of van't Hoff to establish the foundations of reaction kinetics in such systems. He concluded ‘the incompatibility of condensed systems’ which means that ‘at equilibrium’ only one of the systems (either the reactants or the products) can be present. This holds for systems in which reactants and products do not mix.24–27 Here, we consider a particular type of SSR for which the name double decomposition or double transformation was coined,25,28 as illustrated by reaction (1) where C1, C2 and A1, A2 are two chemically different cations and anions, respectively. This reaction describes what we consider as composition inversion.
| C1A1 + C2A2 → C1A2 + C2A1 | (1) |
Interestingly among those many activities in the field of CC mineralization and minerals, there is, to the best of our knowledge, not a single work describing the synthesis of CC via SSR. Here, we report the results of an initial study concerning the reaction between sodium carbonate and calcium chloride solids under ambient conditions. The approach is very simple but versatile regarding the technical configuration. The transformation starts shortly after establishing contact between the reactant grains and proceeds to complete conversion.
There is another feature of SSR which is worthy to be mentioned specifically in comparison with mineralization reactions via nucleation and growth. SSR do not require the generation of supersaturation to control, at least in a certain way, the difference in the chemical potential between reactants and products and in this way crystal nucleation and growth rates. On the contrary, in SSR it is the difference in the molar chemical potentials (i.e. the difference in a given intensive materials' property comparable with density, molar heat, or similar properties) that essentially determines the process.
Compared to solution-based processes of calcium carbonate mineralization, solid-state synthesis leads to a product mixture which might be a drawback with respect to product purity but offers additional possibilities for designing composite materials with specific morphologies and properties.
2. Experimental information
2.1 Materials
Anhydrous 96% calcium chloride (CaCl2, Acros), anhydrous sodium carbonate (Na2CO3, Fluka), ammonium carbonate ((NH4)2CO3, Sigma-Aldrich) and sodium chloride >99.8% (NaCl, Carl Roth) were used as-received. Water was taken from a Seral purification system (PURELAB Plus) with a conductivity of 0.055 μS cm−1. For the XRD reference pattern of calcite, powder was obtained by scraping the inner shell of a common Pinctada mollusc.2.2 SSR reaction conditions
Equimolar ratios of Na2CO3 (500 mg) and CaCl2 (525 mg) or (NH4)2CO3 (500 mg) and CaCl2 (577 mg) were freshly prepared in a 15 mL glass vial under ambient conditions. Note that this is the theoretical stoichiometric ratio which very likely is not the real one because both salts are hygroscopic and easily take up water under ambient conditions (cf. Table SI-3†). The mixture was then hand-shaken for several minutes to ensure sufficient mixing of the two powders. The initial mixture was then subjected to various treatments. Subsequently, the mixtures were kept under the various conditions listed below, allowing the SSR to take place. Reactions with Na2CO3 and (NH4)2CO3 are labelled ‘SC’ and ‘AC’, respectively, in addition to a number characterizing the particular procedure.2.3 Characterization
X-ray diffraction (XRD) was measured on a Bruker D8-Advance X-ray powder diffractometer using Cu Kα radiation (λ = 1.5406 Å) and a scintillation counter (KeveX detector). To reduce exposure to humidity, samples were placed on a Si low-background holder (Bruker) and screw-covered with a PMMA dome. Measurements were then made with scattering angles (2θ) from 5–70° with a step size and scan time of 0.005° and 0.5 s, respectively. Raw data were treated by performing background subtraction, removing Cu Kα radiation and smoothening using Match! (Version 3.3.0 Build 88). The data are presented in a way that the 2θ value of the peak maximum (x-axis) is plotted against the normalized intensity (y-axis). Differential scanning calorimetry (DSC) measurements were made using a DSC 204 “Phoenix”/TASC 414/4 controller (heat flow, endotherm up) from Netzsch (Selb, Germany). Heating/cooling rates were kept at 10 K min−1. The thermal cycle for the DSC measurements involved the following steps: 1) cooling from room temperature to 0 °C, 2) heating from 0 to 600 °C, 3) cooling from 600 to 0 °C, 4) heating from 0 to 600 °C and 5) cooling back to room temperature. At each target temperature, there was a resting time of 5 min. Scanning electron microscopy (SEM) was performed according to standard procedures with a high-resolution scanning electron microscope operating at an accelerating voltage of 3 kV (LEO1550 Gemini, Carl Zeiss AG, Germany). Measurements of the open circuit potential (OCP) between the individual tablets of reactants pressed together were carried out using a BioLogic MPG2 potentiostat in a standard two-electrode setup. After reaching a constant value of the OCP, the sample was discharged by applying a constant current of 10 nA until no potential difference between the electrodes was observed. Consecutively, the system was allowed to equilibrate with no applied current while measuring the OCP and this sequence of discharging and equilibrating was repeated multiple times.3. Results and discussion
3.1 Thermodynamic considerations
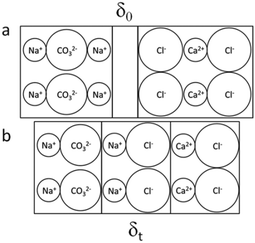
Surface atoms or molecules possess excess energy compared to their counterparts in the bulk due to the chemically different partners they are interacting with. As a result, bringing any two phases into contact creates an interface between them with very special properties. The contact areas are neither molecularly sharp nor constant over time and might be illustrated as shown in Fig. 1. Such a situation has been observed for solid–solid and liquid–liquid combinations.26,31,32 Interface species in contact with other materials are invasive. They use defects to conquer the foreign space. This process is thermodynamically supported and facilitated by entropic forces. Thermodynamics defines the driving power, ΔG (or for short the drive), of a considered chemical transformation as the difference of the sums of the chemical potentials on the product (∑iμp) and the reactant sides (∑iμr): ΔG = ∑iμp − ∑iμr. ΔG < 0 means that the reaction spontaneously develops in the chosen direction from reactants to products.25 In the present study, the two partners in contact are ionic minerals (Fig. 2) and the available thermodynamic data suggest the spontaneous transformation via direct exchange of cations and anions only for the combination Na2CO3/CaCl2 but not for (NH4)2CO3/CaCl2 (cf. Table SI-1†).29,30,33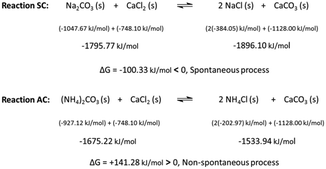 | ||
| Fig. 2 The SSRs under investigation: (SC) solid sodium carbonate and (AC) solid ammonium carbonate with solid calcium chloride; chemical potentials of the reactants and products are given in the middle line; comparing the sum of the chemical potentials on either side proves that the transformation to solid sodium chloride and solid calcium carbonate is thermodynamically possible, whereas the reaction between ammonium carbonate and calcium chloride to solid ammonium chloride and solid calcium carbonate is not likely; the values of the chemical potentials for the individual solids are from ref. 29 except that for ammonium carbonate which was taken from ref. 30. | ||
3.2 Experimental results
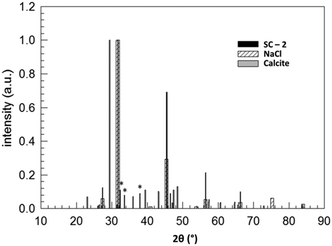
Fig. 3 compares the XRD patterns of a stoichiometric mixture of sodium carbonate and calcium chloride immediately after mixing and after keeping the solid mixture in a vacuum oven at 80 °C for 51![[thin space (1/6-em)]](https://www.rsc.org/images/entities/char_2009.gif) 080 minutes. These data prove the (almost) complete conversion of the starting products within this period of time (about 35.5 days). Fig. 4 shows the assignment of the peaks in the reaction product by comparing the XRD pattern with those of the supposed products NaCl (halite) and CaCO3 (calcite), each measured separately. Despite being not a 100% perfect match, the comparison evidences that the reaction SC as given in Fig. 2 took place. Clearly, the reaction product is composed of halite and calcite. Unmatched signals at 2θ = 32.36, 33.60, and 37.96°, marked with an asterisk in Fig. 4 and all with an intensity lower than 10% with respect to the most intense (200) peak of halite at 2θ = 31.755°, likely point to sodium carbonate residuals due to a non-perfect stoichiometry of the starting mixture.
080 minutes. These data prove the (almost) complete conversion of the starting products within this period of time (about 35.5 days). Fig. 4 shows the assignment of the peaks in the reaction product by comparing the XRD pattern with those of the supposed products NaCl (halite) and CaCO3 (calcite), each measured separately. Despite being not a 100% perfect match, the comparison evidences that the reaction SC as given in Fig. 2 took place. Clearly, the reaction product is composed of halite and calcite. Unmatched signals at 2θ = 32.36, 33.60, and 37.96°, marked with an asterisk in Fig. 4 and all with an intensity lower than 10% with respect to the most intense (200) peak of halite at 2θ = 31.755°, likely point to sodium carbonate residuals due to a non-perfect stoichiometry of the starting mixture.
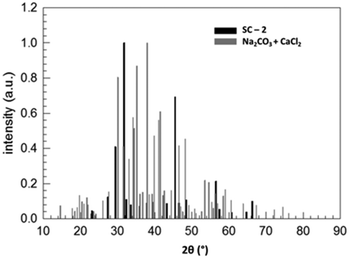 | ||
Fig. 3 Normalized XRD patterns of a stoichiometric Na2CO3/CaCl2 mixture (reactants) and of the product after 51![[thin space (1/6-em)]](https://www.rsc.org/images/entities/char_2009.gif) 080 minutes in a vacuum oven at 80 °C (SC-2). 080 minutes in a vacuum oven at 80 °C (SC-2). | ||
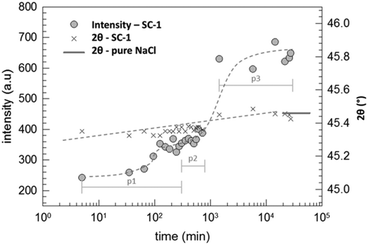
The duration of 35.5 days was chosen in order to provide enough time for the supposedly very slow reaction in order to reach high conversion. In order to check the kinetics, we performed consecutive XRD measurements of a reactant mixture made with a mortar and pestle (SC-1) which was subsequently placed in an airtight sample holder. In order to increase the time resolution of the measurements, we did not observe the whole range of 2θ but restricted the measured interval to 44–47°. This interval was chosen because halite exclusively shows a reflection in that range and, moreover, the data compiled in Fig. 4 show that the intensity of signals belonging to calcite in the sample is much lower than that for halite. These measurements were consecutively conducted for 12 hours. After the initial periods (p1 and p2), the sample was kept inside the sample holder for repeated measurements up to 19 days (p3). The maximum intensity within this interval of 2θ is plotted in Fig. 5 together with the corresponding value of 2θ. Surprisingly, the intensity begins to increase already after 10 minutes of contact and hence the reaction starts very quickly. After about only one day (1440 minutes), the intensity of the halite peak approaches a limiting value and the 2θ value of the peak maximum reaches the value for the pure halite.‡
The data in Fig. 5 show that the intensity of the NaCl peak does not change much after only one day.§ However, a different behavior was observed for the calcite peak as illustrated in Fig. 6.
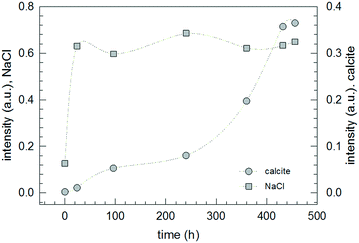 | ||
| Fig. 6 Change of the normalized intensity of the halite (220) peak at 2θ = 45.399 ± 0.14° and of the calcite (104) peak at 2θ = 29.362 ± 0.02° for SC-1 monitored over a period of 19 days. | ||
According to the stoichiometry of the conversion (cf.Fig. 2), the formation of two moles of NaCl requires the formation of one mole of CaCO3. However, the experimental data show that the appearance of scattering peaks belonging to calcite happens with a significant delay and is not even finished after nineteen days. Considering the stoichiometry of the reaction, the postponement of the occurrence of scattering peaks belonging to calcite is a clear indication that the formation of crystalline halite is accompanied not by the simultaneous formation of calcite but amorphous calcium carbonate (ACC) which slowly transforms later to calcite. This is a reasonable conclusion and in line with previously published results for calcium carbonate nucleation from Na2CO3 and CaCl2 solutions which revealed the formation of ACC as precursor particles before the appearance of crystalline polymorphs by time-resolved SAXS studies.34,35 Obviously, the other reaction product halite is directly formed in its crystalline state. This result is in accordance with the fact that the production of amorphous sodium chloride powder needs very special conditions and has so far been observed after water evaporation from nanometer-sized droplets.36,37
XRD measurements of all reaction products obtained under the various conditions listed in the experimental part confirm the completeness of the reaction and composition of the reaction product to be a halite–calcite mixture (cf. XRD data given in the ESI,† Fig. SI-1). The conversion of the starting mixture is almost complete within the limits set by the non-stoichiometric composition of the reactant mixture under ambient conditions (cf. discussion above).
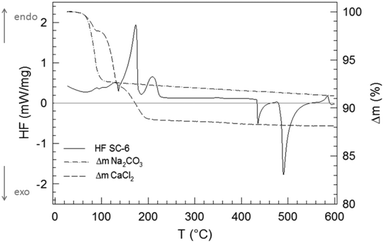
Taking a closer look at the temperature dependence of this SSR by DSC allows one to follow online the dependence of the transformations on time and temperature at a given heating rate during a predetermined range of temperatures. Fig. 7 shows the corresponding TGA and DSC curves for SC-6. The reproducibility of the reaction is good, with data shown in the ESI† (Fig. SI-2).
The endothermic peaks up to about 220 °C are due to desorption of bound water, and this temperature range corresponds with the initial mass loss of the reactants. Interestingly, desorption of the bound water in ACC has been observed to happen in the same temperature range up to >200 °C.38,39 The reaction SC initiates at about 420 °C and proceeds exothermally until 550 °C. Interestingly, there are two distinct peaks, one with lower heat development at 435 °C and another with higher heat development at 490 °C. Expectedly, during the second heating, neither the endothermic nor the exothermic peaks appear again (cf. Fig. SI-2†). Regarding the interpretation of the two exothermic peaks, it appears reasonable to assume that the first peak is due to the formation of ACC. In fact, a dehydrated ACC phase has been previously reported.40 The second peak is then due to the transformation of ACC to calcite, because the crystallization of ACC has also been observed to be exothermic.38,39 The HF–time curve shows that the main portion of the reaction SSR-SC including the crystallization (i.e., the formation of ACC and its transformation to calcite) takes place within 110 K and lasts only 11 minutes.
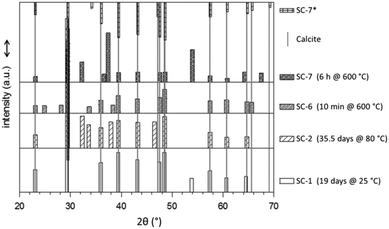
Expectedly, increasing the temperature causes acceleration of the conversion. We carried out SSR-SC at four different temperatures (room temperature, 80 °C, 430–540 °C, and 600 °C). In each case, the final crystalline product is calcite which is the thermodynamically stable polymorph of calcium carbonate.41–43 However, the data compiled in Fig. 8 reveal that with increasing reaction temperature the number of alien peaks, i.e. which do not belong to calcite, increases. In general, the data in Fig. 8 confirm that SC leads to calcite as the calcium carbonate polymorph. Almost all alien signals can be reasonably assigned (cf. Table SI-2†). For SC-1 and SC-2, these peaks stem from sodium carbonate (including probably some sodium bicarbonate). In sample SC-6, only two of the four peaks, at 2θ = 33.70 and 38.35°, can be assigned to Na2CO3. The other two signals cannot be properly assigned. Possibly, they originate from the side product with aluminium from the crucible. For sample SC-7 which was tempered for 6 hours at 600 °C, the four alien peaks can be assigned to CaO. Its difference from SC-6 is caused by the drastic alteration in the temper time. The one additional peak in SC-7* (after washing with water) may belong to Ca(OH)2 which has poor solubility in water. Accordingly, during the treatment in the furnace after the formation of CaCO3 and during washing, a reaction sequence as given in eqn (2) takes place.
| CaCO3 → CaO and CaO + H2O → Ca(OH)2 | (2) |
A possible reason that certain signals are missing, cf. the signal of the (0012) plane at 2θ = 65.6° for calcite in a particular sample (cf. SC-1, SC-2, SC-7), could be the fact that the powdery samples were not rotated during the measurements.
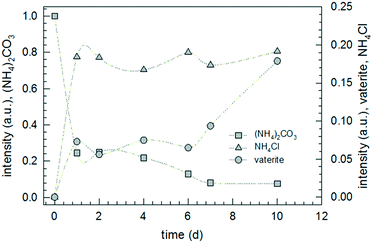
According to the thermodynamic data given in Fig. 2, replacing sodium carbonate with ammonium carbonate should prevent the reaction if formulated as simple double ion exchange. However, the experimental data given in Fig. 9 prove the opposite; the reaction takes place, indeed. As in the case of SC, the XRD pattern of the product of AC differs completely from that of the starting mixture. However, the XRD pattern of the product of AC does not fit to calcite but to another calcium carbonate polymorph, surprisingly vaterite. This finding is rather astonishing because it is known that, under identical precipitation conditions via the solution reaction, vaterite is obtained only at higher reaction temperatures and much shorter reaction times: 30 versus 10 °C and 15 minutes versus 48 hours for vaterite and calcite, respectively.44–46 In addition, the increase in pH due to evolution of ammonia gas from ammonium carbonate may affect the ratio of vaterite to calcite formed.47 Knowing that vaterite is not the thermodynamically most stable polymorph, we re-measured the reaction product and noticed that after about one year the transition from vaterite to calcite, the most stable calcium carbonate polymorph, took place almost to completeness (cf.Fig. 10). Just as in the case of SC, the reaction between ammonium carbonate and calcium chloride proceeds also in a similar way, meaning that initially crystalline ammonium chloride and ACC are formed as proven by the time-dependent results plotted in Fig. 11. The formation of vaterite takes place delayed, but it is not the final state.
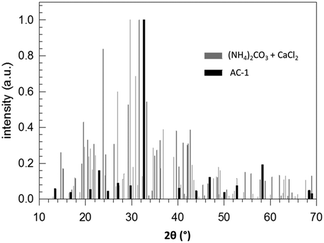 | ||
| Fig. 9 Normalized XRD patterns of a stoichiometric (NH4)2CO3/CaCl2 mixture (reactants) and of the product after 240 h stored at room temperature (AC-1). | ||
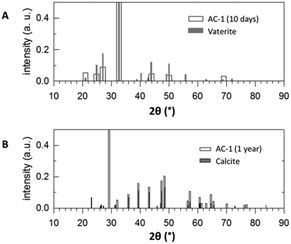 | ||
| Fig. 10 XRD patterns A) of AC-1 after ten days reaction time compared with vaterite and B) of AC-1 after maturation for one year compared with calcite. | ||
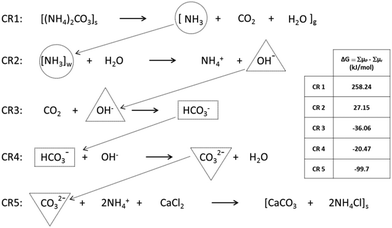
The experimental data reveal a peculiarity of the solid-state reactions between sodium carbonate or ammonium carbonate and calcium chloride. These reactions are characterized by two and three stages until the final, thermodynamically stable state is reached. The first stage in both reactions (SC and AC), the double exchange of the ions leading to sodium or ammonium chloride and ACC, is the fastest. In the case of sodium carbonate in the reactant mixture (SC), apparently, ACC directly transforms into calcite since vaterite signals have not been detected. However, for ammonium carbonate as the reactant, ACC transforms only via the intermediate vaterite into the stable crystalline polymorph, calcite. Remarkably enough, all these transitions take place in solid powders with average grain sizes of a few hundreds of micrometers almost to completeness, thus proving that powdery mixtures even under ambient conditions are quite reactive. In addition, the fact that this kind of SSR happens proves the strength of the chemical potential. However, AC should not happen (cf.Fig. 2) and, hence, it is necessary to seek for an explanation within the frame of thermodynamics. The most straightforward explanation is that this reaction is not as simple as indicated by the double ion exchange. Probably, a clue to solve the riddle can be found in the peculiar behavior of ammonium carbonate which readily degrades in the solid state according to eqn (CR1) shown in Fig. 12.48,49 Interestingly, eqn (CR1) is, with respect to the chemical potentials, not feasible as well (Table SI-1†).
The decomposition of ammonium carbonate might be the game changer, assuming that the products of reaction (CR1) do not exist as such but form intermediates and take part in consecutive, chemically coupled reactions.50 Note that CR1 and CR2 are thermodynamically unfavourable as for both reactions, ΔG > 0. However, for these reactions, the influence of the product concentrations has to be considered. CR1 releases the product gases into the atmosphere above the sample where they, at a distance from the surface, will be diluted to a certain extent. Dilution reduces the chemical potential on the product side so that initially CR1 can take place. Now, the water in the product gas mixture is absorbed by the hydrophilic reactants. Both solids (ammonium carbonate and calcium chloride) are hygroscopic and able to bind a significant amount of water (cf. Table SI-3†). This absorbed water is surely not isotropically distributed inside the solids but accumulates in areas, due to its high tendency to form H-bridges. Now, CR2–CR5 are assumed to take place under wet conditions, i.e. inside the water pockets. Consecutive reactions as given in Fig. 12 mutually require that they either occur simultaneously or not at all.50
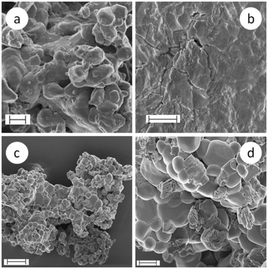
During SC and AC reactions at room temperature, the appearance of the reaction mixture does not visually change as it remains a whitish powdery mixture before and after the transformation. However, scanning electron microscopy (SEM) reveals versatile morphologies depending on the different reaction conditions (cf.Fig. 13–15). More SEM micrographs are collected in Fig. SI-3.† In general, the SEM micrographs of sodium carbonate and calcium chloride powder show rather compact structures and do not clearly display the morphology of the particles (Fig. 13a and b). The surface of CaCl2 appears quite flat, whereas that of Na2CO3 shows roundish protrusions. However, the particles in the reaction product clearly possess a different habit. The SEM micrographs show, for all products made at temperatures below 100 °C (Fig. 13b and c and 14a–c), particles with two different morphologies independent of whether or not the reaction mass was actively mixed. One sort of particle appears roundish without showing sharp edges but a few of these particles are cubically shaped, however, with rounded edges and corners. The other sort of particle looks crystal-like with sharp edges and possesses a plate-like shape. The platelets frequently stack together and pile up. EDX investigations clearly revealed mainly sodium and chlorine (NaCl) in the spherical particles and calcium and oxygen (CaCO3) in the other type (cf. Fig. SI-4†).
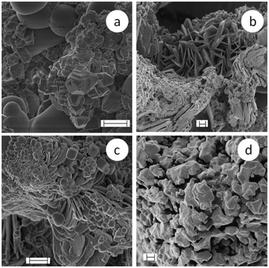
The SEM micrographs of SC-7 show that essentially all the particles of the reaction product possess a similar habit. Neither the roundish particles nor the platelets are recognizable any longer but only particles of similar shape, having rather irregular shapes with quite a lot of edges (Fig. 14d). Obviously, higher temperatures of up to 600 °C during SSR cause the formation of a kind of composite particle in which both components are tightly sintered together. In contrast to the product as-obtained after the reaction SC-7 (Fig. 14d), the SEM micrographs of the product after washing with water (Fig. 15) show a wide variety of different morphologies. Overall, these results prove that there is obviously not a clear correlation between the crystal habit and the type of polymorph even in the absence of any additional components.
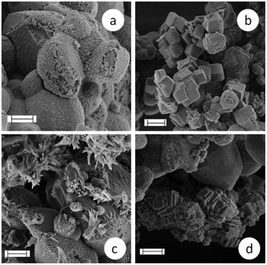 | ||
| Fig. 15 SEM micrographs of the reaction products of SC-7 (made in a ceramic crucible at 600 °C) after washing with water; the XRD pattern (cf. Fig. SI-1†) shows only signals belonging to calcite (or to secondary reaction products, cf.eqn (2)) in the product after washing with water; scale bars indicate 1 μm for a–c and 2 μm for micrograph d. | ||
Interestingly, all these crystal habits, here obtained after SSR for calcite, are known for calcium carbonate, but also for various polymorphs of precipitation products from solutions of the same starting materials (Na2CO3 and CaCl2).46,51 Exemplarily, by starting from equimolar sodium carbonate and calcium chloride aqueous solutions (0.2 M each) with no other ingredients and mixing both under controlled temperature and pH conditions, the kind of polymorph of the precipitation reaction is determined by the temperature, stirring rate, and overall duration of the reaction. Vaterite with a spherical habit is obtained at 30 °C and 500 rpm after 15 min, needle-like aragonite at 80 °C and 1500 rpm after 15 minutes, and calcite cubes at 10 °C and 600 rpm after 48 hours.46 How the slightest changes of the experimental conditions influence the outcome of the calcium carbonate reaction illustrates the following examples. Calcite spherulites have been obtained instead of cubes by reducing the temperature to 5 °C and the stirring rate to 300 rpm. Replacing sodium carbonate with lithium carbonate and increasing the temperature to 45 °C and the duration to 64 hours lead to calcite platelets.45 The SEM micrographs of AC-1 show three morphologically different objects: plates, rods and quite small spheres with a diameter of about 100 nm (cf. Fig. SI-3†).
All results shown up to here are formed when mixing reactants as powder in an equimolar ratio and applying different post-treatments with respect to solid–solid mixing, pressure, and temperature. Now, thinking about bringing into contact tablets made of the pure components individually (Na2CO3 and CaCl2) leads to an interesting conclusion as sketched in Fig. 16. In the tablets, produced under a load of ten tons, the mobility of the ions is greatly reduced, compared to that in the powders. Consequently, the rate of the ion exchange in order to achieve the thermodynamically favored state is significantly reduced and, hence, the product is generated only in an interfacial layer.
Following this probably grossly oversimplified sketch, the conclusion can be drawn that between both tablets an electric potential might be built up with increasing contact time. In order to test this hypothesis, we designed a very simple setup (Fig. 17). The measurement of electrical properties of salts is not that easy and requires special measures. The crucial point with the simple setup used in this study is to generate an intense enough contact, on the one hand, between both tablets and, on the other hand, between the electrodes and the other sides of the tablets. Tammann, in an early study of single component salt crystals (both single crystals and crystalline powders), already recognized this issue and, in order to ensure optimum contact between the sample and the electrode, he heated the system before the measurement up to 30° below the melting point of the salt and applied pressure during the measurements (5 kg cm−2).52 For both salts used in our study, the mechanical stability of the tablets is the main issue, because tablets made even under a load of 10 tons per 1.33 cm2 (7.38 × 10⁸ N m−2) are very brittle and may break easily while assembling the setup. Despite these technical problems, the very simple setup (Fig. 17a) allowed the proof of principle, i.e. the measurement of an electric potential after a maturation time of 5 days (Fig. 17b).
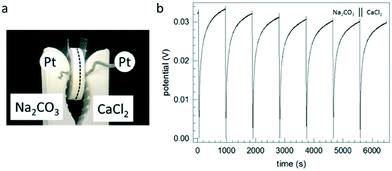 | ||
| Fig. 17 (a) Setup used allowing the development of an interfacial layer between sodium carbonate and calcium chloride tablets with platinum electrodes (Pt) attached to the opposite sides, the assembly is held together by a clamp and the dashed line marks the interface; (b) repeated build-up of the open circuit potential after discharging by applying a constant current, hence proving the existence of opposite residual charges on both tablets as sketched in Fig. 16. | ||
Immediately after bringing both tablets into contact, the assembly shows the behavior of an insulator without a measurable potential between the electrodes. After a few days, the potential between both tablets reaches measurable values. After measuring the potential between both tablets, we periodically allowed the charges to equilibrate by applying a constant current (seen as fast changes of the potential from positive values to zero) and subsequent equilibration while measuring the potential difference. Even after several discharge events, the potential between both reactant tablets was recovered. However, after longer times, the hydrophilic salts have accumulated such an amount of water that the assembly destroys itself (cf. values of water uptake given in Table SI-3†). Note that the water uptake of tablets takes much longer time than that of powders.
Fig. 17 indeed indicates the formation of a scenario as sketched in Fig. 16. Now, it is straightforward to check other combinations of appropriate materials which may show the same behavior but possess better mechanical properties. Polymers are candidates for improved mechanical stability of the assembly. Suitable combinations are solid mixtures of the salts with polystyrene (trituration of a 2![[thin space (1/6-em)]](https://www.rsc.org/images/entities/char_2009.gif) :
:![[thin space (1/6-em)]](https://www.rsc.org/images/entities/char_2009.gif) 1 mixture by weight, PS–Na2CO3, PS–CaCl2) and ion-containing polymers poly(sodium styrene sulfonate) (Na-PSS) and poly(diallyl dimethyl ammonium chloride) (PDADMAC). Indeed, assemblies made of both systems develop after an incubation time of a few days a similar electrical behavior as shown in Fig. 17b for the pure salts (cf. Fig. SI-5†) and explained above but with different potentials (about 0.08 V and about 1 V for Na-PSS//PDADMAC and PS–Na2CO3//PS–CaCl2, respectively). Discharging and recovering the potential between both reactant tablets could be repeated for multiple hours or even days (cf. Fig. SI-5†). We are aware that the magnitude of the potential may also depend on the local details of the contact region (such as roughness and which crystal faces are in contact), so a clear statement which system chemically results in the highest potential difference is not feasible. Simultaneously forming ACC in variable degrees may further influence the potential. Interestingly, the assembly made of the polyelectrolytes, in which ACC cannot form, results in higher voltage. This may further confirm the model in Fig. 16 with additionally forming ACC (to a lower, non-stoichiometric extent) still resulting in a net potential between the reactant tablets.
1 mixture by weight, PS–Na2CO3, PS–CaCl2) and ion-containing polymers poly(sodium styrene sulfonate) (Na-PSS) and poly(diallyl dimethyl ammonium chloride) (PDADMAC). Indeed, assemblies made of both systems develop after an incubation time of a few days a similar electrical behavior as shown in Fig. 17b for the pure salts (cf. Fig. SI-5†) and explained above but with different potentials (about 0.08 V and about 1 V for Na-PSS//PDADMAC and PS–Na2CO3//PS–CaCl2, respectively). Discharging and recovering the potential between both reactant tablets could be repeated for multiple hours or even days (cf. Fig. SI-5†). We are aware that the magnitude of the potential may also depend on the local details of the contact region (such as roughness and which crystal faces are in contact), so a clear statement which system chemically results in the highest potential difference is not feasible. Simultaneously forming ACC in variable degrees may further influence the potential. Interestingly, the assembly made of the polyelectrolytes, in which ACC cannot form, results in higher voltage. This may further confirm the model in Fig. 16 with additionally forming ACC (to a lower, non-stoichiometric extent) still resulting in a net potential between the reactant tablets.
According to the proposed scenario (Fig. 16), the remaining charges on the interfacial side of the tablets (a positive charge for CaCl2 and a negative charge for Na2CO3) are separated by a NaCl crystal layer (and some ACC). The clear proof via XRD measurements is really difficult to obtain because the interfacial layer is rather thin and, hence, the amount of sodium chloride is quite low. Still, on the sodium carbonate tablet of the separated assembly, the (200) peak of NaCl, the signal with the highest intensity, is clearly detectable.
The device considered here (Fig. 16) is characterized by an anisotropic electric potential landscape leading to a kind of electrical double layer device with dimensions of a few micrometers or below. The formation of the potential is driven by differences in the chemical potential and supported by the generation of a thin layer of the products blocking further diffusion of reactants from both sides. Such a scenario may have certain similarities with nanoionics.53–55
4. Conclusions
The astonishing results of our study can be illustrated in the following way. Just slightly mix equimolar amounts of sodium carbonate and calcium chloride powder, let the mixture rest for days in a closed container under ambient conditions, and you will get sodium chloride and calcium carbonate. The initially formed ACC transforms over several days into crystalline calcite. This works for various conditions with respect to blending both powdery starting materials, temperature, and pressure. Even while pressurizing the intermixed powders (SC-3, 7.38 × 10⁸ N m−2), ion exchange takes place.The experimental results presented and discussed in the preceding section describe a so far not investigated route to obtain calcium carbonate via a solid-state reaction between sodium or ammonium carbonate and calcium chloride. It was found that the components of the powdery starting mixture exchange their cations and anions until complete conversion leading to the corresponding chloride (sodium or ammonium chloride) and calcium carbonate. The chloride is obtained immediately as a crystalline material which convincingly allows tracking the reaction with XRD. In contrast, amorphous calcium carbonate is initially formed and slowly transforms into calcite. If ammonium carbonate is in the initial mixture instead of sodium carbonate, the transformation of ACC to calcite takes place via vaterite as the intermediate.
The reaction happens even at room temperature in a powdery mixture prepared by simply blending both starting salts with a mortar and pestle (formulating a kind of trituration). The complete ion exchange across the interface of touching grains of both salts is an astonishing phenomenon, obviously kick-started by the higher energy of interfacial atoms and/or crystal defects and driven by the chemical potential difference. Also under forced mixing and grinding, or pressed together in the form of a tablet, and at higher temperature, the transformation to calcite takes place.
Due to the fact that the reactants and one of the products are hydrophilic, the role of ambient humidity in the reaction surely needs to be considered and investigated in more detail. The experiments carried out in this study indicate that humidity may not be of major importance because DSC proves the reaction to start above 400 °C when the bound water has desorbed. Moreover, the reaction has been proven to take place also at 80 °C in a vacuum oven under reduced pressure (1.5 mbar). In contrast, for the reaction with ammonium carbonate, a mechanism is discussed with a series of consecutive coupled reactions in which the water generated in the course of (NH4)2CO3 decomposition plays a prominent role (possibly supported by adsorbed water).
At temperatures below 100 °C, the reaction product contains separated particles of both minerals, mainly spherulitic particles of sodium chloride and calcium carbonate platelets. Carrying out the SSR at higher temperatures (between 400 and 600 °C) leads to the formation of sintered composite products possessing just a single morphology.
However, in an arrangement where two tablets of pure reactants are pressed together, the transformation is restricted to a thin interfacial region extending from both sides of the contact area. Because the reaction is incomplete on either side, an electric potential is built up due to the presence of uncompensated charges. Such a behavior has been observed also for Na-PSS with PDADMAC and two salt mixtures in polystyrene brought into contact.
In view of the lack of any literature reporting on reactions directly between solid precursors of calcium carbonate, the results presented open a new route for calcium carbonate formation. This is in large contrast to traditional wet precipitation mechanisms where bulk liquid phases are present. Therefore, this route may be applicable to biomineralization in water or liquid-free environments.
Acknowledgements
E. P. acknowledges a scholarship from the IMPRS on Multiscale Bio-Systems. Financial support of the MPI of Colloids and Interfaces is gratefully acknowledged. The authors are obliged to Mr. Chunxiang Wei, Mrs. Rona Pitschke and Mrs. Heike Runge for support with electron microscopy, to Mrs. Ingrid Zenke for support with XRD measurements, and to Mrs. Ursula Lubahn and Mrs. Sylvia Pirok for technical assistance. The authors are particularly thankful for fruitful discussions with Markus Antonietti, Marc Willinger, and Wolfgang Wagermaier from the MPI of Colloids and Interfaces. Open Access funding provided by the Max Planck Society.References
- A. Meersmann, Crystallization Technology Handbook, Marcel Dekker, Inc., New York, 1995 Search PubMed.
- A. Ridgwell and R. E. Zeebe, Earth Planet. Sci. Lett., 2005, 234, 299–315 CrossRef CAS.
- J. W. Morse, R. S. Arvidson and A. Luttge, Chem. Rev., 2007, 107, 342–381 CrossRef CAS PubMed.
- S. Weiner, I. Sagi and L. Addadi, Science, 2005, 309, 1027–1028 CrossRef CAS PubMed.
- J. S. Evans, Chem. Rev., 2008, 108, 4455–4462 CrossRef CAS PubMed.
- F. Heinemann, M. Launspach, K. Gries and M. Fritz, Biophys. Chem., 2011, 153, 126–153 CrossRef CAS PubMed.
- J. Y. Sun and B. Bhushan, RSC Adv., 2012, 2, 7617–7632 RSC.
- Calcium Carbonate, From the Cretaceous Period into the 21st Century, ed. F. W. Tegethoff, Springer Basel AG, Basel, 2001 Search PubMed.
- D. Feldman, J. Macromol. Sci., Part A: Pure Appl. Chem., 2014, 51, 659–667 CrossRef CAS.
- L. D. Swinney, J. D. Stevens and R. W. Peters, Ind. Eng. Chem. Fundam., 1982, 21, 31–36 CAS.
- S. Muryanto, A. P. Bayuseno, H. Ma'mun, M. Usamah and Jotho, Procedia Chem., 2014, 9, 69–76 CrossRef CAS.
- S. Weiner and L. Addadi, Annu. Rev. Mater. Res., 2011, 41, 21–40 CrossRef CAS.
- H. Cölfen and M. Antonietti, in Mesocrystals and Nonclassical Crystallization, John Wiley & Sons, Ltd, 2008, pp. 1–6, DOI:10.1002/9780470994603.ch1.
- F. C. Meldrum, Int. Mater. Rev., 2003, 48, 187–224 CrossRef CAS.
- N. A. J. M. Sommerdijk and G. D. With, Chem. Rev., 2008, 108, 4499–4550 CrossRef CAS PubMed.
- M. Fricke and D. Volkmer, in Biomineralization I: Crystallization and Self-Organization Process, ed. K. Naka, Springer Berlin Heidelberg, Berlin, Heidelberg, 2007, pp. 1–41, DOI:10.1007/128_063.
- M. Cusack and A. Freer, Chem. Rev., 2008, 108, 4433–4454 CrossRef CAS PubMed.
- R. Baierlein, Am. J. Phys., 2001, 69, 423–434 CrossRef CAS.
- A. Laaksonen, V. Talanquer and D. W. Oxtoby, Annu. Rev. Phys. Chem., 1995, 46, 489–524 CrossRef CAS PubMed.
- R. M. Barrer, in Diffusion in and Through Solids, Cambridge University Press, London, 1941, ch. VI, pp. 239–310 Search PubMed.
- C. B. Carter and G. M. Norton, Ceramic Materials Science and Engineering, Springer Science + Business Media New York, 2013 Search PubMed.
- R. Pampuch, An Introduction to Ceramics, Springer International Publishing Switzerland, Cham, 2014 Search PubMed.
- J. Pelleg, Diffusion in Ceramics, Springer International Publishing Switzerland, Cham, 2016 Search PubMed.
- J. H. van't Hoff, Etudes de Dynamique Chimique, Frederik Muller & Co., Amsterdam, 1884 Search PubMed.
- J. H. van't Hoff and C. M. van Deventer, Z. Phys. Chem., 1887, 1, 165–185 Search PubMed.
- G. Tammann, Z. Anorg. Allg. Chem., 1925, 149, 21–98 CrossRef CAS.
- G. Cohn, Chem. Rev., 1948, 42, 527–579 CrossRef CAS PubMed.
- G. Jander and H. Spandau, in Kurzes Lehrbuch der anorganischen und allgemeinen Chemie, Springer Verlag, Berlin, 1960, pp. 335–351 Search PubMed.
- http://chemistry-reference.com/standard%20thermodynamic%20values.pdf, 2016.
- K. Thomsen and P. Rasmussen, Chem. Eng. Sci., 1999, 54, 1787–1802 CrossRef CAS.
- W. D. Callister and D. G. Rethwisch, in Materials Scienec and Engineering, John Wiley & Sons, Inc., New York, 2000, ch. 5, pp. 92–111 Search PubMed.
- K. Tauer, S. Kozempel and G. Rother, J. Colloid Interface Sci., 2007, 312, 432–438 CrossRef CAS PubMed.
- G. Job and F. Herrmann, Eur. J. Phys., 2006, 27, 353–371 CrossRef CAS.
- J. Bolze, B. Peng, N. Dingenouts, P. Panine, T. Narayanan and M. Ballauff, Langmuir, 2002, 18, 8364–8369 CrossRef CAS.
- D. Pontoni, J. Bolze, N. Dingenouts, T. Narayanan and M. Ballauff, J. Phys. Chem. B, 2003, 107, 5123–5125 CrossRef CAS.
- E. Amstad, M. Gopinadhan, C. Holtze, C. O. Osuji, M. P. Brenner, F. Spaepen and D. A. Weitz, Science, 2015, 349, 956–960 CrossRef CAS PubMed.
- E. Amstad, F. Spaepen and D. A. Weitz, J. Phys. Chem. B, 2016, 120, 9161–9165 CrossRef CAS PubMed.
- N. Koga, Y. Z. Nakagoe and H. Tanaka, Thermochim. Acta, 1998, 318, 239–244 CrossRef CAS.
- X. Xu, J. T. Han, D. H. Kim and K. Cho, J. Phys. Chem. B, 2006, 110, 2764–2770 CrossRef CAS PubMed.
- S. Raz, P. C. Hamilton, F. H. Wilt, S. Weiner and L. Addadi, Adv. Funct. Mater., 2003, 13, 480–486 CrossRef CAS.
- G. Wolf, J. Lerchner, H. Schmidt, H. Gamsjager, E. Konigsberger and P. Schmidt, J. Therm. Anal., 1996, 46, 353–359 CrossRef CAS.
- G. Wolf, E. Konigsberger, H. G. Schmidt, L. C. Konigsberger and H. Gamsjager, J. Therm. Anal. Calorim., 2000, 60, 463–472 CrossRef CAS.
- A. V. Radha, T. Z. Forbes, C. E. Killian, P. U. P. A. Gilbert and A. Navrotsky, Proc. Natl. Acad. Sci. U. S. A., 2010, 107, 16438–16443 CrossRef CAS PubMed.
- J. P. Andreassen and M. J. Hounslow, AIChE J., 2004, 50, 2772–2782 CrossRef CAS.
- R. Beck and J. P. Andreassen, Cryst. Growth Des., 2010, 10, 2934–2947 CAS.
- M. O. Olderoy, M. L. Xie, B. L. Strand, K. I. Draget, P. Sikorski and J. P. Andreassen, Cryst. Growth Des., 2011, 11, 520–529 CAS.
- D. Gebauer and H. Cölfen, Nano Today, 2011, 6, 564–584 CrossRef CAS.
- J. E. House, Inorg. Nucl. Chem. Lett., 1980, 16, 185–187 CrossRef CAS.
- J. E. House, Thermochim. Acta, 1980, 40, 225–233 CrossRef CAS.
- G. Job and R. Rüffler, Physical Chemistry from a Different Angle, Springer International Publishing AG Switzerland, Cham, 2016 Search PubMed.
- R. Beck and J. P. Andreassen, AIChE J., 2012, 58, 107–121 CrossRef CAS.
- G. Tammann and G. Veszi, Z. Anorg. Allg. Chem., 1926, 150, 355–380 CrossRef CAS.
- A. L. Despotuli and V. I. Nikolaichik, Solid State Ionics, 1993, 60, 275–278 CrossRef CAS.
- J. Maier, Nat. Mater., 2005, 4, 805–815 CrossRef CAS PubMed.
- P. Balaya, A. J. Bhattacharyya, J. Jamnik, Y. F. Zhukovskii, E. A. Kotomin and J. Maier, J. Power Sources, 2006, 159, 171–178 CrossRef CAS.
Footnotes |
| † Electronic supplementary information (ESI) available: XRD, DSC, SEM and EDX of the SSR products, chemical potentials, water uptake measurements, and potential measurements of tablets. See DOI: 10.1039/c7ce00433h |
| ‡ Overall, the spreading of the 2θ is very low, from a minimum of 45.325° to a maximum of 45.485° and the average value is 45.380 ± 0.0469°. |
| § The relatively larger scattering of the intensity values after one day is due to the fact that in between the measurements the sample was removed from the XRD machine and had to be placed again for each subsequent measurement. This does not guarantee that the identical spot in the sample was always in the beam focus. |
| This journal is © The Royal Society of Chemistry 2017 |


