 Open Access Article
Creative Commons Attribution 3.0 Unported Licence
Neutron spectroscopy as a tool in catalytic science
Alexander J.
O'Malley
 ab,
Stewart F.
Parker
 bc and
C. Richard A.
Catlow
*abd
aCardiff Catalysis Institute, School of Chemistry, Cardiff University, CF10 3AT, UK. E-mail: CatlowR@cardiff.ac.uk
bThe UK Catalysis Hub, Research Complex at Harwell, Rutherford Appleton Laboratory, Oxfordshire, OX11 0FA, UK
cISIS Facility, STFC Rutherford Appleton Laboratory, Chilton, Didcot, Oxfordshire OX11 0QX, UK
dDepartment of Chemistry, Materials Chemistry, University College London, Third Floor, Kathleen Lonsdale Building, Gower Street, London, WC1E 6BT, UK
First published on 30th October 2017
Abstract
Catalytic science currently has access to a range of advanced experimental methods for the study of molecular behaviour in chemical processes. Neutron spectroscopy, however, is uniquely placed to gain detailed insight into such systems, particularly through techniques such as vibrational spectroscopy with neutrons (INS) which gives access to vibrational modes unavailable to conventional spectroscopy techniques, and quasielastic neutron scattering (QENS) which studies molecular motion on a range of timescales. The present article illustrates the role of these techniques in advancing the field of catalysis. We first provide a brief introduction to the basic principles of the techniques, and then discuss their use in the study of three key catalytic systems: the behaviour of hydrocarbons confined in zeolite catalysts; the methanol-to-hydrocarbons process; and methane reforming. We demonstrate the importance of neutron spectroscopy in understanding established catalytic processes, but also consider its role in the design of future catalytic systems.
1. Introduction
Catalysis is a core area of chemical sciences and as such it is not surprising that key early contributions to the development of the field were made by Michael Faraday. As discussed by John Meurig Thomas in his introductory editorial to this web collection, Faraday was the first to show that platinum surfaces can catalyse the oxidation of hydrogen; and moreover, that this catalytic reaction could be inhibited by pre-adsorption of other species – both vitally important discoveries in catalytic science.Catalysis, in addition to its huge importance for the economy and for health and the environment, poses exciting fundamental scientific challenges, particularly relating to the understanding of catalysis at the molecular level. The catalytic scientist is, however, fortunate in having a growing range of advanced experimental and computational techniques to elucidate the molecular structures and mechanisms underpinning catalytic processes. This article will highlight the role of neutron scattering in catalytic science, which as we shall show has a unique role to play in elucidating both structure and dynamics in real catalytic systems during their operation; we also show how neutron techniques can be very effectively complemented by computational modelling.
Neutron scattering has a major, and widely recognised role in structural studies of systems with light atoms, especially hydrogen, and as such neutron diffraction has long made a significant contribution to catalysis, especially in determining the positions of adsorbed hydrogen containing molecules in, for example, microporous catalysts,1,2 more recently even reaction kinetics have been probed with such techniques.3 The present article will, however focus on the less widely appreciated role of quasi- and inelastic neutron scattering. We will show how quasielastic neutron techniques (QENS) provide key information about hydrocarbon transport processes in microporous catalysts, while inelastic neutron scattering (INS) yields vibrational spectra of adsorbed species which are inaccessible to other techniques and which are vitally important in understanding mechanisms of reaction and deactivation in catalysts. Indeed, while the above techniques have gained significant insight into more established catalysts for bulk chemical production, they are now even being combined to aid the design of more novel microporous catalysts for synthesis of commodity chemicals.4,5 We will present a brief introduction to the techniques involved before demonstrating their power by examples taken from recent studies. Our focus is on heterogeneous catalysis but the techniques and approaches which we describe are applicable to all branches of the field.
2. Neutron spectroscopy techniques in catalysis
2.1 Vibrational spectroscopy with neutrons
Vibrational spectroscopy is commonly used to study catalysts.6 The types of investigation range from idealised systems, such as adsorbates on metal single crystals in ultra-high vacuum, through to working catalysts at industrial conditions of temperature and pressure. Vibrational spectroscopy with neutrons7 (inelastic neutron scattering, INS) is a form of vibrational spectroscopy that is complementary to conventional methods, e.g. infrared and Raman spectroscopies, that has particular advantages for the study of catalysts. In the course of this article, we will highlight some of these. Of course, any technique also has limitations, which will also be discussed.The differences between INS and infrared/Raman spectroscopies are clearly seen by considering the expression for the intensity of an INS mode:
 | (1) |
Eqn (1) can be considered to be comprised of four parts. The first part, [1], is the measured intensity, S(Q,ω) (also referred to as the dynamic structure factor). Note that this depends on two variables: the transition energy and the momentum transfer, Q. The latter arises because a neutron has mass (1.009 amu) and any scattering event will involve a change in momentum (since the neutron will change direction) and may also involve a change in energy, ΔE. If ΔE = 0, then the scattering is purely elastic and gives information about atomic positions, neutron diffraction being an obvious example. However, small angle neutron scattering (SANS),8 total scattering9 and neutron reflectivity10,11 exploit the same property. If ΔE ≠ 0, the scattering is inelastic which is the focus of this article. The intensity dependence on Q is the major difference between INS and infrared and Raman spectroscopies, where the modes are observed at (almost) Q = 0.
Term [2] shows that the intensity depends on the momentum transfer and the amplitude of vibration of the atoms in the normal mode. Note that it varies as 2n, this is because overtones and combinations are allowed transitions within the harmonic approximation, another difference to infrared and Raman spectroscopies.
Term [3] is a Debye–Waller factor and its magnitude is, in part, determined by the thermal motion of the system, which can be reduced by cooling the sample and so spectra are typically recorded below 30 K. For in situ or operando studies of catalysts, this factor is probably the biggest limitation of the technique; thus historically, virtually all INS catalyst studies have adopted a “react and quench” approach.12 Recent work13 has shown that in favourable circumstances this approach is not always essential and implementation of operando studies is an area of active interest.
The last term is the incoherent scattering cross section of the elements in mode ω, which is both element and isotope dependent and for normal hydrogen, 1H, it is 80.2 barns (1 barn = 1 × 10⁻²⁸ m−2) whereas for deuterium, 2H, and for virtually all other elements it is <5 barns. INS spectroscopy has no selection rules so in principle all modes are observable. However, the combination of the large cross section of 1H, and that 1H has the largest amplitude of vibration (since it is the lightest isotope), means that there is a strong “propensity” rule that the observed modes are those that involve motion of hydrogen.
Eqn (1) has consequences that are relevant for studies of catalysts. Since neutrons are scattered from atomic nuclei and the nucleus is only ∼1/1000 of the diameter of the atom, neutrons only interact weakly with matter and are consequently highly penetrating. Cell design is as a consequence relatively straightforward, in that materials such as steel, aluminium and quartz are all transparent to neutrons. In addition, the spectral cut-off commonly found for infrared spectra of supported metal catalysts (due to absorption by the support's lattice modes) is inapplicable and the entire spectral range 0–4000 cm−1 is available. The nuclear scattering also results in INS spectroscopy being relatively insensitive; sample sizes range from ∼10 g for a high surface area zeolite or supported metal catalyst, to ∼30 g for a metal powder (e.g. RANEY®Ni), with a surface area of ∼10 m−2 g−1. For new materials this limitation can be a drawback, but for industrial catalysts it is not a problem and the use of large samples means that concerns about reproducible sampling are greatly ameliorated, which is regarded by industry as a positive factor for neutron scattering studies. Finally, neutrons are “democratic”, so they “see” everything and the spectra are the sum of both the bulk and the surface. Thus INS spectra of catalysts are usually difference spectra and typically, the spectrum of the clean catalyst is used as the background.14
2.2 Quasielastic neutron scattering: molecular mobility in catalysis
We now turn to the principles behind determining the mobility characteristics of hydrogenous molecules in catalysis. Our account has been adapted from ref. 15–17. These references also give details of how to characterise localised motions of molecules such as rotation, which are outside the scope of the present article.The much larger incoherent scattering cross section of 1H hydrogen leads to much larger scattering of the hydrocarbon compared to the inorganic material of a catalyst. The scattering function obtained (S(Q, ω)) is the four dimensional Fourier transform of the self-part of the van Hove correlation function Gs(r,t) – in essence, a probability density in three-dimensional space, that a particle will be displaced by a vector r within time t at equilibrium. In the scattering function, Q and ω are the Fourier transformed variables of r and t. Small Q involves average values over long distances, and slow motions taking place over long times in Gs(r,t), will correspond to small ω. When the characteristic time of the motion is shorter than the inverse of the instrumental resolution, a broadening of the scattering function will be observed. The broadening of the scattering function must be convoluted with the instrumental resolution function in order to be quantified.
 | (2) |
 | (3) |
When considering sorbate mobility in microporous catalysts, jump diffusion models are often used. These consider a molecule which is stationary at a site (such as a channel intersection) for a defined period, which then jumps a given distance to another site. At larger momentum transfers, we observe deviations from the linearity of the DQ2 dependence as the system is not continuous at the shorter length scales probed at these larger Q values.
A model commonly used to describe such behaviour was formulated by Chudley and Elliot18 which proposes that for an average time interval τ, an atom remains on a given site vibrating about a centre of equilibrium. After this time, the atom moves rapidly to another site in a negligible jump time compared to the time spent at the residence site. The Chudley and Elliott model assumes a constant jump length d, with the Lorentzian HWHM dependence on Q being:
 | (4) |
 | (5) |
 | (6) |
![[thin space (1/6-em)]](https://www.rsc.org/images/entities/char_2009.gif) φ
φ | (7) |
| I(Q,t) = exp(−DQ2t), | (8) |
The diffusion coefficient may then be obtained relatively simply if the diffusion is in the Fickian regime. A time Fourier transform of I(Q,t) results in S(Q,ω); thus broadenings may be obtained and diffusion coefficients and jump parameters may also be derived as in Section 2.2.1.
An important characteristic of both QENS and NSE experiments is that they sample the same time and length scales as molecular dynamics (MD) simulations. This combination of techniques has proved to give unique insight into molecular behaviour in catalytic systems15,25–29 and will feature prominently in this article.
3. Hydrocarbon behaviour in MFI zeolite catalysts
The study of hydrocarbon dynamics in zeolite catalysts is of great importance due to its relevance to processes such as cracking of hydrocarbons in the petrochemical industry.30–33 A significant amount of recent work, both theoretical and experimental, has been carried out studying the diffusion of hydrocarbons in the MFI zeolite structure,34–45 which is the framework type of the industrially important ZSM-5 and its siliceous analogue, silicalite-1. With these applications in mind, we will discuss studies where QENS (particularly in combination with MD simulations) has gained important insights into straight chain and branched hydrocarbon dynamics in MFI zeolites.3.1 n-Alkane diffusion in silicalite-1 and Na-ZSM-5
The diffusion of longer n-alkanes in the MFI framework has been of recent interest and has been studied using QENS in both Na-ZSM-546 and silicalite-1.47 The effect on n-octane diffusion of the presence of extra-framework cations was studied by Leroy and Jobic48 who measured the diffusion coefficient in both silicalite-1 and Na-ZSM-5. QENS spectra obtained at Q = 0.29 Å−1 at 300 K in the two materials are shown in Fig. 1 (left), where the broader spectrum in silicalite-1 illustrates the increased mobility over this length scale in silicalite-1. The Singwi and Sjölander jump diffusion model19 was then used to fit the broadenings as a function of Q as shown in Fig. 1 (right), giving the Ds at 300 K in silicalite-1 of 2.0 × 10⁻¹⁰ m2 s−1, four times higher than that in Na-ZSM-5, illustrating the extent to which the presence of Na+ counterions decrease the mobility of n-octane.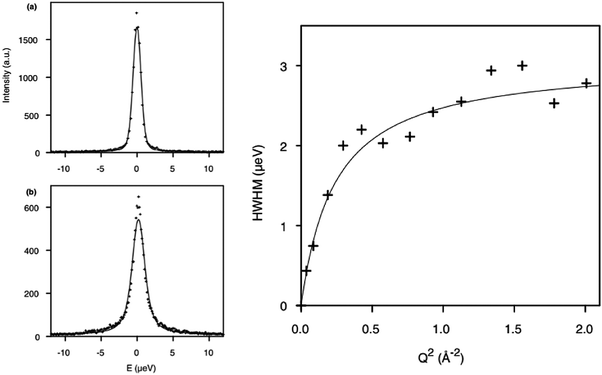 | ||
| Fig. 1 (left) QENS spectra obtained and fitted for n-octane (top) Na-ZSM-5, 0.9 mol/uc and (bottom) silicalite-1 (1.56 mol/ucl) at 300 K. (right) Broadenings derived for QENS spectra and fitted to the Singwi and Sjölander jump diffusion model for n-octane in silicalite-1 at 300 K. Reproduced from ref. 48 with permission from Elsevier. | ||
The diffusion of longer n-alkanes (C8–C20) was also studied in these zeolites.47 The diffusion coefficients obtained as a function of chain length are plotted against those obtained using other methods including PFG-NMR, MD and hierarchical simulations (which employed coarser grain models) in Fig. 2.35,47,49,50 The measured values of Ds for the QENS experiments were found to be in very close agreement with hierarchical simulations.
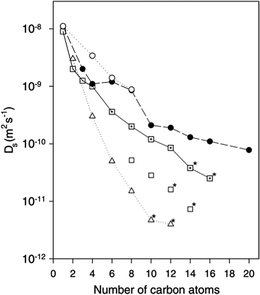 | ||
| Fig. 2 Self-diffusivities obtained at 300 K from MD simulations (○),35 hierarchical simulations (●),50 QENS in Na-ZSM-5 (□),46 QENS in silicalite-1 (⊡)47 and PFG-NMR (Δ).49 * = extrapolation to 300 K. Figure reproduced from ref. 47 with permission from the American Chemical Society. | ||
For example, the difference in Ds between simulation and experiment for decane is less than a factor of two, particularly close considering the experimental errors of the QENS values (30% from C8 to C12 and 50% for C14 and C16) and the error associated with the coarse-graining procedures of the simulations. Activation energies obtained as a function of chain length, however, did not quite replicate such a close agreement. Closer agreement with the QENS experiments was found in more recent atomistic molecular dynamics simulations for these systems.51 Loadings matching experiment were used (therefore accounting for sorbate/sorbate interactions), employing a flexible zeolite framework and explicit atom model of the hydrocarbon, a view of the system is displayed in Fig. 3.
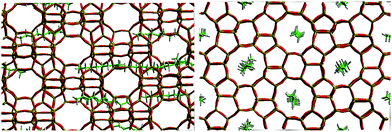 | ||
| Fig. 3 A view of the system for octane in silicalite-1 pre-production run at 300 K viewed down the (left) 010 direction and (right) 100 direction. Reproduced from ref. 51 with permission from the PCCP Owner Societies. | ||
The diffusion coefficients for all chain lengths at 300 K using QENS, along with simulations of different complexity, are compared in Fig. 4. Our most complex simulations (using a fully atomistic hydrocarbon model, a flexible zeolite framework and experimental loadings) gave the closest agreement, with all the calculated diffusion coefficients, within a factor of five of the QENS measurements, consistently closer to the experimental regime than the simpler models.50,52,53 As is common when comparing QENS experiments with simulations, the diffusion coefficients obtained by MD are higher than those obtained experimentally, despite the sophisticated model and use of experimental loadings. This discrepancy can probably be attributed to the use of a perfect silicalite-1 crystal in the simulations, allowing for faster, less hindered diffusion on the nanometre scale. The sample used in the QENS experiments would have point defects such as silanol nests and grain boundaries on the nanometre scale as well as surface effects from each crystallite, which are not accounted for under the periodic boundary conditions employed by the simulation.
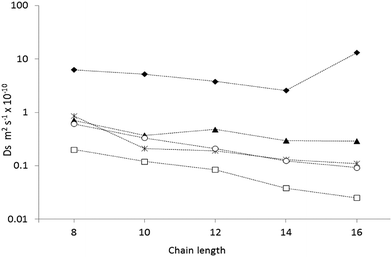 | ||
| Fig. 4 A plot of the calculated diffusion coefficients from the MD simulations using experimental loadings (O),57 MD simulations at infinite dilution53 (▲), MD simulations using more primitive models52 (◆), Hierarchical simulations50 (*) and QENS studies47 (□). Reproduced from ref. 51 with permission from the PCCP Owner Societies. | ||
Activation energies obtained by QENS, together with those for our most complex MD simulations and hierarchical simulations are plotted in Fig. 5. We can see that the trend (a roughly monotonic increase with chain length) of the calculated activation energies, follows that observed by QENS. A significant source for discrepancy between experiment and simulation for the longest alkanes was uncovered by neutron spin-echo experiments.54 For longer alkanes, redistribution of the molecules throughout the crystal was observed at higher temperatures, allowing the molecules to cross internal barriers and access other parts of the crystal. As the simulations were carried out using periodic boundary conditions, this redistribution behaviour cannot be modelled as the supercells employed cannot be large enough to sample this behaviour. The activation energies in the MD simulations were consistently lower than those obtained by QENS experiments probably due to the factors discussed above relating to defects in the experimental sample. The trend and agreement in activation energies between the most sophisticated MD results and the QENS experiments is a marked improvement compared to that of the hierarchical simulations, suggesting that although the coarse-grained method is accurate at 300 K, this accuracy is not maintained at higher temperatures.
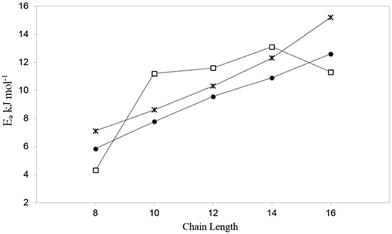 | ||
| Fig. 5 A plot of the activation energy of diffusion with chain length, for the MD studies at experimental loadings (•),51 QENS studies47 (*) and hierarchical simulations (□).50 Reproduced from ref. 51 with permission from the PCCP Owner Societies. | ||
3.2 Branched alkane diffusion in silicalite-1 and Na-ZSM-5
Though the majority of work studying molecular diffusion in the MFI framework focuses on n-alkanes, branched alkanes are just as prevalent in fluid catalytic cracking and molecular sieving systems under industrial conditions.31 Microscopic techniques such as quasielastic neutron scattering have rarely been used to study these systems, mainly due to the low resolution of instrumentation which led previously to significant errors in measured diffusion coefficients for the slower moving branched sorbates. A study of isobutane in ZSM-5 gave diffusivities that were an order of magnitude lower using QENS than supported membrane studies, consistent with previously observed differences between macroscopic and microscopic techniques.55 The HWHM broadenings of the elastic peak measured for isobutane in ZSM-5 are shown in Fig. 6 (left) along with a QENS spectrum at Q = 0.87 Å−1 (right). We note that the broadenings are very small with respect to the resolution function (15%) indicating very low mobility (far lower than for longer n-alkanes). At the higher Q values (0.4–0.8 Å−1) the broadenings could be fitted with the Singwi and Sjölander19 jump diffusion model (the broadenings at low Q were too small to be determined), with a mean jump distance of 4.5 Å and residence time of 6 ns. The self-diffusion coefficient of isobutane in ZSM-5 was found to be about three orders of magnitude lower than that of n-butane in the same zeolite.56 However, the inability to measure at low Q lead to errors in Ds of a factor of 4, much larger than the usual error, ∼50%.56–58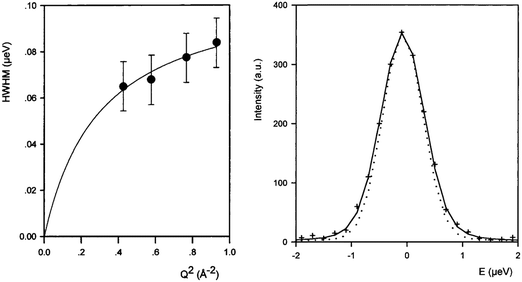 | ||
| Fig. 6 (left) Broadenings obtained for isobutane in ZSM-5 at 570 K, and QENS spectra obtained at 570 K (Q = 0.87 Å). The dotted line is the resolution function. Reproduced from ref. 55 with permission of the American Chemical Society. | ||
Recent work has used the neutron spin-echo (NSE) method and fully atomistic MD simulations to measure isobutane diffusion in silicalite-1, in the temperature range of 450–550 K.59 The simulations were carried out using a contemporary flexible zeolite potential and explicit atom hydrocarbon model as in Section 3.1. Experimentally, the NSE method is especially appropriate because of its ability to measure diffusion coefficients of very slow moving sorbates in smaller pore zeolites with very high precision, owing to the high resolution of the instruments. Normalized intermediate scattering functions (I(Q,t)) obtained experimentally for isobutane in silicalite-1 at 491 K at Q = 0.2 and 0.3 Å−1 are shown in Fig. 7. On comparing 3D and 1D diffusion models, the 3D diffusion model provides a better fit to the experimental points than 1D diffusion, which implies that isobutane molecules are able to explore both straight and sinusoidal channels. The observation contrasts with previous QENS and NSE measurements of n-alkanes longer or equal to C8, which diffuse mainly along the straight channels.46,54
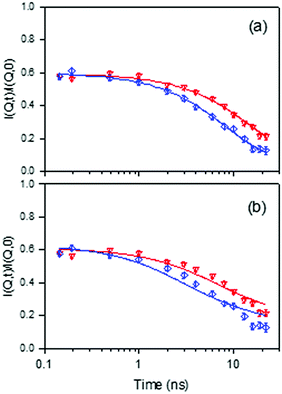 | ||
Fig. 7 Comparison between experimental and calculated normalized intermediate scattering functions obtained for isobutane in silicalite-1 at 491 K, for Q = 0.2 ( ) and 0.3 Å−1 ( ) and 0.3 Å−1 ( ). The solid lines are calculated with: (a) a 3D diffusion model, and (b) a 1D diffusion model. Reproduced from ref. 59 with permission from the American Chemical Society. ). The solid lines are calculated with: (a) a 3D diffusion model, and (b) a 1D diffusion model. Reproduced from ref. 59 with permission from the American Chemical Society. | ||
Temporal decays extracted from the intermediate scattering functions can be expressed as energy broadenings as shown in Fig. 8, when plotted as a function of Q2. The trend is characteristic of the Chudley–Eliott jump model18 with a fixed jump length of 10 Å, previously used in the case of benzene in ZSM-5, which concluded a residence period at the intersection between straight and sinusoidal channels, and jump diffusion between them.60 The diffusivities were then extracted from the low-Q range.15
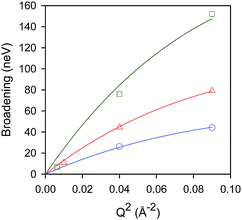 | ||
Fig. 8 Broadenings obtained for isobutane in silicalite-1 at: 444 K ( ), 491 K ( ), 491 K ( ), and 550 K ( ), and 550 K ( ). The solid lines correspond to a Chudley–Elliot jump diffusion model. Reproduced from ref. 59 with permission from the American Chemical Society. ). The solid lines correspond to a Chudley–Elliot jump diffusion model. Reproduced from ref. 59 with permission from the American Chemical Society. | ||
The experimental diffusion coefficients are plotted in Fig. 9. When compared to the study discussed above of isobutane in ZSM-5,55 the diffusion coefficients were about one order of magnitude higher in silicalite-1. Counterintuitively, the activation energy measured in ZSM-5 was lower than that in silicalite-1 (17 kJ mol−1 in ZSM-5 compared to 22.6 kJ mol−1 in silicalite-1). However, since the broadenings were small compared with the instrumental resolution for the ZSM-5 measurements, the errors were much larger than in this study.
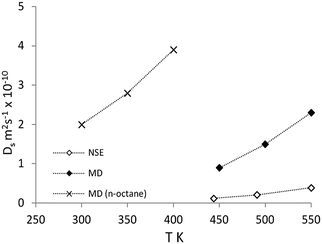 | ||
| Fig. 9 Comparison of diffusion coefficients of isobutane from NSE (◊) and MD (♦) compared with previous simulations of n-octane diffusion in ref. 51 (×). Reproduced from ref. 59 with permission from the American Chemical Society. | ||
On comparison with MD simulations, the calculated diffusion coefficients are all within a factor of 7.5 of experimental results. Diffusion coefficients calculated by MD were in the upper limit of experimental results, which as in previous section, can be attributed to the use of a perfect periodic silicalite-1 crystal structure in these simulations. The activation energy of diffusion was calculated as 19.2 kJ mol−1![[thin space (1/6-em)]](https://www.rsc.org/images/entities/char_2009.gif) :
:![[thin space (1/6-em)]](https://www.rsc.org/images/entities/char_2009.gif) 3.4 kJ mol−1 (∼15%) lower than that observed by the NSE experiments.
3.4 kJ mol−1 (∼15%) lower than that observed by the NSE experiments.
The mean square displacement (MSD) plot in the possible directions obtained from the MD simulations was examined to observe preference for a specific channel system, which can also be illustrated by the use of a trajectory plot to show specific locations of molecules. The directional MSD plot of a single isobutane molecule at 450 K is shown in Fig. 10, which indicates that the molecule is diffusing in both channel systems, but shows preference for the 〈100〉 direction (the sinusoidal channels), in contrast with n-alkanes where the 010 channel is preferred. The ability to explore both the straight and sinusoidal channels would agree with the 3D diffusion observed by NSE (Fig. 7). The trajectory plot (Fig. 11) shows molecular trapping in the very small section of the sinusoidal channel between intersections (ca. 3 Å in length), then movement between two adjacent sinusoidal channel segments via the straight channel segment connecting them.
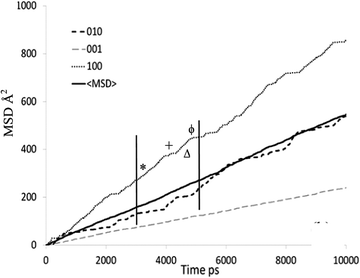 | ||
| Fig. 10 MSD plot in all directions of an individual isobutane molecule in silicalite-1 at 450 K. Each symbol signifies the assigned portion of the trajectory plot shown in Fig. 11. Reproduced from ref. 59 with permission from the American Chemical Society. | ||
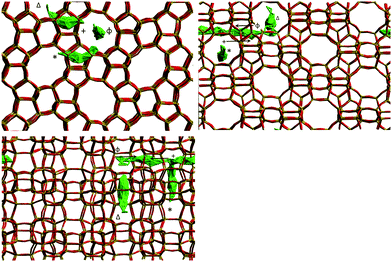 | ||
| Fig. 11 Trajectory plot of isobutane in silicalite-1 at 450 K between 3000 ps and 5000 ps of the MD simulation run. The symbols represent the appropriate portion of the associated MSD plot in Fig. 10. Reproduced from ref. 59 with permission from the American Chemical Society. | ||
The movement in the 〈100〉 direction is clearly consistent with the experimentally observed jump diffusion mechanism, but between sinusoidal segments. The 10 Å jump length between sinusoidal segments matches that observed in the NSE experiments. This preference for molecular siting in the sinusoidal channels was attributed to the favourable interactions between the molecule and channel walls, enabled by the increased access and geometric freedom offered by the use of a flexible silicalite-1 framework, absent from previous simulations performed with configurational-bias Monte Carlo and non-equilibrium molecular dynamics61,62
The breathing of the framework in this simulation allows for both sustained access, and framework relaxation around the isobutane accommodating this preferred siting. The isobutane then makes the 10 Å jumps between adjacent sections of sinusoidal channel. This study illustrates how the use of more sophisticated MD models can not only give accurate quantitative agreement with QENS/NSE, but may reveal different qualitative behaviours of the sorbate upon comparison with neutron data.
4. QENS and INS studies of the methanol-to-hydrocarbon (MTH) process
The industrial conversion of alcohols to hydrocarbons was first commercialised in the Mobil methanol-to-gasoline process using an HZSM-5 catalyst, in New Zealand in 1986.63 The availability of cheap methanol derived from natural gas was the initial driver for these technologies. In the future, biomass and other renewable resources are likely to provide a ready supply of methanol, via gasification and subsequent hydrogenation of CO/CO2.The mechanism is generally believed64 to be via a ‘hydrocarbon pool’ that forms in the pores of the zeolite. At steady-state, as shown in Fig. 12, methanol is dehydrated to alkenes, which undergo subsequent reactions to generate methylated aromatics, predominantly methyl benzenes; the dual-cycle’ mechanism. Deactivation is by coke formation, which may be graphitic, aromatic or polymeric in nature i.e. too large to leave the surface (internal or external) of the zeolite. While a considerable amount of work has been carried out on this important process, there are still many areas of uncertainty including: how does the first C–C bond form; what are the species in the hydrocarbon pool; and what is the nature of the coke? As zeolites are transparent to neutrons, neutron spectroscopy should provide new insight into some of these problems.
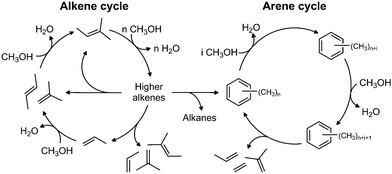 | ||
| Fig. 12 The dual-cycle mechanism operative in the hydrocarbon pool. Reproduced with permission of Elsevier from: M. Westgård Erichsen, S. Svelle and U. Olsbye, Catal. Today, 2013, 215, 216–223. | ||
The interaction and transport of methanol in H-ZSM-5 is a key issue. QENS is readily able to probe motion in zeolites, so the mobility of methanol in H-ZSM5 and HY was compared65 HY was chosen because it is inactive for the MTH process and so provides a reference material. We see, Fig. 13, that the two materials behave very differently. The significant broadening in HY is completely consistent with diffusing methanol. MD simulations29 supported this interpretation and showed the presence of hydrogen-bonded methanol in the pores. In contrast, the close fit to the resolution function in H-ZSM-5 suggests that methanol is immobile on the instrumental time scale.
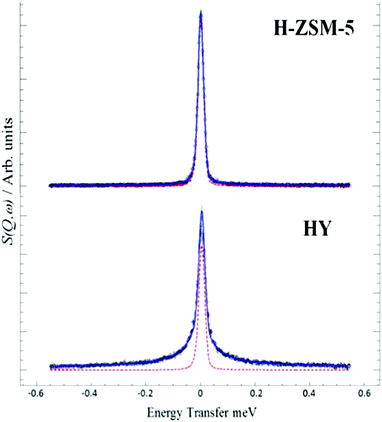 | ||
| Fig. 13 QENS spectra at 298 K of methanol loaded in zeolites H-ZSM-5 and HY at Q = 0.9 Å, (--) represents the resolution data taken at 5 K. Reproduced from ref. 65 with permission of the Royal Society of Chemistry. | ||
INS spectroscopy enables the differences in the QENS to be rationalised, Fig. 14. Clean HY shows the characteristic hydroxyl stretch, 3720 cm−1, and bend modes, 1095 cm−1, Fig. 14(a). After loading with methanol, Fig. 14(b), new bands appear at 3020, 1495, 1155 and 720 cm−1. Comparison with solid methanol, Fig. 14(c), shows that these are the unresolved C–H and O–H stretch modes, the methyl deformation, the methyl rock and the C–O–H deformation respectively. The methanol O–H stretch and deformation modes have broadened and shifted on absorption, consistent with the hydrogen-bonding suggested by the QENS and MD results. For H-ZSM5, Fig. 14(d), the framework hydroxyl modes are at similar positions, 3660 and 1095 cm−1, as in HY. However, on absorption of methanol, Fig. 14(e), while the methyl stretch, deformation and rock are at similar positions to those in HY, the methanol O–H stretch and deformation modes have vanished. These observations suggest that complete conversion of methanol to framework methoxy has occurred, which is remarkable, as methanol was introduced at 298 K; thus methoxylation of the Brønsted acid sites, the first step in the MTH process, has occurred at room temperature contrary to studies using more conventional spectroscopy techniques66–68 and modelling studies69–72 which suggest a significant energy barrier to the process.
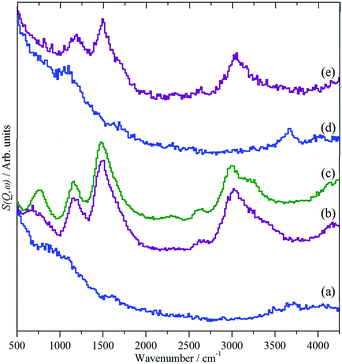 | ||
| Fig. 14 INS spectra of methanol loaded in zeolites HY and H-ZSM-5.65 (a) Clean HY, (b) HY + methanol, (c) solid methanol, (d) clean H-ZSM5 and (e) H-ZSM5 + methanol. | ||
INS spectroscopy has also been used to investigate the working catalyst.73,74 A series of samples74 with different time and temperature on-stream were prepared using the react-and-quench method. These experiments used the reactor75 that had been developed to carry out reactions on the 10 g scale required for INS rather than the 10 mg scale used in conventional microreactor studies. The samples were characterised by a battery of techniques (infrared spectroscopy, temperature programmed oxidation (to determine carbon content), EPR and GC-MS analysis of the downstream catch-pot used to collect the liquid products (water and hydrocarbons)).
Fig. 15 shows the results of different preparation conditions. Two INS spectrometers were used for the work:74 green traces are from an instrument with good resolution and modest sensitivity, blue from one with modest resolution and high sensitivity. The catalyst was activated by dehydration at 350 °C in flowing helium, Fig. 15(a). As expected, these results just show the hydroxyls of the Brønsted acid sites. The bending mode shows two components at 1130 and 1185 cm−1, suggesting there may be two distinct sites.
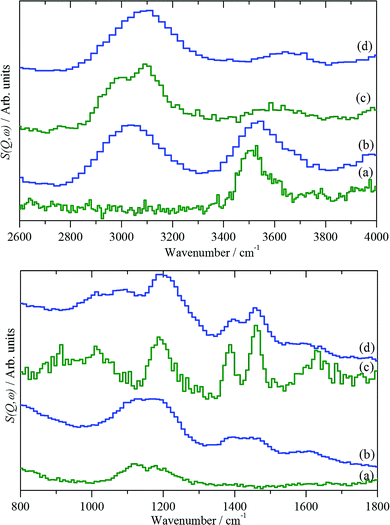 | ||
| Fig. 15 INS spectra of H-ZSM5 under different conditions for the MTH reaction.74 (a) The clean catalyst after dehydration at 350 °C and after reaction with methanol at: (b) 350 °C for 1 hour, (c) 350 °C for 3 days and (d) 400 °C for 3 days. Upper part: the C–H and O–H stretch region. Lower part: the fingerprint region. | ||
After one hour on-stream at 350 °C, on-line mass spectroscopy74 shows that the catalyst is producing predominantly olefins. The infrared spectrum74 indicates that the hydroxyl groups are largely unchanged and shows the presence of a weak peak at 2920 cm−1, assigned to aliphatic species. The INS spectra, Fig. 15(b), shows the hydroxyls and a C–H stretch peak at 3040 cm−1. The transition energy indicates this hydrocarbonaceous moiety to be olefinic/aromatic in nature, i.e. C(sp2)H. In both infrared and INS spectroscopies, the intensity is directly proportional to the number of oscillators present, however, in the infrared the intensity is weighted by the extinction coefficient, which is a molecular property, so it is different for aliphatic C–H, aromatic C–H and hydroxyl O–H vibrations. In contrast, for INS the weighting is by the amplitude of vibration, which in the harmonic approximation is about the same for both C–H and O–H vibrations, so that the intensities directly reflect the number of oscillators present.
Under our conditions, at 350 °C, the catalyst reaches steady state in a few hours. After 3 days at 350 °C, Fig. 15(c), the O–H stretch mode has largely disappeared and the spectrum is dominated by peaks at 2990 and 3090 cm−1, indicating a co-existence of sp2 and sp3 hybridised C–H bonds. The INS relative intensities of the C(sp3)–H and C(sp2)–H modes are approximately equal, implying equal numbers of each. It is noted that this is inconsistent with the presence of only polymethylated aromatics, which should have a larger number of aliphatic C–H moieties. In the deformation region there are peaks at 1639, 1460, 1390, and 1190 cm−1 and a broad feature at 800–1100 cm−1. The 1460, 1390, and 1190 cm−1 modes are assigned as the methyl asymmetric bend, symmetric bend, and rock, respectively of methylated aromatic species.
Fig. 15(d) shows the results after 3 days reaction at 400 °C. The higher temperature was chosen in order to produce a deactivated catalyst, which did not happen and the catalyst was still working when the reaction was stopped. A strong C–H feature is present at 3095 cm−1, with the peak maximum implying a predominance of C(sp2)H species; the only indication for the presence of C(sp3)H moieties is that the peak is asymmetric to the low energy side. In the fingerprint region, the spectrum resembles that of the 3 days at 350 °C sample, Fig. 15(c). Three new features at 1090, 939 and 782 cm−1 are present, which are thought to arise from aryl C–H wag vibrations and may indicate a contribution from naphthalenic species, which are observed in the catch-pot. This may reflect a change in the balance between the two parts of the dual-cycle mechanism, Fig. 12.
These initial investigations show that INS spectroscopy does indeed offer a way to see unseen features of the MTH process. It enables the fingerprint region to be observed, which is inaccessible to infrared spectroscopy because of the intense framework absorption. In the C–H/O–H stretch region, it allows relative populations to be assessed quantitatively. The samples described here have carbon contents in the range 2–8 wt%, INS will be even more useful for deactivated samples where the coke content reaches 14–18 wt%,76 and the samples are completely black.
5. INS studies of methane reforming
With oil reserves diminishing and significant volatility in the price of oil, interest in methane both as a fuel and as a chemical feedstock is growing. To exploit methane in this manner, its conversion to synthesis gas is a common requirement, which commercially is carried out using steam as the oxidant (steam reforming):| CH4 + H2O → CO + 3H2 | (9) |
| CH4 + CO2 → 2CO + 2H2 | (10) |
Nickel catalysts are most commonly used for both steam and dry reforming, but are susceptible to coking which results in catalyst deactivation. The extent of carbon retention by the reforming catalyst can be analysed by temperature programmed oxidation. However, it is much more difficult to determine the amount of retained hydrogen in the carbonaceous overlayer. The presence of large amounts of coke means that infrared spectroscopy is very difficult (but not impossible).77 Coke does not impede INS spectroscopy and it was expected that the technique would aid characterisation of the coke, which proved correct and INS was used to investigate how variations in reaction conditions, catalyst preparation and oxidant (dry or steam reforming) modified the carbonaceous overlayer.77–82
One of the goals was to both speciate and quantify78 the hydrogen retained by the catalyst. In the harmonic approximation, the amplitude of vibration, Ui, of mode ωi is given by:
 | (11) |
Fig. 16 shows the INS spectrum (2500–4000 cm−1) of a Ni(45%)/Al2O3 catalyst after undergoing ‘dry’ reforming of methane at 1073 K for six hours.78 There is a weak C–H stretch peak at 2935 cm−1 and a stronger O–H stretch at 3339 cm−1. Quantification of both peaks was possible using polystyrene and Mg(OH)2 as calibrants fpr the C–H and O–H stretch regions, respectively.
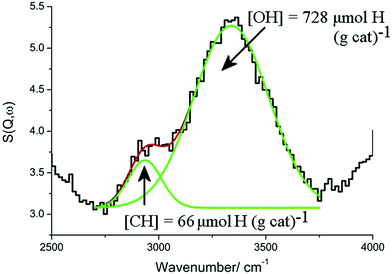 | ||
| Fig. 16 The INS spectrum (2500–4000 cm−1) of a Ni(45%)/Al2O3 catalyst after undergoing ‘dry’ reforming of methane at 1073 K for six hours. The experimental data are well described by a combination of two Gaussian curves (green lines) centred at 2935 and 3339 cm−1, which are obtained from a non-linear least squares fitting procedure. The solid red line represents the overall fit. Adapted from ref. 78 by permission of the PCCP Owner Societies. | ||
Fig. 17 compares the results of dry reforming80 and steam reforming82 at 898 K, both using a Ni(26%)/Al2O3 catalyst. In comparison with Fig. 16, the low signal-to-noise ratio indicates that there is considerably less hydrogen present, which is confirmed by the quantitation: the C![[thin space (1/6-em)]](https://www.rsc.org/images/entities/char_2009.gif) :
:![[thin space (1/6-em)]](https://www.rsc.org/images/entities/char_2009.gif) H ratios are: 160
H ratios are: 160![[thin space (1/6-em)]](https://www.rsc.org/images/entities/char_2009.gif) :
:![[thin space (1/6-em)]](https://www.rsc.org/images/entities/char_2009.gif) 1, 2550
1, 2550![[thin space (1/6-em)]](https://www.rsc.org/images/entities/char_2009.gif) :
:![[thin space (1/6-em)]](https://www.rsc.org/images/entities/char_2009.gif) 1 and 11
1 and 11![[thin space (1/6-em)]](https://www.rsc.org/images/entities/char_2009.gif) 690
690![[thin space (1/6-em)]](https://www.rsc.org/images/entities/char_2009.gif) :
:![[thin space (1/6-em)]](https://www.rsc.org/images/entities/char_2009.gif) 1 for Fig. 16, 17(a) and (b) respectively. Table 1 shows how different conditions can drastically alter the nature of the hydrocarbonaceous overlayer, both in terms of the amount of retained hydrogen and the type of carbon generated. The picture that emerges is that the catalysts are very efficient at cycling hydrogen but much less so for carbon.
1 for Fig. 16, 17(a) and (b) respectively. Table 1 shows how different conditions can drastically alter the nature of the hydrocarbonaceous overlayer, both in terms of the amount of retained hydrogen and the type of carbon generated. The picture that emerges is that the catalysts are very efficient at cycling hydrogen but much less so for carbon.
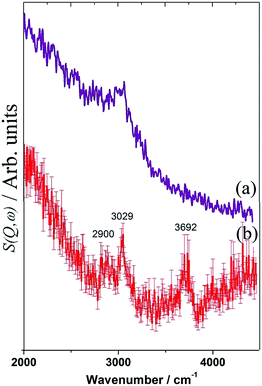 | ||
| Fig. 17 INS spectra of a Ni(26%)/Al2O3 catalyst after (a) dry reforming and (b) steam reforming of methane at 898 K for six hours. | ||
| Metal loading/wt% | Source of α-Al2O3 support | Reforming reaction | CH4![[thin space (1/6-em)]](https://www.rsc.org/images/entities/char_2009.gif) : :![[thin space (1/6-em)]](https://www.rsc.org/images/entities/char_2009.gif) CO2 CO2 |
Reaction temperature/K | Type of carbon produced | C![[thin space (1/6-em)]](https://www.rsc.org/images/entities/char_2009.gif) : :![[thin space (1/6-em)]](https://www.rsc.org/images/entities/char_2009.gif) H H |
|---|---|---|---|---|---|---|
| 45 | Sumitomo Chemical | Dry | 2![[thin space (1/6-em)]](https://www.rsc.org/images/entities/char_2009.gif) : :![[thin space (1/6-em)]](https://www.rsc.org/images/entities/char_2009.gif) 1 1 |
1073 | Amorphous | 160![[thin space (1/6-em)]](https://www.rsc.org/images/entities/char_2009.gif) : :![[thin space (1/6-em)]](https://www.rsc.org/images/entities/char_2009.gif) 1 1 |
| 26 | Alfa Aesar | Dry | 1![[thin space (1/6-em)]](https://www.rsc.org/images/entities/char_2009.gif) : :![[thin space (1/6-em)]](https://www.rsc.org/images/entities/char_2009.gif) 1 1 |
898 | Filamentous | 2550![[thin space (1/6-em)]](https://www.rsc.org/images/entities/char_2009.gif) : :![[thin space (1/6-em)]](https://www.rsc.org/images/entities/char_2009.gif) 1 1 |
| 26 | Alfa Aesar | Steam | 898 | Filamentous | 11![[thin space (1/6-em)]](https://www.rsc.org/images/entities/char_2009.gif) 690 690![[thin space (1/6-em)]](https://www.rsc.org/images/entities/char_2009.gif) : :![[thin space (1/6-em)]](https://www.rsc.org/images/entities/char_2009.gif) 1 1 |
The susceptibility of Ni-based catalysts to coking has led to a search for alternatives. Ru and Rh are more resistant to carbon deposition but are uneconomic for large-scale industrial applications. Co may also be used for dry reforming and it has been reported that Ni–Co bimetallic catalysts offer enhanced performance over the single metal catalysts.
Fig. 18 compares the INS spectra81 of 25 wt% Ni/Al2O3, Co/Al2O3 and Ni(Co)/Al2O3 (Ni![[thin space (1/6-em)]](https://www.rsc.org/images/entities/char_2009.gif) :
:![[thin space (1/6-em)]](https://www.rsc.org/images/entities/char_2009.gif) Co molar ratio 4
Co molar ratio 4![[thin space (1/6-em)]](https://www.rsc.org/images/entities/char_2009.gif) :
:![[thin space (1/6-em)]](https://www.rsc.org/images/entities/char_2009.gif) 1). The different intensities of the OH stretch modes implies that the catalysts possess different acidity, in the order Ni/Al2O3 > Co/Al2O3 > Ni(Co)/Al2O3. An acidic surface favours catalyst coking in dry reforming and thus it is reasonable to infer that more carbon will be deposited on the Ni/Al2O3 catalyst, compared to the Co/Al2O3 and the bimetallic catalyst. INS features at around 3000 cm−1 are assigned to C–H stretch vibrations of unsaturated aromatic moieties. The C–H vibration for the bimetallic Ni–Co catalyst is red-shifted with respect to that for the pure Ni catalyst, suggesting a larger contribution from aliphatic species. The 3000 cm−1 vibration is absent from the spent Co/Al2O3 catalyst although a very weak vibration is present at 2900 cm−1, due to aliphatic moieties. The INS spectra reveal that relatively less aromatic carbonaceous but more aliphatic species are deposited on spent Co/Al2O3 and Ni(Co)/Al2O3 catalysts, in comparison to the pure Ni catalyst. The formation of filamentous carbon is more associated with the presence of highly polymerized aromatic species and the preference to aliphatic carbon on Co/Al2O3 catalyst is a significant factor for its resistance to coking.
1). The different intensities of the OH stretch modes implies that the catalysts possess different acidity, in the order Ni/Al2O3 > Co/Al2O3 > Ni(Co)/Al2O3. An acidic surface favours catalyst coking in dry reforming and thus it is reasonable to infer that more carbon will be deposited on the Ni/Al2O3 catalyst, compared to the Co/Al2O3 and the bimetallic catalyst. INS features at around 3000 cm−1 are assigned to C–H stretch vibrations of unsaturated aromatic moieties. The C–H vibration for the bimetallic Ni–Co catalyst is red-shifted with respect to that for the pure Ni catalyst, suggesting a larger contribution from aliphatic species. The 3000 cm−1 vibration is absent from the spent Co/Al2O3 catalyst although a very weak vibration is present at 2900 cm−1, due to aliphatic moieties. The INS spectra reveal that relatively less aromatic carbonaceous but more aliphatic species are deposited on spent Co/Al2O3 and Ni(Co)/Al2O3 catalysts, in comparison to the pure Ni catalyst. The formation of filamentous carbon is more associated with the presence of highly polymerized aromatic species and the preference to aliphatic carbon on Co/Al2O3 catalyst is a significant factor for its resistance to coking.
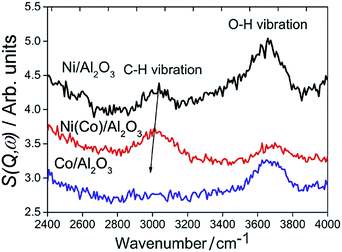 | ||
| Fig. 18 INS spectra of methane reforming catalysts after dry reforming at 873 K for six hours. Reproduced from ref. 81 by permission of the PCCP Owner Societies. | ||
INS spectroscopy provides a different perspective of adsorbates on catalysts. It is, of course, a complementary technique and it is essential that is backed-up by a range of physical, spectroscopic and electron microscopic methods, as in the work summarised here.
6. Conclusions
This review has, we hope, illustrated the unique power of neutron spectroscopy in probing the translational and vibrational dynamics of key molecular processes in catalytic systems. The ability of quasielastic techniques to measure molecular transport in catalysts is we consider, of growing importance in view of the increasingly clear significance of such transport processes in controlling catalytic processes. And as we have shown, vibrational spectroscopy with neutrons can interrogate sorbed molecules in environments which would be inaccessible to other spectroscopies and can provide data for modes and energies that cannot be reached by photon based techniques. Neutron spectroscopy will play a vital role in developing a detailed understanding of the molecular level processes in real catalytic reactions.The reader may find more recent examples of the applications of neutrons in catalysis in the recently published special issue of Physical Chemistry, Chemical Physics which is devoted to this topic.83
Conflicts of interest
There are no conflicts to declare.Acknowledgements
We are grateful to Dr Ian Silverwood, Prof. David Lennon and Prof. Herve Jobic for many useful discussions and collaborations. The UK Catalysis Hub is kindly thanked for resources and support provided via our membership of the UK Catalysis Hub Consortium and funded by EPSRC (grants EP/K014706/2, EP/K014668/1, EP/K014854/1, EP/K014714/1 and EP/M013219/1). Dr A. J. O’Malley is grateful to the Cardiff University school of chemistry and the Ramsay Memorial Trust are thanked for provision of a Ramsay Fellowship. Prof. Nora De Leeuw is thanked for funding under the EPSRC grant EP/K009567/2. The STFC Rutherford Appleton Laboratory is thanked for access to neutron beam facilities.References
- P. A. Wright, J. M. Thomas, A. K. Cheetham and A. K. Nowak, Nature, 1985, 318, 611–614 CrossRef.
- R. Goyal, A. Fitch and H. Jobic, J. Phys. Chem. B, 2000, 104, 2878–2884 CrossRef CAS.
- M. Falkowska, S. Chansai, H. G. Manyar, L. F. Gladden, D. T. Bowron, T. G. Youngs and C. Hardacre, Phys. Chem. Chem. Phys., 2016, 18, 17237–17243 RSC.
- M. E. Potter, A. J. O’Malley, S. Chapman, J. Kezina, S. H. Newland, I. P. Silverwood, S. Mukhopadhyay, M. Carravetta, T. M. Mezza, S. F. Parker, C. R. A. Catlow and R. Raja, ACS Catalysis, 2017, 7, 2926–2934 CrossRef CAS.
- M. E. Potter, S. Chapman, A. J. O'Malley, A. Levy, M. Carravetta, T. M. Mezza, S. F. Parker and R. Raja, ChemCatChem, 2017, 9, 1897–1900 CrossRef CAS.
- J. Niemantsverdriet, Spectroscopy in Catalysis: An Introduction, 3rd edn, Wiley-VCH Verlag GmbH & Co. KGaA, 2007, pp. 179–216 Search PubMed.
- P. C. H. Mitchell, S. F. Parker, A. J. Ramirez-Cuesta and J. Tomkinson, Vibrational spectroscopy with neutrons: with applications in chemistry, biology, materials science and catalysis, World Scientific, 2005 Search PubMed.
- C. G. Windsor, J. Appl. Crystallogr., 1988, 21, 582–588 CrossRef CAS.
- T. G. Youngs, H. Manyar, D. T. Bowron, L. F. Gladden and C. Hardacre, Chem. Sci., 2013, 4, 3484–3489 RSC.
- J. Daillant and A. Gibaud, X-ray and neutron reflectivity: principles and applications, Springer, 2008 Search PubMed.
- B. T. M. Willis and C. J. Carlile, Experimental neutron scattering, Oxford University Press, 2017 Search PubMed.
- P. W. Albers, D. Lennon and S. F. Parker, in Neutron Scattering - Applications in Biology, Chemistry, and Materials Science, ed. F. Fernando-Alonso and D. L. Price, Experimental Methods in the Physical Sciences, Academic Press, 2017, ch. 5, vol. 49, pp. 279–348 Search PubMed.
- S. F. Parker, Chem. Commun., 2011, 47, 1988–1990 RSC.
- R. Juárez, S. F. Parker, P. Concepción, A. Corma and H. García, Chem. Sci., 2010, 1, 731–738 RSC.
- H. Jobic and D. N. Theodorou, Microporous Mesoporous Mater., 2007, 102, 21–50 CrossRef CAS.
- M. Bée, Quasielastic Neutron Scattering, Adam Hilger, 1988 Search PubMed.
- A. J. O’Malley and C. R. A. Catlow, in Neutron Scattering - Applications in Biology, Chemistry, and Materials Science, ed. F. Fernando-Alonso and D. L. Price, Experimental Methods in the Physical Sciences, Academic Press, 2017, ch. 6, vol. 49, pp. 349–401 Search PubMed.
- C. Chudley and R. Elliott, Proc. Phys. Soc., London, 1961, 77, 353 CrossRef.
- K. Singwi and A. Sjölander, Phys. Rev., 1960, 119, 863 CrossRef CAS.
- N. K. Kanellopoulos, Recent advances in gas separation by microporous ceramic membranes, Elsevier, 2000 Search PubMed.
- F. Mezei, in Neutron Spin Echo, ed. F. Mezei, Lecture Notes in Physics, Springer-Verlag, Berlin, 1980, vol. 122 Search PubMed.
- H. Jobic, A. Méthivier and G. Ehlers, Microporous Mesoporous Mater., 2002, 56, 27–32 CrossRef CAS.
- H. Jobic, M. Bée and S. Pouget, J. Phys. Chem. B, 2000, 104, 7130–7133 CrossRef CAS.
- P. D. Kolokathis, G. R. Káli, H. Jobic and D. N. Theodorou, J. Phys. Chem. C, 2016, 120, 21410–21426 CAS.
- A. J. O'Malley, I. Hitchcock, M. Sarwar, I. P. Silverwood, S. Hindocha, C. R. A. Catlow, A. P. York and P. Collier, Phys. Chem. Chem. Phys., 2016, 18, 17159–17168 RSC.
- R. Mukhopadhyay, A. Sayeed, S. Mitra, A. A. Kumar, M. N. Rao, S. Yashonath and S. Chaplot, Phys. Rev. E: Stat., Nonlinear, Soft Matter Phys., 2002, 66, 061201 CrossRef CAS PubMed.
- A. Sayeed, S. Mitra, A. Anil Kumar, R. Mukhopadhyay, S. Yashonath and S. Chaplot, J. Phys. Chem. B, 2003, 107, 527–533 CrossRef CAS.
- L. N. Gergidis, D. N. Theodorou and H. Jobic, J. Phys. Chem. B, 2000, 104, 5541–5552 CrossRef CAS.
- A. J. O'Malley, V. G. Sakai, I. P. Silverwood, N. Dimitratos, S. F. Parker and C. R. A. Catlow, Phys. Chem. Chem. Phys., 2016, 18, 17294–17302 RSC.
- S. M. Auerbach, K. A. Carrado and P. K. Dutta, Handbook of zeolite science and technology, CRC Press, 2003 Search PubMed.
- E. Vogt and B. Weckhuysen, Chem. Soc. Rev., 2015, 44, 7342–7370 RSC.
- J. Weitkamp and L. Puppe, Catalysis and zeolites: fundamentals and applications, Springer Science & Business Media, 2013 Search PubMed.
- B. Smit and T. L. Maesen, Chem. Rev., 2008, 108, 4125–4184 CrossRef CAS PubMed.
- M. Jiang, M. Eic, S. Miachon, J.-A. Dalmon and M. Kocirik, Sep. Purif. Technol., 2001, 25, 287–295 CrossRef CAS.
- F. Leroy, B. Rousseau and A. Fuchs, Phys. Chem. Chem. Phys., 2004, 6, 775–783 RSC.
- R. Krishna and J. Van Baten, Chem. Eng. J., 2008, 140, 614–620 CrossRef CAS.
- A. O. Koriabkina, A. M. de Jong, D. Schuring, J. van Grondelle and R. A. van Santen, J. Phys. Chem. B, 2002, 106, 9559–9566 CrossRef CAS.
- M. Yu, J. C. Wyss, R. D. Noble and J. L. Falconer, Microporous Mesoporous Mater., 2008, 111, 24–31 CrossRef CAS.
- J. Fried and S. Weaver, Comput. Mater. Sci., 1998, 11, 277–293 CrossRef CAS.
- F. Jianfen, B. Van de Graaf, H. Xiao and S. Njo, J. Mol. Struct.: THEOCHEM, 1999, 492, 133–142 CrossRef CAS.
- L. Song, Z.-L. Sun and L. V. Rees, Microporous Mesoporous Mater., 2002, 55, 31–49 CrossRef CAS.
- A. R. Teixeira, C.-C. Chang, T. Coogan, R. Kendall, W. Fan and P. J. Dauenhauer, J. Phys. Chem. C, 2013, 117, 25545–25555 CAS.
- D. M. Ruthven, M. Eic and E. Richard, Zeolites, 1991, 11, 647–653 CrossRef CAS.
- R. Q. Snurr and J. Kärger, J. Phys. Chem. B, 1997, 101, 6469–6473 CrossRef CAS.
- N. Van-Den-Begin, L. V. Rees, J. Caro, M. Bülow, M. Hunger and J. Kärger, J. Chem. Soc., Faraday Trans. 1, 1989, 85, 1501–1509 RSC.
- H. Jobic, J. Mol. Catal. A: Chem., 2000, 158, 135–142 CrossRef CAS.
- H. Jobic and D. N. Theodorou, J. Phys. Chem. B, 2006, 110, 1964–1967 CrossRef CAS PubMed.
- F. Leroy and H. Jobic, Chem. Phys. Lett., 2005, 406, 375–380 CrossRef CAS.
- H. Jobic, W. Schmidt, C. B. Krause and J. Kärger, Microporous Mesoporous Mater., 2006, 90, 299–306 CrossRef CAS.
- E. J. Maginn, A. T. Bell and D. N. Theodorou, J. Phys. Chem., 1996, 100, 7155–7173 CrossRef CAS.
- A. J. O'Malley and C. R. A. Catlow, Phys. Chem. Chem. Phys., 2015, 17, 1943–1948 RSC.
- R. C. Runnebaum and E. J. Maginn, J. Phys. Chem. B, 1997, 101, 6394–6408 CrossRef CAS.
- A. J. O'Malley and C. R. A. Catlow, Phys. Chem. Chem. Phys., 2013, 15, 19024–19030 RSC.
- H. Jobic and B. Farago, J. Chem. Phys., 2008, 129, 171102 CrossRef PubMed.
- B. Millot, A. Méthivier, H. Jobic, H. Moueddeb and M. Bée, J. Phys. Chem. B, 1999, 103, 1096–1101 CrossRef CAS.
- H. Jobic, M. Bée and J. Caro, in Proceedings of the 9th International Zeolite Conference, Montreal, 1992, ed. R. von Ballmoos, J. B. Higgins and M. M. Treacy, Butterworth-Heinemann, Boston, 1993, vol. II, p. 121 Search PubMed.
- H. Jobic, M. Bée and G. J. Kearley, Zeolites, 1989, 9, 312–317 CrossRef CAS.
- H. Jobic, M. Bée and G. J. Kearley, Zeolites, 1992, 12, 146–151 CrossRef CAS.
- A. J. O’Malley, C. R. A. Catlow, M. Monkenbusch and H. Jobic, J. Phys. Chem. C, 2015, 119, 26999–27006 Search PubMed.
- H. Jobic, M. Bée and S. Pouget, J. Phys. Chem. B, 2000, 104, 7130–7133 CrossRef CAS.
- T. Vlugt, W. Zhu, F. Kapteijn, J. Moulijn, B. Smit and R. Krishna, J. Am. Chem. Soc., 1998, 120, 5599–5600 CrossRef CAS.
- S. Furukawa, C. McCabe, T. Nitta and P. Cummings, Fluid Phase Equilib., 2002, 194, 309–317 CrossRef.
- C. Maiden, Stud. Surf. Sci. Catal., 1988, 36, 1–16 CrossRef CAS.
- U. Olsbye, S. Svelle, K. Lillerud, Z. Wei, Y. Chen, J. Li, J. Wang and W. Fan, Chem. Soc. Rev., 2015, 44, 7155–7176 RSC.
- A. J. O'Malley, S. F. Parker, A. Chutia, M. R. Farrow, I. P. Silverwood, V. García-Sakai and C. R. A. Catlow, Chem. Commun., 2016, 52, 2897–2900 RSC.
- T. R. Forester, S.-T. Wong and R. F. Howe, J. Chem. Soc., Chem. Commun., 1986, 1611–1613 RSC.
- T. Forester and R. F. Howe, J. Am. Chem. Soc., 1987, 109, 5076–5082 CrossRef CAS.
- L. Kubelková, J. Nováková and K. Nedomová, J. Catal., 1990, 124, 441–450 CrossRef.
- J. Van der Mynsbrugge, S. L. Moors, K. De Wispelaere and V. Van Speybroeck, ChemCatChem, 2014, 6, 1906–1918 CrossRef CAS.
- J. Andzelm, N. Govind, G. Fitzgerald and A. Maiti, Int. J. Quantum Chem., 2003, 91, 467–473 CrossRef CAS.
- C. Zicovich-Wilson, P. Viruela and A. Corma, J. Phys. Chem., 1995, 99, 13224–13231 CrossRef CAS.
- A. J. O'Malley, A. Logsdail, A. Sokol and C. R. A. Catlow, Faraday Discuss., 2016, 188, 235–255 RSC.
- R. F. Howe, J. McGregor, S. F. Parker, P. Collier and D. Lennon, Catal. Lett., 2016, 146, 1242–1248 CrossRef CAS.
- Suwardiyanto, R. F. Howe, E. K. Gibson, C. R. A. Catlow, A. Hameed, J. McGregor, P. Collier, S. F. Parker and D. Lennon, Faraday Discuss., 2017, 197, 447–471 RSC.
- R. Warringham, D. Bellaire, S. Parker, J. Taylor, R. Ewings, C. Goodway, M. Kibble, S. Wakefield, M. Jura and M. Dudman, J. Phys.: Conf. Ser., 2014, 54, 012005 CrossRef.
- D. Bibby, N. Milestone, J. Patterson and L. Aldridge, J. Catal., 1986, 97, 493–502 CrossRef CAS.
- I. P. Silverwood, N. G. Hamilton, J. Z. Staniforth, C. J. Laycock, S. F. Parker, R. M. Ormerod and D. Lennon, Catal. Today, 2010, 155, 319–325 CrossRef CAS.
- I. P. Silverwood, N. G. Hamilton, C. J. Laycock, J. Z. Staniforth, R. M. Ormerod, C. D. Frost, S. F. Parker and D. Lennon, Phys. Chem. Chem. Phys., 2010, 12, 3102–3107 RSC.
- I. P. Silverwood, N. G. Hamilton, A. R. McFarlane, J. Kapitán, L. Hecht, E. L. Norris, R. M. Ormerod, C. D. Frost, S. F. Parker and D. Lennon, Phys. Chem. Chem. Phys., 2012, 14, 15214–15225 RSC.
- A. R. McFarlane, I. P. Silverwood, R. Warringham, E. L. Norris, R. M. Ormerod, C. D. Frost, S. F. Parker and D. Lennon, RSC Adv., 2013, 3, 16577–16589 RSC.
- X. Liao, R. Gerdts, S. F. Parker, L. Chi, Y. Zhao, M. Hill, J. Guo, M. O. Jones and Z. Jiang, Phys. Chem. Chem. Phys., 2016, 18, 17311–17319 RSC.
- A. R. McFarlane, I. P. Silverwood, E. L. Norris, R. M. Ormerod, C. D. Frost, S. F. Parker and D. Lennon, Chem. Phys., 2013, 427, 54–60 CrossRef CAS.
- I. P. Silverwood, S. F. Parker and C. R. A. Catlow, Phys. Chem. Chem. Phys., 2016, 18 RSC.
| This journal is © The Royal Society of Chemistry 2017 |
